Cities with the Highest Percentage of South African Population in Massachusetts

RELATED REPORTS & OPTIONS

South African
Population
Families and Households
Female Fertility
Female Fertility (Unmarried)
Race (Community Size)
Race (Percentage)
Ancestry (Community Size)
AfghanAfricanAlaska NativeAlaskan AthabascanAlbanianAleutAlsatianAmericanApacheArabArapahoArgentineanArmenianAssyrian / Chaldean / SyriacAustralianAustrianBahamianBangladeshiBarbadianBasqueBelgianBelizeanBermudanBhutaneseBlackfeetBolivianBrazilianBritishBritish West IndianBulgarianBurmeseCajunCambodianCanadianCape VerdeanCarpatho RusynCelticCentral AmericanCentral American IndianCherokeeCheyenneChickasawChileanChineseChippewaChoctawColombianColvilleComancheCosta RicanCreeCreekCroatianCrowCubanCypriotCzechCzechoslovakianDanishDelawareDominicanDutchDutch West IndianEastern EuropeanEcuadorianEgyptianEnglishEstonianEthiopianEuropeanFijianFilipinoFinnishFrenchFrench American IndianFrench CanadianGermanGerman RussianGhanaianGreekGuamanian / ChamorroGuatemalanGuyaneseHaitianHmongHonduranHopiHoumaHungarianIcelanderIndian (Asian)IndonesianInupiatIranianIraqiIrishIroquoisIsraeliItalianJamaicanJapaneseJordanianKenyanKiowaKoreanLaotianLatvianLebaneseLiberianLithuanianLumbeeLuxembourgerMacedonianMalaysianMalteseMarshalleseMenomineeMexicanMexican American IndianMongolianMoroccanNative HawaiianNavajoNepaleseNew ZealanderNicaraguanNigerianNorthern EuropeanNorwegianOkinawanOsageOttawaPaiutePakistaniPalestinianPanamanianParaguayanPennsylvania GermanPeruvianPimaPolishPortuguesePotawatomiPuebloPuerto RicanPuget Sound SalishRomanianRussianSalvadoranSamoanScandinavianScotch-IrishScottishSeminoleSenegaleseSerbianShoshoneSierra LeoneanSiouxSlavicSlovakSloveneSomaliSouth AfricanSouth AmericanSouth American IndianSoviet UnionSpaniardSpanishSpanish AmericanSpanish American IndianSri LankanSubsaharan AfricanSudaneseSwedishSwissSyrianTaiwaneseThaiTlingit-HaidaTohono O'OdhamTonganTrinidadian and TobagonianTsimshianTurkishU.S. Virgin IslanderUgandanUkrainianUruguayanUteVenezuelanVietnameseWelshWest IndianYakamaYaquiYugoslavianYumanYup'ikZimbabwean
Ancestry (Percentage)
AfghanAfricanAlaska NativeAlaskan AthabascanAlbanianAleutAlsatianAmericanApacheArabArapahoArgentineanArmenianAssyrian / Chaldean / SyriacAustralianAustrianBahamianBangladeshiBarbadianBasqueBelgianBelizeanBermudanBhutaneseBlackfeetBolivianBrazilianBritishBritish West IndianBulgarianBurmeseCajunCambodianCanadianCape VerdeanCarpatho RusynCelticCentral AmericanCentral American IndianCherokeeCheyenneChickasawChileanChineseChippewaChoctawColombianColvilleComancheCosta RicanCreeCreekCroatianCrowCubanCypriotCzechCzechoslovakianDanishDelawareDominicanDutchDutch West IndianEastern EuropeanEcuadorianEgyptianEnglishEstonianEthiopianEuropeanFijianFilipinoFinnishFrenchFrench American IndianFrench CanadianGermanGerman RussianGhanaianGreekGuamanian / ChamorroGuatemalanGuyaneseHaitianHmongHonduranHopiHoumaHungarianIcelanderIndian (Asian)IndonesianInupiatIranianIraqiIrishIroquoisIsraeliItalianJamaicanJapaneseJordanianKenyanKiowaKoreanLaotianLatvianLebaneseLiberianLithuanianLumbeeLuxembourgerMacedonianMalaysianMalteseMarshalleseMenomineeMexicanMexican American IndianMongolianMoroccanNative HawaiianNavajoNepaleseNew ZealanderNicaraguanNigerianNorthern EuropeanNorwegianOkinawanOsageOttawaPaiutePakistaniPalestinianPanamanianParaguayanPennsylvania GermanPeruvianPimaPolishPortuguesePotawatomiPuebloPuerto RicanPuget Sound SalishRomanianRussianSalvadoranSamoanScandinavianScotch-IrishScottishSeminoleSenegaleseSerbianShoshoneSierra LeoneanSiouxSlavicSlovakSloveneSomaliSouth AfricanSouth AmericanSouth American IndianSoviet UnionSpaniardSpanishSpanish AmericanSpanish American IndianSri LankanSubsaharan AfricanSudaneseSwedishSwissSyrianTaiwaneseThaiTlingit-HaidaTohono O'OdhamTonganTrinidadian and TobagonianTsimshianTurkishU.S. Virgin IslanderUgandanUkrainianUruguayanUteVenezuelanVietnameseWelshWest IndianYakamaYaquiYugoslavianYumanYup'ikZimbabwean
Immigrant Origin (Total)
AfghanistanAfricaAlbaniaArgentinaArmeniaAsiaAustraliaAustriaAzoresBahamasBangladeshBarbadosBelarusBelgiumBelizeBoliviaBosnia and HerzegovinaBrazilBulgariaBurma / MyanmarCabo VerdeCambodiaCameroonCanadaCaribbeanCentral AmericaChileChinaColombiaCongoCosta RicaCroatiaCubaCzechoslovakiaDenmarkDominicaDominican RepublicEastern AfricaEastern AsiaEastern EuropeEcuadorEgyptEl SalvadorEnglandEritreaEthiopiaEuropeFijiFranceGermanyGhanaGreeceGrenadaGuatemalaGuyanaHaitiHondurasHong KongHungaryIndiaIndonesiaIranIraqIrelandIsraelItalyJamaicaJapanJordanKazakhstanKenyaKoreaKuwaitLaosLatin AmericaLatviaLebanonLiberiaLithuaniaMalaysiaMexicoMicronesiaMiddle AfricaMoldovaMoroccoNepalNetherlandsNicaraguaNigeriaNorth MacedoniaNorthern AfricaNorthern EuropeNorwayOceaniaPakistanPanamaPeruPhilippinesPolandPortugalRomaniaRussiaSaudi ArabiaScotlandSenegalSerbiaSierra LeoneSingaporeSomaliaSouth AfricaSouth AmericaSouth Central AsiaSouth Eastern AsiaSouthern EuropeSpainSri LankaSt. Vincent and the GrenadinesSudanSwedenSwitzerlandSyriaTaiwanThailandTrinidad and TobagoTurkeyUgandaUkraineUruguayUzbekistanVenezuelaVietnamWest IndiesWestern AfricaWestern AsiaWestern EuropeYemenZaireZimbabwe
Immigrant Origin (Percentage)
AfghanistanAfricaAlbaniaArgentinaArmeniaAsiaAustraliaAustriaAzoresBahamasBangladeshBarbadosBelarusBelgiumBelizeBoliviaBosnia and HerzegovinaBrazilBulgariaBurma / MyanmarCabo VerdeCambodiaCameroonCanadaCaribbeanCentral AmericaChileChinaColombiaCongoCosta RicaCroatiaCubaCzechoslovakiaDenmarkDominicaDominican RepublicEastern AfricaEastern AsiaEastern EuropeEcuadorEgyptEl SalvadorEnglandEritreaEthiopiaEuropeFijiFranceGermanyGhanaGreeceGrenadaGuatemalaGuyanaHaitiHondurasHong KongHungaryIndiaIndonesiaIranIraqIrelandIsraelItalyJamaicaJapanJordanKazakhstanKenyaKoreaKuwaitLaosLatin AmericaLatviaLebanonLiberiaLithuaniaMalaysiaMexicoMicronesiaMiddle AfricaMoldovaMoroccoNepalNetherlandsNicaraguaNigeriaNorth MacedoniaNorthern AfricaNorthern EuropeNorwayOceaniaPakistanPanamaPeruPhilippinesPolandPortugalRomaniaRussiaSaudi ArabiaScotlandSenegalSerbiaSierra LeoneSingaporeSomaliaSouth AfricaSouth AmericaSouth Central AsiaSouth Eastern AsiaSouthern EuropeSpainSri LankaSt. Vincent and the GrenadinesSudanSwedenSwitzerlandSyriaTaiwanThailandTrinidad and TobagoTurkeyUgandaUkraineUruguayUzbekistanVenezuelaVietnamWest IndiesWestern AfricaWestern AsiaWestern EuropeYemenZaireZimbabwe
Income
Income (Families)
Income (Households)
Poverty
Poverty (Families)
Unemployment
Employment Occupations
Employment Industries
Employer Class
Commute Time
Commute Means
School Enrollment
Education by Degree Field
Occupancy
Finances
Physical Characteristics
Massachusetts
Compare Cities
Comparison Subject

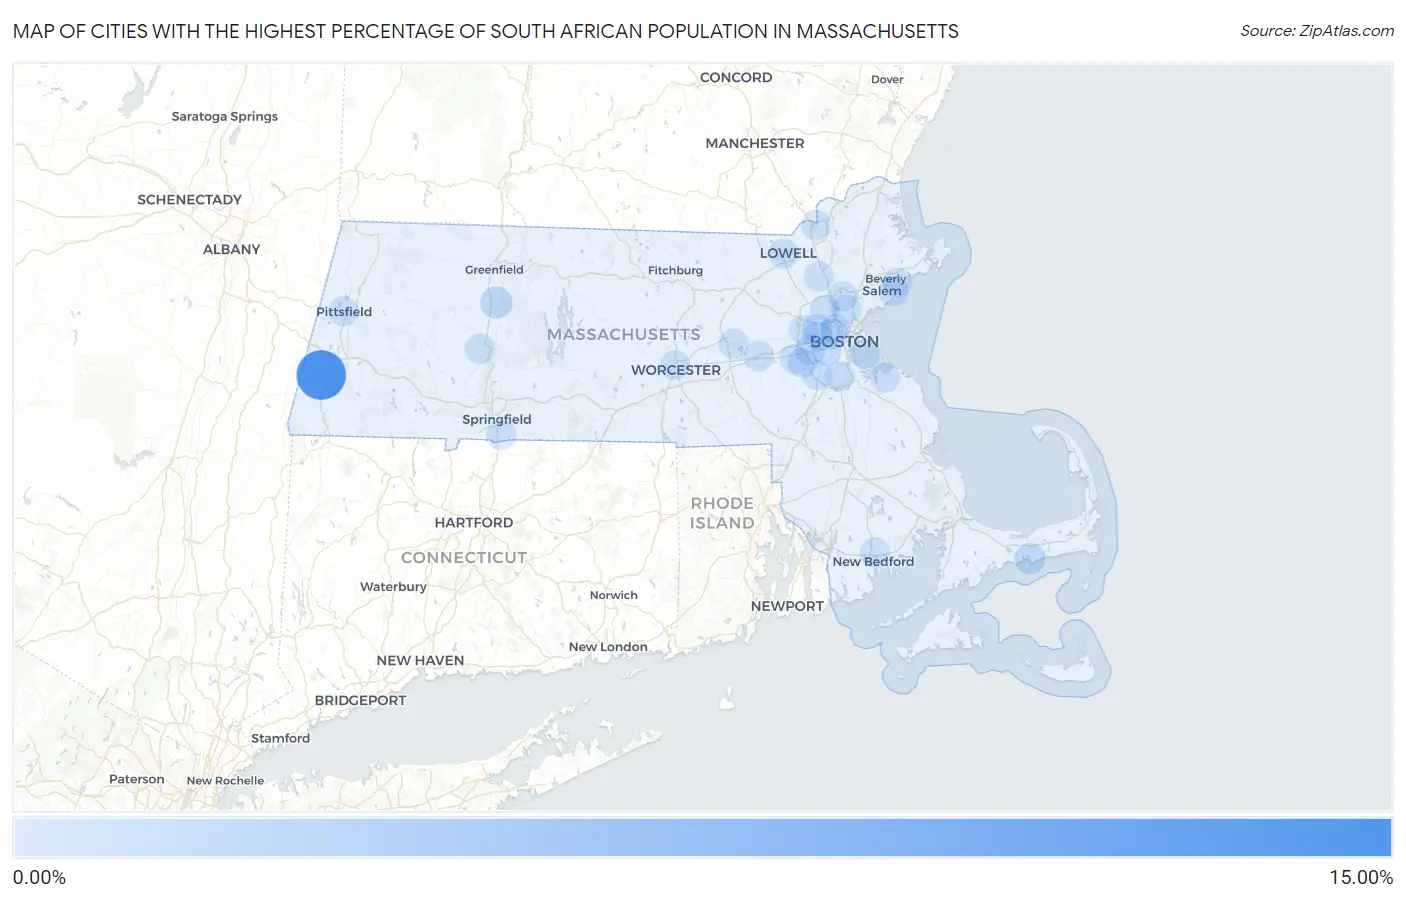
Map of Cities with the Highest Percentage of South African Population in Massachusetts

0.00%
15.00%
Cities with the Highest Percentage of South African Population in Massachusetts Map

Cities with the Highest Percentage of South African Population in Massachusetts

City South African vs State vs National
1.Housatonic12.18%0.029%(+12.2)#10.024%(+12.2)#2
2.South Deerfield1.23%0.029%(+1.20)#20.024%(+1.20)#85
3.West Yarmouth0.77%0.029%(+0.742)#30.024%(+0.747)#138
4.Hingham0.20%0.029%(+0.167)#40.024%(+0.172)#460
5.Dedham0.19%0.029%(+0.166)#50.024%(+0.171)#464
6.Wellesley0.19%0.029%(+0.159)#60.024%(+0.164)#473
7.Newton0.13%0.029%(+0.106)#70.024%(+0.111)#583
8.Melrose0.13%0.029%(+0.104)#80.024%(+0.108)#588
9.Needham0.13%0.029%(+0.103)#90.024%(+0.107)#591
10.Greenfield0.10%0.029%(+0.073)#100.024%(+0.078)#659
11.Wilmington0.099%0.029%(+0.070)#110.024%(+0.075)#667
12.Marlborough0.097%0.029%(+0.068)#120.024%(+0.073)#673
13.Longmeadow0.095%0.029%(+0.066)#130.024%(+0.071)#677
14.Beverly0.094%0.029%(+0.066)#140.024%(+0.070)#681
15.Salem0.094%0.029%(+0.066)#150.024%(+0.070)#682
16.Cambridge0.085%0.029%(+0.056)#160.024%(+0.061)#727
17.Northampton0.081%0.029%(+0.053)#170.024%(+0.057)#743
18.Milton0.070%0.029%(+0.042)#180.024%(+0.046)#793
19.Brookline0.054%0.029%(+0.025)#190.024%(+0.030)#890
20.Wakefield0.052%0.029%(+0.023)#200.024%(+0.028)#902
21.Framingham0.052%0.029%(+0.023)#210.024%(+0.028)#905
22.Boston0.045%0.029%(+0.017)#220.024%(+0.022)#951
23.Winchester0.039%0.029%(+0.011)#230.024%(+0.015)#995
24.Pittsfield0.037%0.029%(+0.008)#240.024%(+0.013)#1,025
25.Belmont0.033%0.029%(+0.005)#250.024%(+0.009)#1,048
26.New Bedford0.029%0.029%(+0.000)#260.024%(+0.005)#1,088
27.Worcester0.028%0.029%(-0.001)#270.024%(+0.004)#1,096
28.Watertown Town0.026%0.029%(-0.003)#280.024%(+0.002)#1,116
29.Somerville0.025%0.029%(-0.004)#290.024%(+0.001)#1,125
30.Methuen Town0.015%0.029%(-0.014)#300.024%(-0.009)#1,246
31.Lowell0.011%0.029%(-0.017)#310.024%(-0.013)#1,301
32.Waltham0.0062%0.029%(-0.023)#320.024%(-0.018)#1,356

Common Questions

What are the Top 10 Cities with the Highest Percentage of South African Population in Massachusetts?
Top 10 Cities with the Highest Percentage of South African Population in Massachusetts are:
#1
12.18%
#2
1.23%
#3
0.77%
#4
0.20%
#5
0.19%
#6
0.19%
#7
0.13%
#8
0.13%
#9
0.13%
#10
0.099%
What city has the Highest Percentage of South African Population in Massachusetts?
Housatonic has the Highest Percentage of South African Population in Massachusetts with 12.18%.
What is the Percentage of South African Population in the State of Massachusetts?
Percentage of South African Population in Massachusetts is 0.029%.
What is the Percentage of South African Population in the United States?
Percentage of South African Population in the United States is 0.024%.