Cities with the Highest Percentage of Pakistani Population in New York
RELATED REPORTS & OPTIONS
Pakistani
New York
Compare Cities
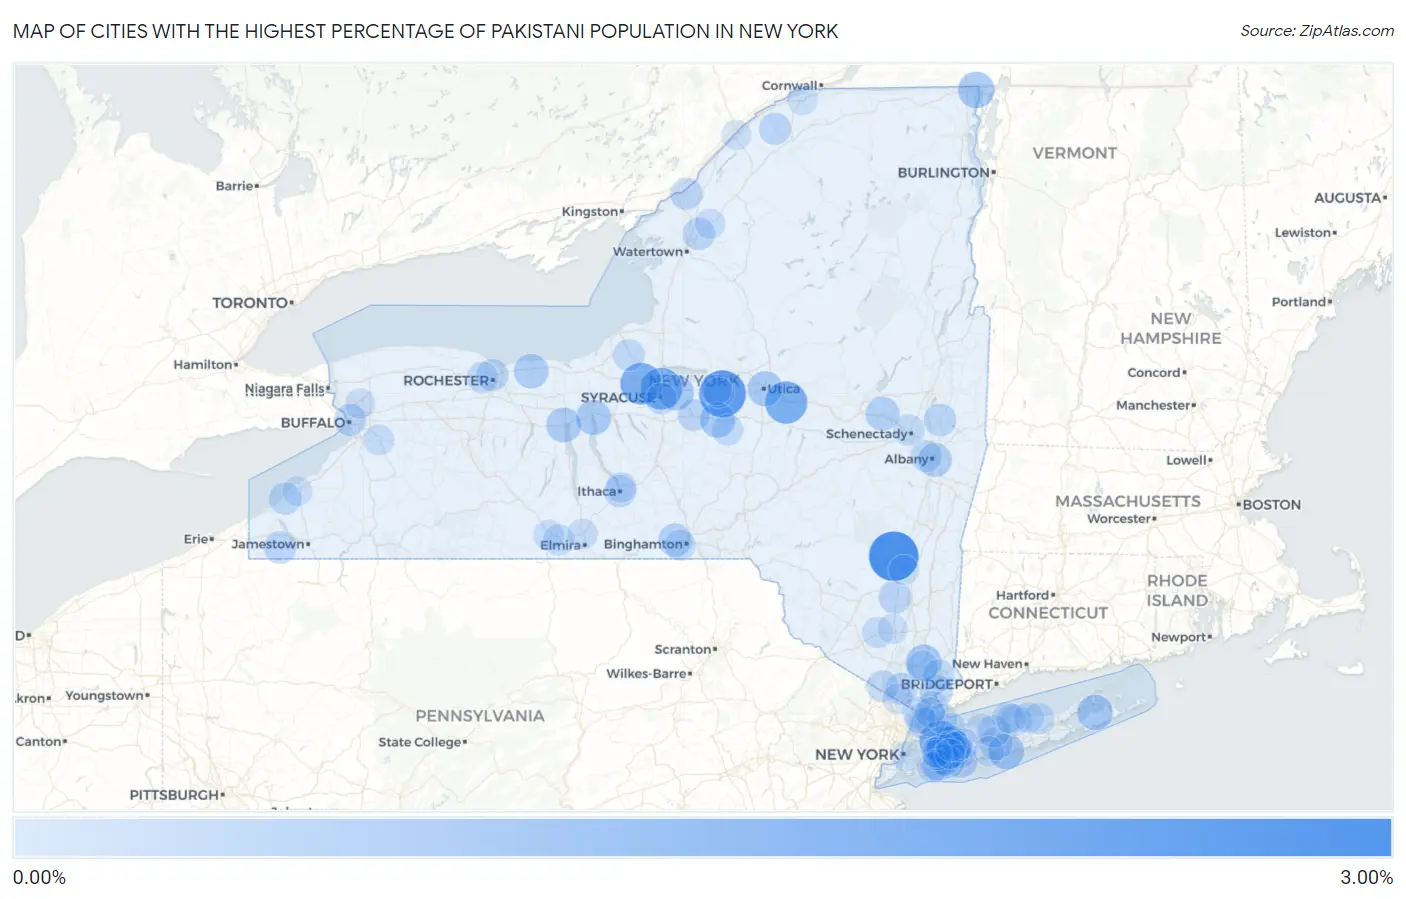
Map of Cities with the Highest Percentage of Pakistani Population in New York
0.00%
3.00%
Cities with the Highest Percentage of Pakistani Population in New York
| City | Pakistani | vs State | vs National | |
| 1. | Zena | 2.89% | 0.086%(+2.81)#1 | 0.097%(+2.80)#55 |
| 2. | Sherrill | 2.49% | 0.086%(+2.40)#2 | 0.097%(+2.39)#71 |
| 3. | Carle Place | 1.84% | 0.086%(+1.76)#3 | 0.097%(+1.74)#116 |
| 4. | Ilion | 1.80% | 0.086%(+1.72)#4 | 0.097%(+1.71)#119 |
| 5. | Mattydale | 1.75% | 0.086%(+1.67)#5 | 0.097%(+1.65)#125 |
| 6. | Village Green | 1.73% | 0.086%(+1.65)#6 | 0.097%(+1.64)#129 |
| 7. | Munsey Park | 1.65% | 0.086%(+1.56)#7 | 0.097%(+1.55)#137 |
| 8. | Varna | 1.29% | 0.086%(+1.20)#8 | 0.097%(+1.19)#210 |
| 9. | Gananda | 1.12% | 0.086%(+1.03)#9 | 0.097%(+1.02)#261 |
| 10. | Unadilla Forks | 1.01% | 0.086%(+0.919)#10 | 0.097%(+0.908)#303 |
| 11. | Rouses Point | 0.95% | 0.086%(+0.863)#11 | 0.097%(+0.852)#324 |
| 12. | West Sayville | 0.87% | 0.086%(+0.788)#12 | 0.097%(+0.777)#359 |
| 13. | Shrub Oak | 0.87% | 0.086%(+0.780)#13 | 0.097%(+0.769)#364 |
| 14. | Minoa | 0.85% | 0.086%(+0.763)#14 | 0.097%(+0.752)#374 |
| 15. | Noyack | 0.83% | 0.086%(+0.748)#15 | 0.097%(+0.737)#379 |
| 16. | Morrisville | 0.79% | 0.086%(+0.700)#16 | 0.097%(+0.689)#414 |
| 17. | Utica | 0.79% | 0.086%(+0.700)#17 | 0.097%(+0.689)#415 |
| 18. | Cayuga | 0.78% | 0.086%(+0.689)#18 | 0.097%(+0.678)#419 |
| 19. | Geneva | 0.75% | 0.086%(+0.664)#19 | 0.097%(+0.653)#436 |
| 20. | Roessleville | 0.74% | 0.086%(+0.656)#20 | 0.097%(+0.645)#443 |
| 21. | Ontario | 0.71% | 0.086%(+0.621)#21 | 0.097%(+0.610)#470 |
| 22. | Old Westbury | 0.61% | 0.086%(+0.526)#22 | 0.097%(+0.515)#543 |
| 23. | Amsterdam | 0.61% | 0.086%(+0.522)#23 | 0.097%(+0.511)#546 |
| 24. | Rensselaer | 0.59% | 0.086%(+0.508)#24 | 0.097%(+0.497)#564 |
| 25. | Armonk | 0.55% | 0.086%(+0.462)#25 | 0.097%(+0.451)#626 |
| 26. | Endwell | 0.54% | 0.086%(+0.455)#26 | 0.097%(+0.444)#636 |
| 27. | Greenville Cdp Westchester County | 0.53% | 0.086%(+0.446)#27 | 0.097%(+0.435)#650 |
| 28. | Central Islip | 0.47% | 0.086%(+0.382)#28 | 0.097%(+0.371)#759 |
| 29. | Seaford | 0.44% | 0.086%(+0.356)#29 | 0.097%(+0.345)#801 |
| 30. | Smithtown | 0.43% | 0.086%(+0.348)#30 | 0.097%(+0.337)#818 |
| 31. | Mechanicville | 0.42% | 0.086%(+0.339)#31 | 0.097%(+0.328)#839 |
| 32. | New Paltz | 0.41% | 0.086%(+0.328)#32 | 0.097%(+0.317)#864 |
| 33. | Panama | 0.41% | 0.086%(+0.327)#33 | 0.097%(+0.316)#867 |
| 34. | Evans Mills | 0.40% | 0.086%(+0.312)#34 | 0.097%(+0.301)#901 |
| 35. | Brocton | 0.38% | 0.086%(+0.295)#35 | 0.097%(+0.284)#936 |
| 36. | Rochester | 0.37% | 0.086%(+0.282)#36 | 0.097%(+0.271)#972 |
| 37. | New Square | 0.37% | 0.086%(+0.279)#37 | 0.097%(+0.268)#978 |
| 38. | Madrid | 0.36% | 0.086%(+0.279)#38 | 0.097%(+0.268)#980 |
| 39. | Cazenovia | 0.36% | 0.086%(+0.276)#39 | 0.097%(+0.265)#986 |
| 40. | Ithaca | 0.36% | 0.086%(+0.271)#40 | 0.097%(+0.260)#1,001 |
| 41. | Buffalo | 0.35% | 0.086%(+0.268)#41 | 0.097%(+0.257)#1,008 |
| 42. | Alexandria Bay | 0.35% | 0.086%(+0.268)#42 | 0.097%(+0.257)#1,009 |
| 43. | Lakeview | 0.34% | 0.086%(+0.251)#43 | 0.097%(+0.240)#1,049 |
| 44. | Garden City Park | 0.33% | 0.086%(+0.248)#44 | 0.097%(+0.237)#1,059 |
| 45. | Manhasset Hills | 0.33% | 0.086%(+0.247)#45 | 0.097%(+0.236)#1,066 |
| 46. | Sloatsburg | 0.33% | 0.086%(+0.243)#46 | 0.097%(+0.232)#1,075 |
| 47. | Albany | 0.30% | 0.086%(+0.216)#47 | 0.097%(+0.205)#1,149 |
| 48. | Levittown | 0.30% | 0.086%(+0.215)#48 | 0.097%(+0.204)#1,152 |
| 49. | Fulton | 0.30% | 0.086%(+0.213)#49 | 0.097%(+0.202)#1,160 |
| 50. | Hewlett | 0.29% | 0.086%(+0.204)#50 | 0.097%(+0.193)#1,185 |
| 51. | North Gates | 0.29% | 0.086%(+0.200)#51 | 0.097%(+0.189)#1,194 |
| 52. | Baldwin | 0.27% | 0.086%(+0.180)#52 | 0.097%(+0.169)#1,272 |
| 53. | Scotia | 0.26% | 0.086%(+0.175)#53 | 0.097%(+0.164)#1,295 |
| 54. | Bedford Hills | 0.26% | 0.086%(+0.174)#54 | 0.097%(+0.163)#1,298 |
| 55. | Hastings On Hudson | 0.26% | 0.086%(+0.174)#55 | 0.097%(+0.163)#1,300 |
| 56. | Hamilton | 0.26% | 0.086%(+0.172)#56 | 0.097%(+0.161)#1,310 |
| 57. | Syracuse | 0.25% | 0.086%(+0.169)#57 | 0.097%(+0.158)#1,324 |
| 58. | Locust Valley | 0.25% | 0.086%(+0.163)#58 | 0.097%(+0.152)#1,345 |
| 59. | Wading River | 0.25% | 0.086%(+0.161)#59 | 0.097%(+0.150)#1,354 |
| 60. | Montgomery | 0.24% | 0.086%(+0.151)#60 | 0.097%(+0.140)#1,392 |
| 61. | Mount Vernon | 0.24% | 0.086%(+0.150)#61 | 0.097%(+0.139)#1,397 |
| 62. | Binghamton University | 0.23% | 0.086%(+0.148)#62 | 0.097%(+0.137)#1,408 |
| 63. | Mount Sinai | 0.23% | 0.086%(+0.146)#63 | 0.097%(+0.135)#1,424 |
| 64. | Crompond | 0.23% | 0.086%(+0.140)#64 | 0.097%(+0.129)#1,448 |
| 65. | Rockville Centre | 0.22% | 0.086%(+0.139)#65 | 0.097%(+0.128)#1,454 |
| 66. | Woodmere | 0.22% | 0.086%(+0.130)#66 | 0.097%(+0.119)#1,502 |
| 67. | South Corning | 0.21% | 0.086%(+0.121)#67 | 0.097%(+0.110)#1,556 |
| 68. | White Plains | 0.19% | 0.086%(+0.104)#68 | 0.097%(+0.093)#1,664 |
| 69. | East Aurora | 0.18% | 0.086%(+0.097)#69 | 0.097%(+0.086)#1,702 |
| 70. | Poquott | 0.18% | 0.086%(+0.095)#70 | 0.097%(+0.084)#1,716 |
| 71. | Gang Mills | 0.18% | 0.086%(+0.089)#71 | 0.097%(+0.078)#1,749 |
| 72. | Cayuga Heights | 0.17% | 0.086%(+0.087)#72 | 0.097%(+0.076)#1,763 |
| 73. | New Rochelle | 0.17% | 0.086%(+0.085)#73 | 0.097%(+0.074)#1,776 |
| 74. | Shoreham | 0.17% | 0.086%(+0.083)#74 | 0.097%(+0.072)#1,785 |
| 75. | Horseheads | 0.15% | 0.086%(+0.067)#75 | 0.097%(+0.056)#1,890 |
| 76. | Yonkers | 0.15% | 0.086%(+0.059)#76 | 0.097%(+0.048)#1,938 |
| 77. | Oneida Castle | 0.14% | 0.086%(+0.057)#77 | 0.097%(+0.046)#1,952 |
| 78. | East Northport | 0.14% | 0.086%(+0.052)#78 | 0.097%(+0.041)#1,996 |
| 79. | Inwood | 0.13% | 0.086%(+0.048)#79 | 0.097%(+0.037)#2,028 |
| 80. | University At Buffalo | 0.13% | 0.086%(+0.043)#80 | 0.097%(+0.032)#2,065 |
| 81. | Plainview | 0.13% | 0.086%(+0.042)#81 | 0.097%(+0.031)#2,075 |
| 82. | Chestnut Ridge | 0.13% | 0.086%(+0.040)#82 | 0.097%(+0.029)#2,090 |
| 83. | Oneida | 0.12% | 0.086%(+0.030)#83 | 0.097%(+0.019)#2,172 |
| 84. | Philadelphia | 0.11% | 0.086%(+0.023)#84 | 0.097%(+0.012)#2,242 |
| 85. | Hicksville | 0.10% | 0.086%(+0.018)#85 | 0.097%(+0.007)#2,280 |
| 86. | New York | 0.10% | 0.086%(+0.017)#86 | 0.097%(+0.006)#2,290 |
| 87. | Rochester Institute Of Technology | 0.10% | 0.086%(+0.016)#87 | 0.097%(+0.005)#2,307 |
| 88. | Ogdensburg | 0.10% | 0.086%(+0.015)#88 | 0.097%(+0.004)#2,317 |
| 89. | Elmont | 0.10% | 0.086%(+0.014)#89 | 0.097%(+0.003)#2,327 |
| 90. | Bellerose | 0.10% | 0.086%(+0.014)#90 | 0.097%(+0.003)#2,329 |
| 91. | Massena | 0.098% | 0.086%(+0.012)#91 | 0.097%(+0.001)#2,344 |
| 92. | Westbury | 0.095% | 0.086%(+0.009)#92 | 0.097%(-0.002)#2,366 |
| 93. | Kingston | 0.092% | 0.086%(+0.006)#93 | 0.097%(-0.005)#2,393 |
| 94. | Port Jefferson | 0.088% | 0.086%(+0.002)#94 | 0.097%(-0.009)#2,432 |
| 95. | Rye | 0.085% | 0.086%(-0.001)#95 | 0.097%(-0.012)#2,451 |
| 96. | Bay Shore | 0.085% | 0.086%(-0.001)#96 | 0.097%(-0.012)#2,452 |
| 97. | Uniondale | 0.084% | 0.086%(-0.002)#97 | 0.097%(-0.013)#2,463 |
| 98. | Scarsdale | 0.083% | 0.086%(-0.003)#98 | 0.097%(-0.014)#2,480 |
| 99. | Fredonia | 0.082% | 0.086%(-0.004)#99 | 0.097%(-0.015)#2,490 |
| 100. | Orange Lake | 0.080% | 0.086%(-0.006)#100 | 0.097%(-0.017)#2,518 |
Common Questions
What are the Top 10 Cities with the Highest Percentage of Pakistani Population in New York?
Top 10 Cities with the Highest Percentage of Pakistani Population in New York are:
#1
2.89%
#2
2.49%
#3
1.84%
#4
1.80%
#5
1.75%
#6
1.73%
#7
1.65%
#8
0.95%
#9
0.87%
#10
0.87%
What city has the Highest Percentage of Pakistani Population in New York?
Zena has the Highest Percentage of Pakistani Population in New York with 2.89%.
What is the Percentage of Pakistani Population in the State of New York?
Percentage of Pakistani Population in New York is 0.086%.
What is the Percentage of Pakistani Population in the United States?
Percentage of Pakistani Population in the United States is 0.097%.