Cities with the Highest Percentage of Pakistani Population in Virginia
RELATED REPORTS & OPTIONS
Pakistani
Virginia
Compare Cities
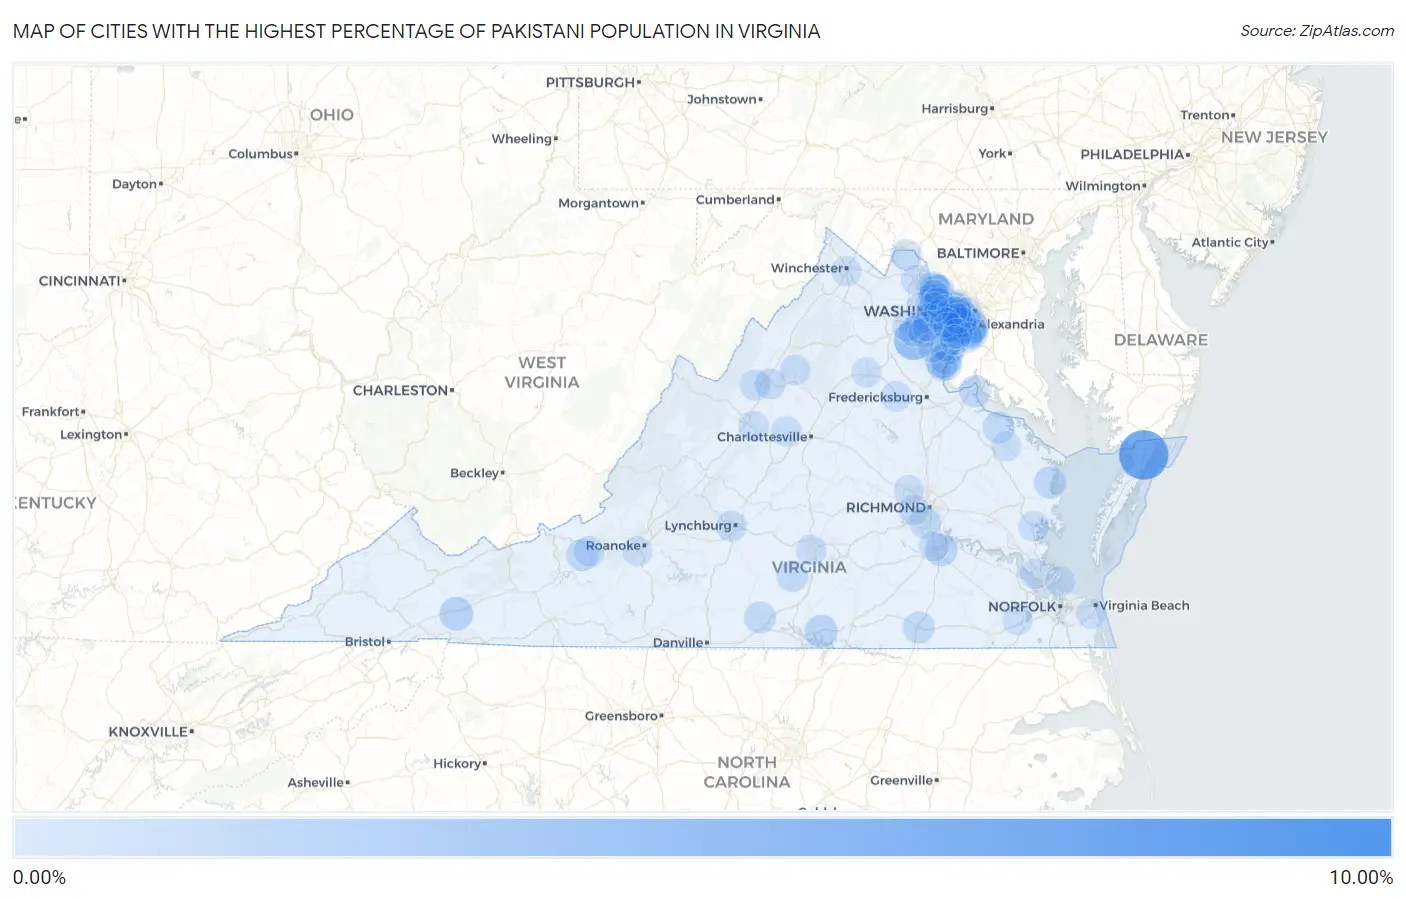
Map of Cities with the Highest Percentage of Pakistani Population in Virginia
0.00%
10.00%
Cities with the Highest Percentage of Pakistani Population in Virginia
| City | Pakistani | vs State | vs National | |
| 1. | Goose Creek | 9.35% | 0.15%(+9.20)#1 | 0.097%(+9.25)#4 |
| 2. | Temperanceville | 6.87% | 0.15%(+6.72)#2 | 0.097%(+6.77)#10 |
| 3. | Nokesville | 3.51% | 0.15%(+3.36)#3 | 0.097%(+3.42)#41 |
| 4. | Triangle | 1.56% | 0.15%(+1.41)#4 | 0.097%(+1.46)#158 |
| 5. | Fair Lakes | 1.50% | 0.15%(+1.35)#5 | 0.097%(+1.41)#166 |
| 6. | Huntington | 1.50% | 0.15%(+1.34)#6 | 0.097%(+1.40)#167 |
| 7. | Kings Park | 1.35% | 0.15%(+1.20)#7 | 0.097%(+1.25)#198 |
| 8. | Adwolf | 1.32% | 0.15%(+1.17)#8 | 0.097%(+1.23)#200 |
| 9. | Groveton | 1.09% | 0.15%(+0.941)#9 | 0.097%(+0.997)#268 |
| 10. | Boydton | 1.08% | 0.15%(+0.922)#10 | 0.097%(+0.978)#274 |
| 11. | Mcnair | 1.01% | 0.15%(+0.857)#11 | 0.097%(+0.913)#302 |
| 12. | Fort Lee | 1.00% | 0.15%(+0.850)#12 | 0.097%(+0.906)#306 |
| 13. | Herndon | 0.90% | 0.15%(+0.742)#13 | 0.097%(+0.798)#344 |
| 14. | Franconia | 0.89% | 0.15%(+0.735)#14 | 0.097%(+0.791)#347 |
| 15. | Sugarland Run | 0.87% | 0.15%(+0.713)#15 | 0.097%(+0.769)#365 |
| 16. | Kilmarnock | 0.86% | 0.15%(+0.704)#16 | 0.097%(+0.760)#370 |
| 17. | Dahlgren Center | 0.83% | 0.15%(+0.677)#17 | 0.097%(+0.733)#383 |
| 18. | Montross | 0.82% | 0.15%(+0.662)#18 | 0.097%(+0.718)#392 |
| 19. | Prices Fork | 0.79% | 0.15%(+0.636)#19 | 0.097%(+0.692)#411 |
| 20. | Emporia | 0.77% | 0.15%(+0.622)#20 | 0.097%(+0.678)#420 |
| 21. | Cherry Hill | 0.76% | 0.15%(+0.611)#21 | 0.097%(+0.667)#427 |
| 22. | Halifax | 0.76% | 0.15%(+0.605)#22 | 0.097%(+0.661)#430 |
| 23. | Springfield | 0.73% | 0.15%(+0.582)#23 | 0.097%(+0.638)#447 |
| 24. | Pimmit Hills | 0.71% | 0.15%(+0.555)#24 | 0.097%(+0.611)#469 |
| 25. | Countryside | 0.69% | 0.15%(+0.542)#25 | 0.097%(+0.598)#473 |
| 26. | Meadowbrook | 0.69% | 0.15%(+0.540)#26 | 0.097%(+0.596)#475 |
| 27. | Belle Haven | 0.60% | 0.15%(+0.445)#27 | 0.097%(+0.501)#560 |
| 28. | Charlotte Court House | 0.57% | 0.15%(+0.422)#28 | 0.097%(+0.478)#589 |
| 29. | Tysons | 0.57% | 0.15%(+0.419)#29 | 0.097%(+0.475)#592 |
| 30. | West Falls Church | 0.56% | 0.15%(+0.406)#30 | 0.097%(+0.462)#606 |
| 31. | Burke Centre | 0.54% | 0.15%(+0.388)#31 | 0.097%(+0.444)#637 |
| 32. | Rose Hill Cdp Fairfax County | 0.52% | 0.15%(+0.371)#32 | 0.097%(+0.427)#668 |
| 33. | Woodbridge | 0.48% | 0.15%(+0.330)#33 | 0.097%(+0.386)#736 |
| 34. | Bull Run | 0.47% | 0.15%(+0.316)#34 | 0.097%(+0.372)#756 |
| 35. | South Run | 0.46% | 0.15%(+0.308)#35 | 0.097%(+0.364)#770 |
| 36. | Lovettsville | 0.45% | 0.15%(+0.297)#36 | 0.097%(+0.353)#786 |
| 37. | Bridgewater | 0.44% | 0.15%(+0.288)#37 | 0.097%(+0.344)#802 |
| 38. | Mclean | 0.42% | 0.15%(+0.266)#38 | 0.097%(+0.322)#847 |
| 39. | Massanetta Springs | 0.42% | 0.15%(+0.263)#39 | 0.097%(+0.319)#860 |
| 40. | Lowes Island | 0.41% | 0.15%(+0.255)#40 | 0.097%(+0.311)#880 |
| 41. | Midlothian | 0.41% | 0.15%(+0.255)#41 | 0.097%(+0.311)#881 |
| 42. | Cascades | 0.41% | 0.15%(+0.254)#42 | 0.097%(+0.310)#885 |
| 43. | West Springfield | 0.39% | 0.15%(+0.236)#43 | 0.097%(+0.292)#919 |
| 44. | Hutchison | 0.39% | 0.15%(+0.236)#44 | 0.097%(+0.292)#920 |
| 45. | Lynchburg | 0.38% | 0.15%(+0.230)#45 | 0.097%(+0.286)#932 |
| 46. | Fort Hunt | 0.37% | 0.15%(+0.222)#46 | 0.097%(+0.278)#949 |
| 47. | Quantico | 0.37% | 0.15%(+0.215)#47 | 0.097%(+0.271)#969 |
| 48. | Falls Church | 0.36% | 0.15%(+0.204)#48 | 0.097%(+0.260)#1,002 |
| 49. | Lake Wilderness | 0.35% | 0.15%(+0.199)#49 | 0.097%(+0.255)#1,012 |
| 50. | Gloucester Courthouse | 0.34% | 0.15%(+0.189)#50 | 0.097%(+0.245)#1,037 |
| 51. | Fishersville | 0.34% | 0.15%(+0.187)#51 | 0.097%(+0.243)#1,043 |
| 52. | Bailey S Crossroads | 0.33% | 0.15%(+0.178)#52 | 0.097%(+0.234)#1,068 |
| 53. | Fairfax | 0.33% | 0.15%(+0.173)#53 | 0.097%(+0.229)#1,084 |
| 54. | Centreville | 0.32% | 0.15%(+0.163)#54 | 0.097%(+0.219)#1,106 |
| 55. | Blacksburg | 0.31% | 0.15%(+0.162)#55 | 0.097%(+0.218)#1,114 |
| 56. | Gainesville | 0.31% | 0.15%(+0.159)#56 | 0.097%(+0.215)#1,120 |
| 57. | Hybla Valley | 0.30% | 0.15%(+0.145)#57 | 0.097%(+0.201)#1,162 |
| 58. | Merrifield | 0.30% | 0.15%(+0.143)#58 | 0.097%(+0.199)#1,168 |
| 59. | Leesburg | 0.29% | 0.15%(+0.138)#59 | 0.097%(+0.194)#1,178 |
| 60. | Crozet | 0.28% | 0.15%(+0.128)#60 | 0.097%(+0.184)#1,210 |
| 61. | South Riding | 0.27% | 0.15%(+0.120)#61 | 0.097%(+0.176)#1,243 |
| 62. | Newport News | 0.27% | 0.15%(+0.118)#62 | 0.097%(+0.174)#1,258 |
| 63. | Newington Forest | 0.27% | 0.15%(+0.116)#63 | 0.097%(+0.172)#1,265 |
| 64. | Camp Barrett | 0.27% | 0.15%(+0.113)#64 | 0.097%(+0.169)#1,275 |
| 65. | Shenandoah | 0.26% | 0.15%(+0.112)#65 | 0.097%(+0.168)#1,278 |
| 66. | Hampden Sydney | 0.26% | 0.15%(+0.105)#66 | 0.097%(+0.161)#1,306 |
| 67. | Arlington | 0.26% | 0.15%(+0.102)#67 | 0.097%(+0.158)#1,322 |
| 68. | Lincolnia | 0.25% | 0.15%(+0.094)#68 | 0.097%(+0.150)#1,351 |
| 69. | Linton Hall | 0.23% | 0.15%(+0.081)#69 | 0.097%(+0.137)#1,409 |
| 70. | Reston | 0.23% | 0.15%(+0.075)#70 | 0.097%(+0.131)#1,440 |
| 71. | Fair Oaks | 0.23% | 0.15%(+0.075)#71 | 0.097%(+0.131)#1,441 |
| 72. | Oakton | 0.23% | 0.15%(+0.074)#72 | 0.097%(+0.130)#1,442 |
| 73. | Idylwood | 0.22% | 0.15%(+0.072)#73 | 0.097%(+0.128)#1,455 |
| 74. | Manassas | 0.22% | 0.15%(+0.070)#74 | 0.097%(+0.126)#1,463 |
| 75. | Mount Vernon | 0.22% | 0.15%(+0.065)#75 | 0.097%(+0.121)#1,492 |
| 76. | Winchester | 0.21% | 0.15%(+0.060)#76 | 0.097%(+0.117)#1,516 |
| 77. | Annandale | 0.21% | 0.15%(+0.060)#77 | 0.097%(+0.116)#1,522 |
| 78. | Virginia Beach | 0.21% | 0.15%(+0.059)#78 | 0.097%(+0.115)#1,528 |
| 79. | Dunn Loring | 0.21% | 0.15%(+0.054)#79 | 0.097%(+0.110)#1,560 |
| 80. | Potomac Mills | 0.20% | 0.15%(+0.047)#80 | 0.097%(+0.103)#1,594 |
| 81. | Sterling | 0.19% | 0.15%(+0.040)#81 | 0.097%(+0.096)#1,642 |
| 82. | Quantico Base | 0.19% | 0.15%(+0.033)#82 | 0.097%(+0.089)#1,685 |
| 83. | Woodlawn Cdp Fairfax County | 0.18% | 0.15%(+0.030)#83 | 0.097%(+0.086)#1,705 |
| 84. | Moorefield | 0.18% | 0.15%(+0.029)#84 | 0.097%(+0.085)#1,708 |
| 85. | Independent Hill | 0.17% | 0.15%(+0.019)#85 | 0.097%(+0.075)#1,768 |
| 86. | Leesylvania | 0.17% | 0.15%(+0.019)#86 | 0.097%(+0.075)#1,770 |
| 87. | Warsaw | 0.17% | 0.15%(+0.019)#87 | 0.097%(+0.075)#1,771 |
| 88. | Yorkshire | 0.17% | 0.15%(+0.017)#88 | 0.097%(+0.073)#1,780 |
| 89. | Kings Park West | 0.17% | 0.15%(+0.013)#89 | 0.097%(+0.069)#1,802 |
| 90. | Burke | 0.16% | 0.15%(+0.010)#90 | 0.097%(+0.066)#1,819 |
| 91. | Suffolk | 0.16% | 0.15%(+0.009)#91 | 0.097%(+0.065)#1,824 |
| 92. | Short Pump | 0.16% | 0.15%(+0.009)#92 | 0.097%(+0.065)#1,829 |
| 93. | Hampton | 0.16% | 0.15%(+0.009)#93 | 0.097%(+0.065)#1,831 |
| 94. | Culpeper | 0.16% | 0.15%(+0.006)#94 | 0.097%(+0.062)#1,850 |
| 95. | Franklin Farm | 0.16% | 0.15%(+0.006)#95 | 0.097%(+0.062)#1,853 |
| 96. | Bon Air | 0.15% | 0.15%(+0.002)#96 | 0.097%(+0.058)#1,879 |
| 97. | Lorton | 0.15% | 0.15%(+0.001)#97 | 0.097%(+0.057)#1,884 |
| 98. | Cave Spring | 0.15% | 0.15%(+0.001)#98 | 0.097%(+0.057)#1,886 |
| 99. | Colonial Heights | 0.15% | 0.15%(-0.004)#99 | 0.097%(+0.052)#1,921 |
| 100. | Newington | 0.15% | 0.15%(-0.006)#100 | 0.097%(+0.051)#1,927 |
Common Questions
What are the Top 10 Cities with the Highest Percentage of Pakistani Population in Virginia?
Top 10 Cities with the Highest Percentage of Pakistani Population in Virginia are:
#1
6.87%
#2
3.51%
#3
1.56%
#4
1.50%
#5
1.50%
#6
1.35%
#7
1.32%
#8
1.09%
#9
1.08%
#10
1.01%
What city has the Highest Percentage of Pakistani Population in Virginia?
Temperanceville has the Highest Percentage of Pakistani Population in Virginia with 6.87%.
What is the Percentage of Pakistani Population in the State of Virginia?
Percentage of Pakistani Population in Virginia is 0.15%.
What is the Percentage of Pakistani Population in the United States?
Percentage of Pakistani Population in the United States is 0.097%.