Cities with the Highest Percentage of Pakistani Population in Michigan
RELATED REPORTS & OPTIONS
Pakistani
Michigan
Compare Cities
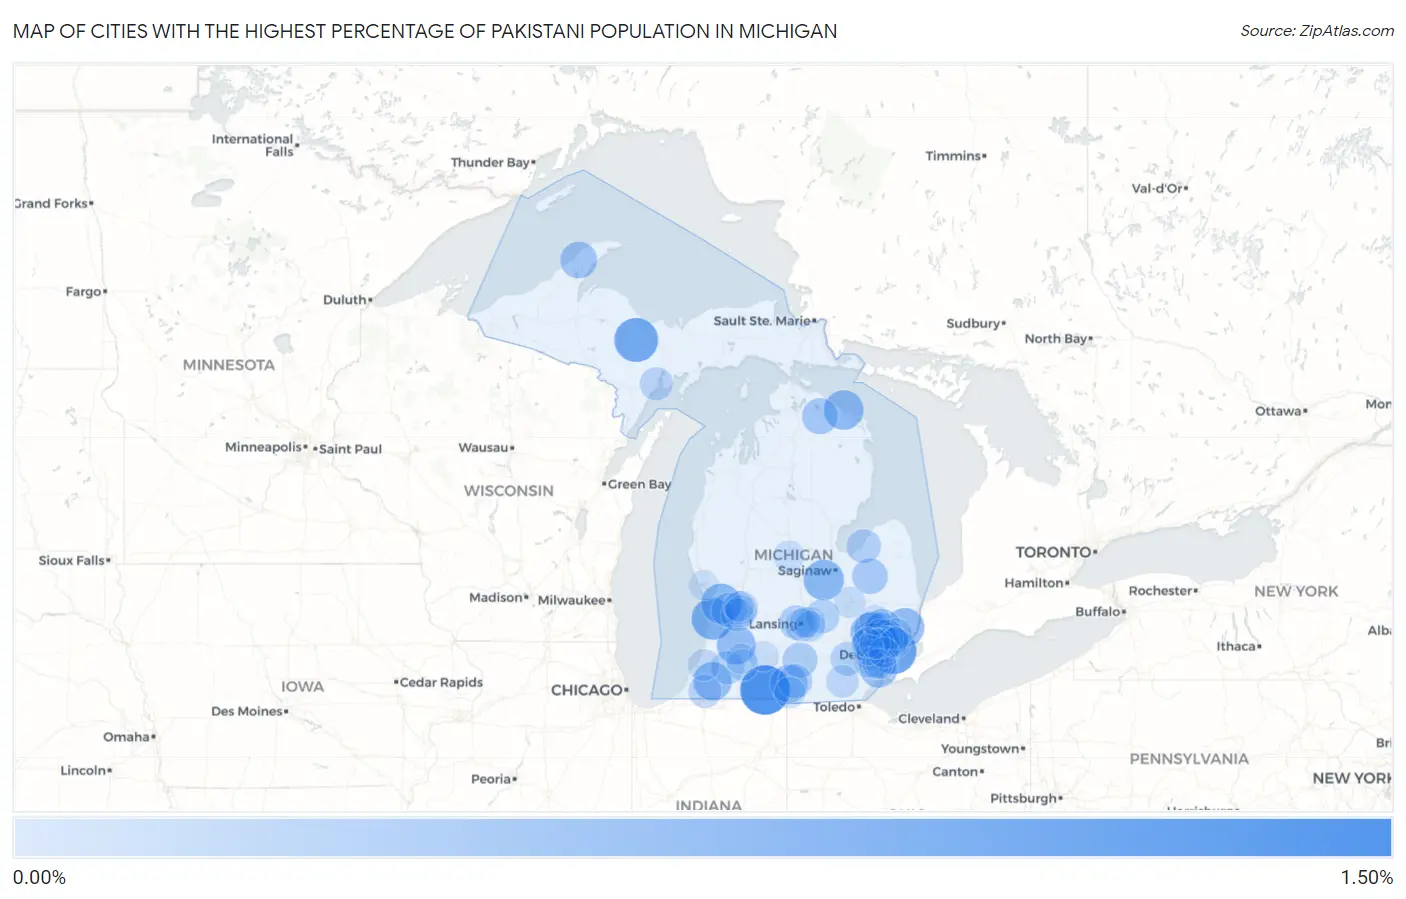
Map of Cities with the Highest Percentage of Pakistani Population in Michigan
0.00%
1.50%
Cities with the Highest Percentage of Pakistani Population in Michigan
| City | Pakistani | vs State | vs National | |
| 1. | Bronson | 1.26% | 0.050%(+1.20)#1 | 0.097%(+1.16)#220 |
| 2. | Grosse Pointe Park | 0.99% | 0.050%(+0.940)#2 | 0.097%(+0.893)#310 |
| 3. | Gwinn | 0.88% | 0.050%(+0.826)#3 | 0.097%(+0.779)#358 |
| 4. | Beechwood | 0.75% | 0.050%(+0.699)#4 | 0.097%(+0.652)#438 |
| 5. | St Charles | 0.64% | 0.050%(+0.594)#5 | 0.097%(+0.547)#512 |
| 6. | Allendale | 0.64% | 0.050%(+0.593)#6 | 0.097%(+0.546)#513 |
| 7. | Pleasant Ridge | 0.61% | 0.050%(+0.563)#7 | 0.097%(+0.516)#542 |
| 8. | Rogers City | 0.59% | 0.050%(+0.543)#8 | 0.097%(+0.496)#568 |
| 9. | Sylvan Lake | 0.58% | 0.050%(+0.528)#9 | 0.097%(+0.481)#583 |
| 10. | New Baltimore | 0.55% | 0.050%(+0.503)#10 | 0.097%(+0.457)#617 |
| 11. | Otsego | 0.54% | 0.050%(+0.489)#11 | 0.097%(+0.442)#641 |
| 12. | Dowagiac | 0.53% | 0.050%(+0.478)#12 | 0.097%(+0.431)#659 |
| 13. | Franklin | 0.53% | 0.050%(+0.478)#13 | 0.097%(+0.431)#662 |
| 14. | Trenton | 0.47% | 0.050%(+0.422)#14 | 0.097%(+0.375)#751 |
| 15. | Allen | 0.47% | 0.050%(+0.419)#15 | 0.097%(+0.372)#755 |
| 16. | Clawson | 0.43% | 0.050%(+0.380)#16 | 0.097%(+0.333)#825 |
| 17. | Pontiac | 0.43% | 0.050%(+0.378)#17 | 0.097%(+0.331)#832 |
| 18. | Calumet | 0.42% | 0.050%(+0.367)#18 | 0.097%(+0.320)#855 |
| 19. | Rochester | 0.42% | 0.050%(+0.366)#19 | 0.097%(+0.319)#858 |
| 20. | Onaway | 0.37% | 0.050%(+0.319)#20 | 0.097%(+0.272)#967 |
| 21. | Mayville | 0.34% | 0.050%(+0.293)#21 | 0.097%(+0.246)#1,034 |
| 22. | Hazel Park | 0.33% | 0.050%(+0.275)#22 | 0.097%(+0.228)#1,086 |
| 23. | Parma | 0.30% | 0.050%(+0.252)#23 | 0.097%(+0.205)#1,150 |
| 24. | Jenison | 0.29% | 0.050%(+0.239)#24 | 0.097%(+0.192)#1,188 |
| 25. | Jonesville | 0.26% | 0.050%(+0.210)#25 | 0.097%(+0.163)#1,297 |
| 26. | Waverly | 0.26% | 0.050%(+0.207)#26 | 0.097%(+0.160)#1,312 |
| 27. | Sebewaing | 0.26% | 0.050%(+0.206)#27 | 0.097%(+0.159)#1,316 |
| 28. | Bingham Farms | 0.25% | 0.050%(+0.196)#28 | 0.097%(+0.149)#1,355 |
| 29. | Morrice | 0.24% | 0.050%(+0.190)#29 | 0.097%(+0.143)#1,382 |
| 30. | Ann Arbor | 0.22% | 0.050%(+0.174)#30 | 0.097%(+0.127)#1,458 |
| 31. | Lawton | 0.21% | 0.050%(+0.164)#31 | 0.097%(+0.117)#1,513 |
| 32. | Niles | 0.19% | 0.050%(+0.144)#32 | 0.097%(+0.097)#1,635 |
| 33. | Escanaba | 0.19% | 0.050%(+0.143)#33 | 0.097%(+0.097)#1,637 |
| 34. | Ferndale | 0.19% | 0.050%(+0.137)#34 | 0.097%(+0.090)#1,683 |
| 35. | East Grand Rapids | 0.18% | 0.050%(+0.126)#35 | 0.097%(+0.079)#1,746 |
| 36. | Farmington | 0.17% | 0.050%(+0.124)#36 | 0.097%(+0.077)#1,755 |
| 37. | Lansing | 0.17% | 0.050%(+0.119)#37 | 0.097%(+0.072)#1,787 |
| 38. | Cutlerville | 0.17% | 0.050%(+0.116)#38 | 0.097%(+0.069)#1,803 |
| 39. | Britton | 0.16% | 0.050%(+0.107)#39 | 0.097%(+0.060)#1,867 |
| 40. | Rochester Hills | 0.15% | 0.050%(+0.101)#40 | 0.097%(+0.054)#1,904 |
| 41. | Fraser | 0.15% | 0.050%(+0.100)#41 | 0.097%(+0.053)#1,911 |
| 42. | Troy | 0.13% | 0.050%(+0.083)#42 | 0.097%(+0.036)#2,035 |
| 43. | Warren | 0.11% | 0.050%(+0.063)#43 | 0.097%(+0.016)#2,210 |
| 44. | Kentwood | 0.11% | 0.050%(+0.057)#44 | 0.097%(+0.010)#2,255 |
| 45. | Watervliet | 0.11% | 0.050%(+0.056)#45 | 0.097%(+0.009)#2,266 |
| 46. | Taylor | 0.084% | 0.050%(+0.034)#46 | 0.097%(-0.013)#2,465 |
| 47. | Haslett | 0.084% | 0.050%(+0.034)#47 | 0.097%(-0.013)#2,471 |
| 48. | Portage | 0.084% | 0.050%(+0.034)#48 | 0.097%(-0.013)#2,472 |
| 49. | Reading | 0.083% | 0.050%(+0.033)#49 | 0.097%(-0.014)#2,483 |
| 50. | Mount Clemens | 0.077% | 0.050%(+0.026)#50 | 0.097%(-0.020)#2,545 |
| 51. | Flint | 0.072% | 0.050%(+0.022)#51 | 0.097%(-0.025)#2,587 |
| 52. | Mount Pleasant | 0.069% | 0.050%(+0.019)#52 | 0.097%(-0.028)#2,622 |
| 53. | Okemos | 0.055% | 0.050%(+0.005)#53 | 0.097%(-0.042)#2,772 |
| 54. | Madison Heights | 0.049% | 0.050%(-0.001)#54 | 0.097%(-0.048)#2,846 |
| 55. | Sterling Heights | 0.046% | 0.050%(-0.004)#55 | 0.097%(-0.051)#2,880 |
| 56. | Garden City | 0.044% | 0.050%(-0.006)#56 | 0.097%(-0.053)#2,912 |
| 57. | Romulus | 0.044% | 0.050%(-0.006)#57 | 0.097%(-0.053)#2,917 |
| 58. | Grand Rapids | 0.042% | 0.050%(-0.008)#58 | 0.097%(-0.055)#2,933 |
| 59. | Roseville | 0.042% | 0.050%(-0.008)#59 | 0.097%(-0.055)#2,936 |
| 60. | East Lansing | 0.040% | 0.050%(-0.010)#60 | 0.097%(-0.057)#2,956 |
| 61. | Wyandotte | 0.036% | 0.050%(-0.014)#61 | 0.097%(-0.061)#2,982 |
| 62. | Lake Orion | 0.034% | 0.050%(-0.016)#62 | 0.097%(-0.063)#3,009 |
| 63. | Oak Park | 0.031% | 0.050%(-0.020)#63 | 0.097%(-0.066)#3,062 |
| 64. | Kalamazoo | 0.026% | 0.050%(-0.024)#64 | 0.097%(-0.071)#3,119 |
| 65. | Battle Creek | 0.017% | 0.050%(-0.033)#65 | 0.097%(-0.080)#3,204 |
| 66. | St Clair Shores | 0.017% | 0.050%(-0.033)#66 | 0.097%(-0.080)#3,206 |
| 67. | Livonia | 0.017% | 0.050%(-0.033)#67 | 0.097%(-0.080)#3,212 |
| 68. | Farmington Hills | 0.016% | 0.050%(-0.035)#68 | 0.097%(-0.081)#3,228 |
| 69. | Southgate | 0.013% | 0.050%(-0.037)#69 | 0.097%(-0.084)#3,251 |
| 70. | Muskegon | 0.013% | 0.050%(-0.037)#70 | 0.097%(-0.084)#3,252 |
| 71. | Detroit | 0.0047% | 0.050%(-0.045)#71 | 0.097%(-0.092)#3,311 |
| 72. | Southfield | 0.0026% | 0.050%(-0.047)#72 | 0.097%(-0.094)#3,320 |
Common Questions
What are the Top 10 Cities with the Highest Percentage of Pakistani Population in Michigan?
Top 10 Cities with the Highest Percentage of Pakistani Population in Michigan are:
#1
1.26%
#2
0.99%
#3
0.88%
#4
0.75%
#5
0.64%
#6
0.64%
#7
0.61%
#8
0.59%
#9
0.58%
#10
0.55%
What city has the Highest Percentage of Pakistani Population in Michigan?
Bronson has the Highest Percentage of Pakistani Population in Michigan with 1.26%.
What is the Percentage of Pakistani Population in the State of Michigan?
Percentage of Pakistani Population in Michigan is 0.050%.
What is the Percentage of Pakistani Population in the United States?
Percentage of Pakistani Population in the United States is 0.097%.