Cities with the Highest Percentage of Immigrants from Peru in Texas
RELATED REPORTS & OPTIONS
Peru
Texas
Compare Cities
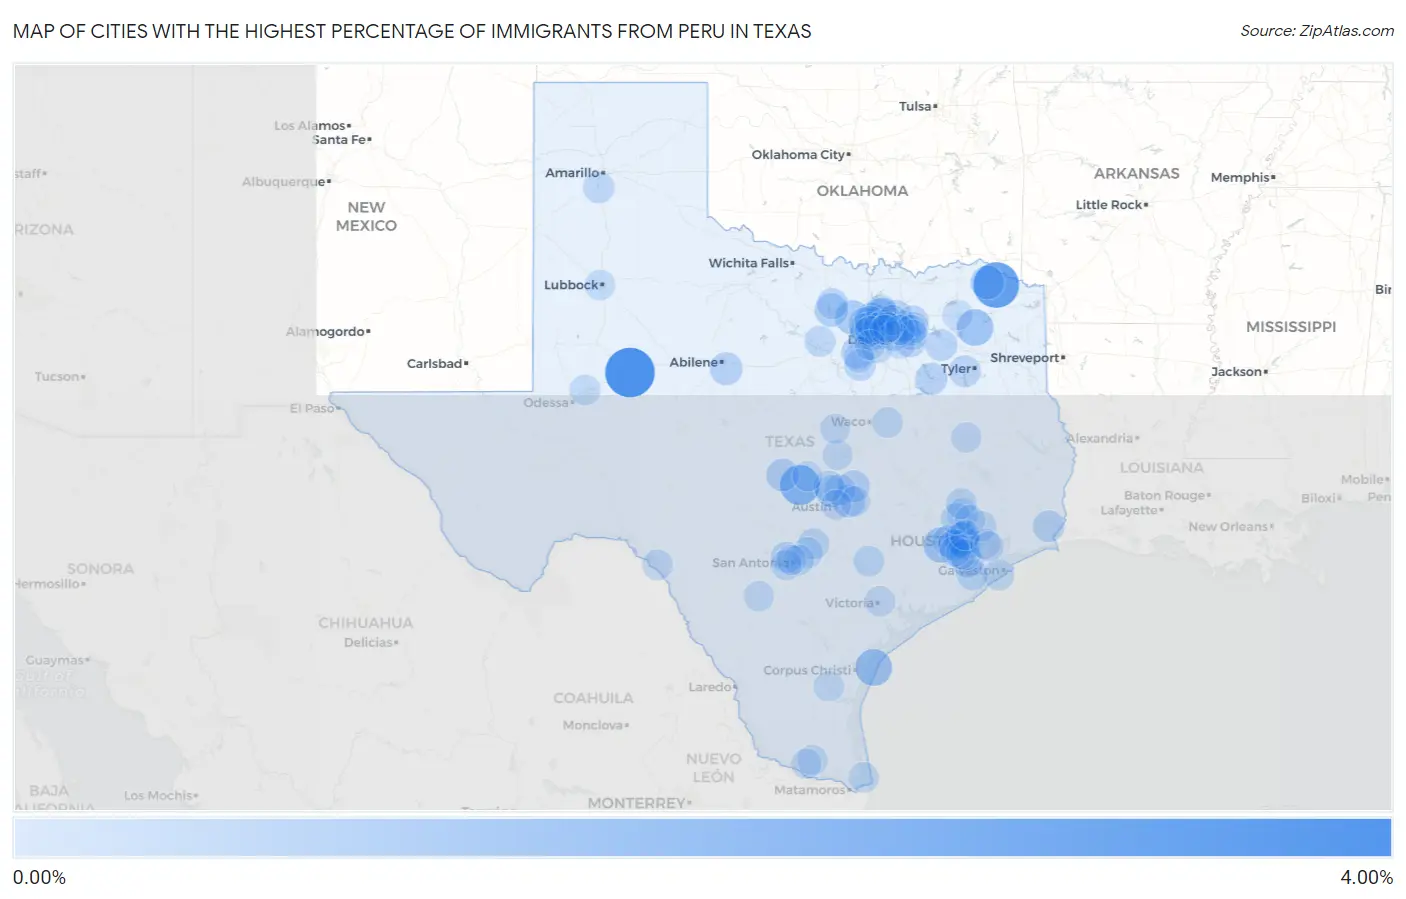
Map of Cities with the Highest Percentage of Immigrants from Peru in Texas
0.00%
4.00%
Cities with the Highest Percentage of Immigrants from Peru in Texas
| City | Peru | vs State | vs National | |
| 1. | Sand Springs | 3.09% | 0.074%(+3.01)#-1 | 0.14%(+2.95)#0 |
| 2. | Annona | 2.46% | 0.074%(+2.38)#0 | 0.14%(+2.32)#1 |
| 3. | Granite Shoals | 1.57% | 0.074%(+1.50)#1 | 0.14%(+1.43)#2 |
| 4. | Port Aransas | 1.07% | 0.074%(+1.000)#2 | 0.14%(+0.935)#3 |
| 5. | Winnsboro | 1.02% | 0.074%(+0.946)#3 | 0.14%(+0.881)#4 |
| 6. | Fulshear | 0.90% | 0.074%(+0.826)#4 | 0.14%(+0.761)#5 |
| 7. | New Fairview | 0.73% | 0.074%(+0.659)#5 | 0.14%(+0.594)#6 |
| 8. | Double Oak | 0.72% | 0.074%(+0.650)#6 | 0.14%(+0.585)#7 |
| 9. | Bunker Hill Village | 0.63% | 0.074%(+0.554)#7 | 0.14%(+0.489)#8 |
| 10. | Clarksville | 0.63% | 0.074%(+0.553)#8 | 0.14%(+0.488)#9 |
| 11. | Hedwig Village | 0.60% | 0.074%(+0.529)#9 | 0.14%(+0.464)#10 |
| 12. | Lake Bridgeport | 0.57% | 0.074%(+0.499)#10 | 0.14%(+0.434)#11 |
| 13. | Lakewood Village | 0.54% | 0.074%(+0.461)#11 | 0.14%(+0.396)#12 |
| 14. | Roanoke | 0.48% | 0.074%(+0.407)#12 | 0.14%(+0.342)#13 |
| 15. | Llano | 0.47% | 0.074%(+0.400)#13 | 0.14%(+0.335)#14 |
| 16. | Potosi | 0.47% | 0.074%(+0.393)#14 | 0.14%(+0.328)#15 |
| 17. | Manor | 0.44% | 0.074%(+0.369)#15 | 0.14%(+0.304)#16 |
| 18. | Crowley | 0.42% | 0.074%(+0.344)#16 | 0.14%(+0.279)#17 |
| 19. | Allen | 0.42% | 0.074%(+0.344)#84 | 0.14%(+0.279)#1,309 |
| 20. | Rowlett | 0.41% | 0.074%(+0.338)#85 | 0.14%(+0.273)#1,310 |
| 21. | Iowa Colony | 0.41% | 0.074%(+0.336)#86 | 0.14%(+0.271)#1,311 |
| 22. | Star Harbor | 0.39% | 0.074%(+0.319)#87 | 0.14%(+0.254)#1,312 |
| 23. | Cinco Ranch | 0.38% | 0.074%(+0.302)#88 | 0.14%(+0.237)#1,313 |
| 24. | Cedar Park | 0.37% | 0.074%(+0.299)#89 | 0.14%(+0.234)#1,314 |
| 25. | Taylor | 0.37% | 0.074%(+0.296)#90 | 0.14%(+0.232)#1,315 |
| 26. | Forney | 0.36% | 0.074%(+0.282)#91 | 0.14%(+0.217)#1,316 |
| 27. | Edgewood | 0.35% | 0.074%(+0.274)#92 | 0.14%(+0.209)#1,317 |
| 28. | Bellaire | 0.34% | 0.074%(+0.269)#93 | 0.14%(+0.204)#1,318 |
| 29. | Lewisville | 0.33% | 0.074%(+0.252)#94 | 0.14%(+0.187)#1,319 |
| 30. | Hackberry | 0.31% | 0.074%(+0.240)#95 | 0.14%(+0.175)#1,320 |
| 31. | Nederland | 0.31% | 0.074%(+0.238)#100 | 0.14%(+0.173)#1,530 |
| 32. | Chandler | 0.30% | 0.074%(+0.228)#101 | 0.14%(+0.163)#1,531 |
| 33. | Keene | 0.29% | 0.074%(+0.220)#102 | 0.14%(+0.155)#1,532 |
| 34. | Sachse | 0.29% | 0.074%(+0.217)#103 | 0.14%(+0.152)#1,533 |
| 35. | Nevada | 0.29% | 0.074%(+0.215)#104 | 0.14%(+0.150)#1,534 |
| 36. | Mission Bend | 0.28% | 0.074%(+0.203)#105 | 0.14%(+0.138)#1,535 |
| 37. | Canyon | 0.27% | 0.074%(+0.197)#106 | 0.14%(+0.132)#1,536 |
| 38. | Round Rock | 0.26% | 0.074%(+0.183)#107 | 0.14%(+0.118)#1,537 |
| 39. | Leon Valley | 0.25% | 0.074%(+0.178)#108 | 0.14%(+0.113)#1,538 |
| 40. | Chico | 0.25% | 0.074%(+0.171)#109 | 0.14%(+0.106)#1,539 |
| 41. | Millsap | 0.23% | 0.074%(+0.158)#110 | 0.14%(+0.093)#1,540 |
| 42. | The Woodlands | 0.23% | 0.074%(+0.156)#111 | 0.14%(+0.091)#1,541 |
| 43. | Grand Prairie | 0.22% | 0.074%(+0.148)#112 | 0.14%(+0.083)#1,542 |
| 44. | Galveston | 0.22% | 0.074%(+0.145)#113 | 0.14%(+0.080)#1,543 |
| 45. | Leander | 0.22% | 0.074%(+0.143)#114 | 0.14%(+0.078)#1,544 |
| 46. | Irving | 0.21% | 0.074%(+0.137)#115 | 0.14%(+0.072)#1,545 |
| 47. | Tomball | 0.21% | 0.074%(+0.131)#116 | 0.14%(+0.067)#1,546 |
| 48. | Danbury | 0.20% | 0.074%(+0.130)#117 | 0.14%(+0.065)#1,547 |
| 49. | Conroe | 0.20% | 0.074%(+0.127)#118 | 0.14%(+0.062)#1,548 |
| 50. | Southlake | 0.20% | 0.074%(+0.124)#119 | 0.14%(+0.059)#1,549 |
| 51. | New Braunfels | 0.20% | 0.074%(+0.122)#120 | 0.14%(+0.057)#1,550 |
| 52. | Shiner | 0.19% | 0.074%(+0.117)#121 | 0.14%(+0.052)#1,551 |
| 53. | Schertz | 0.19% | 0.074%(+0.114)#122 | 0.14%(+0.049)#1,552 |
| 54. | Euless | 0.18% | 0.074%(+0.108)#123 | 0.14%(+0.043)#1,553 |
| 55. | Fresno | 0.18% | 0.074%(+0.108)#124 | 0.14%(+0.043)#1,554 |
| 56. | Midland | 0.18% | 0.074%(+0.103)#125 | 0.14%(+0.038)#1,555 |
| 57. | Keller | 0.18% | 0.074%(+0.102)#126 | 0.14%(+0.037)#1,556 |
| 58. | Del Rio | 0.17% | 0.074%(+0.096)#127 | 0.14%(+0.031)#1,557 |
| 59. | Atascocita | 0.16% | 0.074%(+0.087)#128 | 0.14%(+0.022)#1,558 |
| 60. | Missouri City | 0.16% | 0.074%(+0.087)#129 | 0.14%(+0.022)#1,559 |
| 61. | Fate | 0.16% | 0.074%(+0.083)#130 | 0.14%(+0.018)#1,560 |
| 62. | Paloma Creek South | 0.15% | 0.074%(+0.078)#131 | 0.14%(+0.013)#1,561 |
| 63. | Kirby | 0.15% | 0.074%(+0.073)#132 | 0.14%(+0.008)#1,562 |
| 64. | Carrollton | 0.14% | 0.074%(+0.067)#133 | 0.14%(+0.002)#1,563 |
| 65. | Lackland Afb | 0.14% | 0.074%(+0.067)#134 | 0.14%(+0.002)#1,564 |
| 66. | Mart | 0.14% | 0.074%(+0.063)#135 | 0.14%(-0.002)#1,565 |
| 67. | Rockwall | 0.14% | 0.074%(+0.061)#136 | 0.14%(-0.004)#1,566 |
| 68. | Laguna Heights | 0.13% | 0.074%(+0.061)#137 | 0.14%(-0.004)#1,567 |
| 69. | North Richland Hills | 0.13% | 0.074%(+0.060)#138 | 0.14%(-0.005)#1,568 |
| 70. | Sugar Land | 0.13% | 0.074%(+0.059)#139 | 0.14%(-0.006)#1,569 |
| 71. | Mclendon Chisholm | 0.13% | 0.074%(+0.059)#140 | 0.14%(-0.006)#1,570 |
| 72. | Flower Mound | 0.13% | 0.074%(+0.056)#141 | 0.14%(-0.009)#1,571 |
| 73. | Lubbock | 0.13% | 0.074%(+0.055)#142 | 0.14%(-0.010)#1,572 |
| 74. | Victoria | 0.13% | 0.074%(+0.051)#143 | 0.14%(-0.014)#1,573 |
| 75. | Pearsall | 0.12% | 0.074%(+0.050)#144 | 0.14%(-0.015)#1,574 |
| 76. | Balch Springs | 0.12% | 0.074%(+0.046)#145 | 0.14%(-0.019)#1,575 |
| 77. | Kingsville | 0.12% | 0.074%(+0.044)#146 | 0.14%(-0.021)#1,576 |
| 78. | Coppell | 0.12% | 0.074%(+0.043)#147 | 0.14%(-0.022)#1,577 |
| 79. | Colleyville | 0.12% | 0.074%(+0.042)#148 | 0.14%(-0.023)#1,578 |
| 80. | Crockett | 0.11% | 0.074%(+0.036)#149 | 0.14%(-0.029)#1,579 |
| 81. | Plano | 0.11% | 0.074%(+0.035)#150 | 0.14%(-0.030)#1,580 |
| 82. | Sulphur Springs | 0.11% | 0.074%(+0.032)#151 | 0.14%(-0.033)#1,581 |
| 83. | Edinburg | 0.10% | 0.074%(+0.031)#152 | 0.14%(-0.034)#1,582 |
| 84. | Elgin | 0.100% | 0.074%(+0.025)#153 | 0.14%(-0.040)#1,583 |
| 85. | Dallas | 0.097% | 0.074%(+0.022)#154 | 0.14%(-0.043)#1,584 |
| 86. | Killeen | 0.094% | 0.074%(+0.020)#155 | 0.14%(-0.045)#1,585 |
| 87. | Burnet | 0.093% | 0.074%(+0.018)#156 | 0.14%(-0.047)#1,586 |
| 88. | Spring | 0.092% | 0.074%(+0.018)#157 | 0.14%(-0.047)#1,587 |
| 89. | Deer Park | 0.091% | 0.074%(+0.017)#158 | 0.14%(-0.048)#1,588 |
| 90. | Houston | 0.090% | 0.074%(+0.016)#159 | 0.14%(-0.049)#1,589 |
| 91. | Garland | 0.089% | 0.074%(+0.015)#160 | 0.14%(-0.050)#1,590 |
| 92. | Addison | 0.088% | 0.074%(+0.014)#161 | 0.14%(-0.051)#1,591 |
| 93. | Burleson | 0.086% | 0.074%(+0.011)#162 | 0.14%(-0.054)#1,592 |
| 94. | Gatesville | 0.082% | 0.074%(+0.008)#163 | 0.14%(-0.057)#1,593 |
| 95. | Austin | 0.081% | 0.074%(+0.006)#164 | 0.14%(-0.059)#1,594 |
| 96. | San Antonio | 0.080% | 0.074%(+0.006)#165 | 0.14%(-0.059)#1,595 |
| 97. | Arlington | 0.080% | 0.074%(+0.006)#166 | 0.14%(-0.059)#1,596 |
| 98. | Mcallen | 0.080% | 0.074%(+0.006)#167 | 0.14%(-0.059)#1,597 |
| 99. | Farmers Branch | 0.078% | 0.074%(+0.003)#168 | 0.14%(-0.062)#1,598 |
| 100. | La Porte | 0.075% | 0.074%(+0.001)#169 | 0.14%(-0.064)#1,599 |
Common Questions
What are the Top 10 Cities with the Highest Percentage of Immigrants from Peru in Texas?
Top 10 Cities with the Highest Percentage of Immigrants from Peru in Texas are:
#1
3.09%
#2
2.46%
#3
1.57%
#4
1.07%
#5
1.02%
#6
0.90%
#7
0.73%
#8
0.72%
#9
0.63%
#10
0.63%
What city has the Highest Percentage of Immigrants from Peru in Texas?
Sand Springs has the Highest Percentage of Immigrants from Peru in Texas with 3.09%.
What is the Percentage of Immigrants from Peru in the State of Texas?
Percentage of Immigrants from Peru in Texas is 0.074%.
What is the Percentage of Immigrants from Peru in the United States?
Percentage of Immigrants from Peru in the United States is 0.14%.