Cities with the Highest Percentage of Immigrants from Peru in Pennsylvania
RELATED REPORTS & OPTIONS
Peru
Pennsylvania
Compare Cities
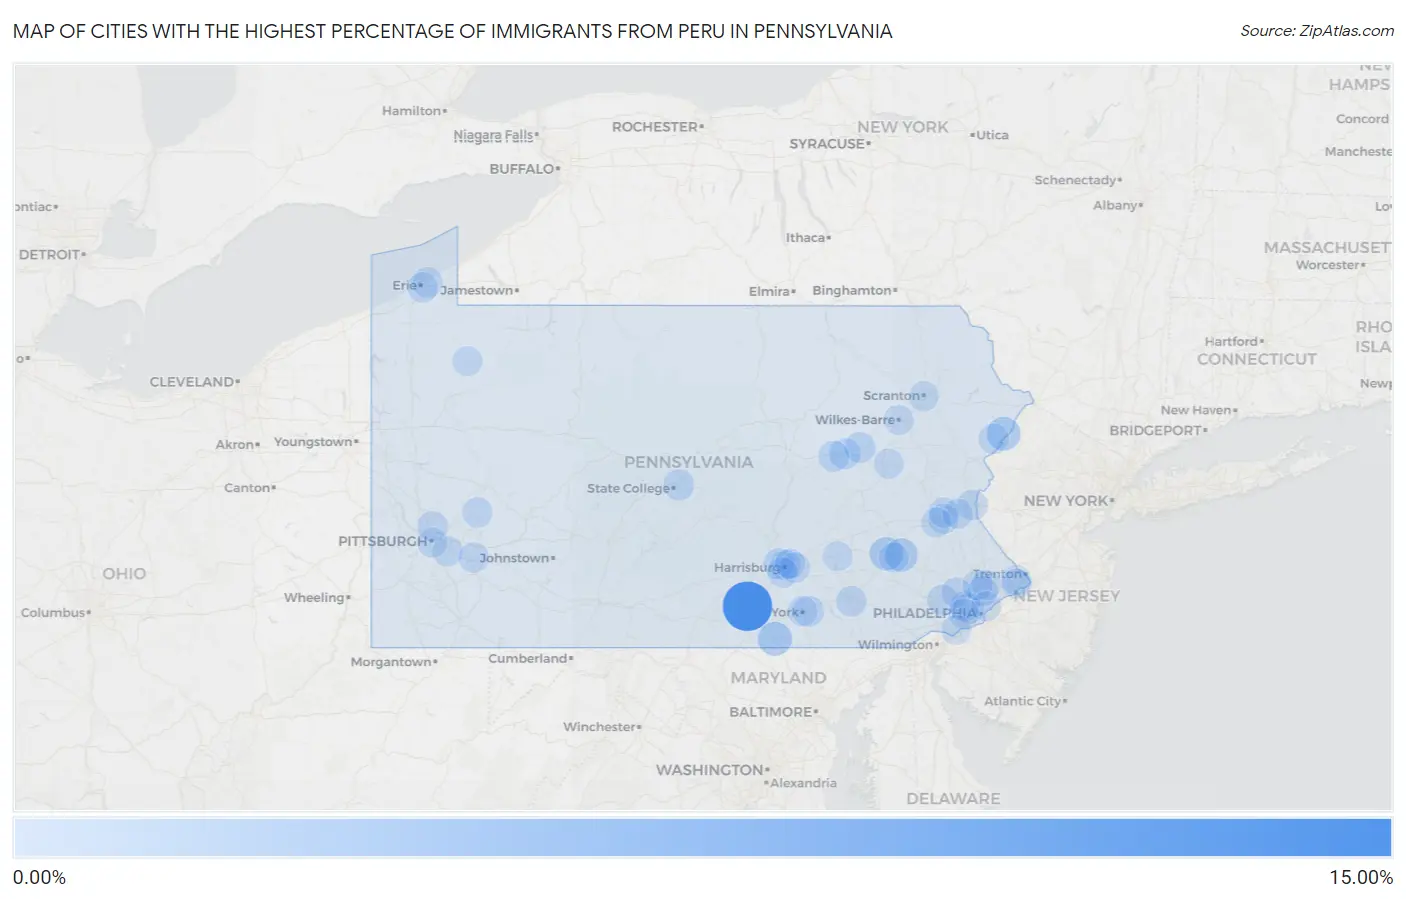
Map of Cities with the Highest Percentage of Immigrants from Peru in Pennsylvania
0.00%
15.00%
Cities with the Highest Percentage of Immigrants from Peru in Pennsylvania
| City | Peru | vs State | vs National | |
| 1. | Gardners | 13.40% | 0.052%(+13.4)#-1 | 0.14%(+13.3)#0 |
| 2. | Mount Holly Springs Borough | 2.92% | 0.052%(+2.87)#0 | 0.14%(+2.79)#1 |
| 3. | Jonestown Borough | 2.73% | 0.052%(+2.68)#1 | 0.14%(+2.59)#2 |
| 4. | Parkville | 2.59% | 0.052%(+2.54)#2 | 0.14%(+2.45)#3 |
| 5. | Pocono Mountain Lake Estates | 2.36% | 0.052%(+2.31)#3 | 0.14%(+2.22)#4 |
| 6. | Spring Ridge | 2.23% | 0.052%(+2.18)#4 | 0.14%(+2.09)#5 |
| 7. | Bendersville Borough | 2.11% | 0.052%(+2.06)#5 | 0.14%(+1.97)#6 |
| 8. | Stony Creek Mills | 2.08% | 0.052%(+2.03)#6 | 0.14%(+1.94)#7 |
| 9. | Abbottstown Borough | 1.29% | 0.052%(+1.24)#7 | 0.14%(+1.15)#8 |
| 10. | Freemansburg Borough | 1.12% | 0.052%(+1.07)#8 | 0.14%(+0.979)#9 |
| 11. | Alburtis Borough | 1.05% | 0.052%(+0.999)#9 | 0.14%(+0.912)#10 |
| 12. | Schellsburg Borough | 1.00% | 0.052%(+0.952)#10 | 0.14%(+0.864)#11 |
| 13. | Northampton Borough | 1.00% | 0.052%(+0.945)#11 | 0.14%(+0.857)#12 |
| 14. | New Britain Borough | 0.91% | 0.052%(+0.862)#12 | 0.14%(+0.774)#13 |
| 15. | Mount Joy Borough | 0.89% | 0.052%(+0.843)#13 | 0.14%(+0.755)#14 |
| 16. | Mcadoo Borough | 0.89% | 0.052%(+0.839)#14 | 0.14%(+0.751)#15 |
| 17. | Chambersburg Borough | 0.87% | 0.052%(+0.815)#15 | 0.14%(+0.728)#16 |
| 18. | White Haven Borough | 0.84% | 0.052%(+0.791)#16 | 0.14%(+0.703)#17 |
| 19. | East York | 0.78% | 0.052%(+0.728)#17 | 0.14%(+0.640)#18 |
| 20. | Lime Ridge | 0.70% | 0.052%(+0.652)#18 | 0.14%(+0.564)#19 |
| 21. | East Berwick | 0.63% | 0.052%(+0.573)#19 | 0.14%(+0.486)#20 |
| 22. | Bloomsburg | 0.62% | 0.052%(+0.572)#20 | 0.14%(+0.484)#21 |
| 23. | Enola | 0.62% | 0.052%(+0.567)#21 | 0.14%(+0.479)#22 |
| 24. | Lemont | 0.58% | 0.052%(+0.524)#22 | 0.14%(+0.436)#23 |
| 25. | Doylestown Borough | 0.57% | 0.052%(+0.514)#23 | 0.14%(+0.427)#24 |
| 26. | Parryville Borough | 0.54% | 0.052%(+0.489)#24 | 0.14%(+0.401)#25 |
| 27. | Carlisle Borough | 0.52% | 0.052%(+0.467)#25 | 0.14%(+0.379)#26 |
| 28. | Roslyn | 0.51% | 0.052%(+0.458)#26 | 0.14%(+0.370)#27 |
| 29. | Paoli | 0.44% | 0.052%(+0.390)#27 | 0.14%(+0.302)#643 |
| 30. | Easton | 0.44% | 0.052%(+0.388)#28 | 0.14%(+0.300)#644 |
| 31. | New Hope Borough | 0.42% | 0.052%(+0.368)#29 | 0.14%(+0.280)#645 |
| 32. | Lancaster | 0.40% | 0.052%(+0.344)#30 | 0.14%(+0.256)#646 |
| 33. | Penn Wynne | 0.38% | 0.052%(+0.324)#31 | 0.14%(+0.236)#647 |
| 34. | Catawissa Borough | 0.36% | 0.052%(+0.309)#32 | 0.14%(+0.221)#648 |
| 35. | Manchester Borough | 0.36% | 0.052%(+0.305)#33 | 0.14%(+0.218)#649 |
| 36. | East Stroudsburg Borough | 0.34% | 0.052%(+0.291)#34 | 0.14%(+0.203)#650 |
| 37. | Lawrence Park | 0.31% | 0.052%(+0.263)#35 | 0.14%(+0.175)#651 |
| 38. | Narberth Borough | 0.31% | 0.052%(+0.261)#36 | 0.14%(+0.173)#652 |
| 39. | Erie | 0.31% | 0.052%(+0.259)#37 | 0.14%(+0.171)#653 |
| 40. | Harrisburg | 0.30% | 0.052%(+0.250)#38 | 0.14%(+0.162)#1,042 |
| 41. | Mount Penn Borough | 0.28% | 0.052%(+0.228)#39 | 0.14%(+0.140)#1,043 |
| 42. | Glenside | 0.27% | 0.052%(+0.220)#40 | 0.14%(+0.132)#1,044 |
| 43. | Lawnton | 0.27% | 0.052%(+0.220)#41 | 0.14%(+0.132)#1,045 |
| 44. | Hatboro Borough | 0.27% | 0.052%(+0.218)#42 | 0.14%(+0.130)#1,046 |
| 45. | Sharon Hill Borough | 0.27% | 0.052%(+0.216)#43 | 0.14%(+0.128)#1,047 |
| 46. | Bally Borough | 0.27% | 0.052%(+0.216)#44 | 0.14%(+0.128)#1,048 |
| 47. | Parkesburg Borough | 0.26% | 0.052%(+0.206)#45 | 0.14%(+0.118)#1,049 |
| 48. | Wayne | 0.25% | 0.052%(+0.202)#46 | 0.14%(+0.115)#1,050 |
| 49. | Matamoras Borough | 0.25% | 0.052%(+0.199)#47 | 0.14%(+0.111)#1,051 |
| 50. | Duquesne | 0.25% | 0.052%(+0.197)#48 | 0.14%(+0.109)#1,052 |
| 51. | Saw Creek | 0.25% | 0.052%(+0.194)#49 | 0.14%(+0.106)#1,053 |
| 52. | Lower Allen | 0.24% | 0.052%(+0.193)#50 | 0.14%(+0.106)#1,054 |
| 53. | Cressona Borough | 0.23% | 0.052%(+0.177)#51 | 0.14%(+0.089)#1,055 |
| 54. | Jeannette | 0.22% | 0.052%(+0.165)#52 | 0.14%(+0.077)#1,056 |
| 55. | Glenshaw | 0.21% | 0.052%(+0.161)#53 | 0.14%(+0.073)#1,057 |
| 56. | Camp Hill Borough | 0.21% | 0.052%(+0.158)#54 | 0.14%(+0.070)#1,058 |
| 57. | Allentown | 0.19% | 0.052%(+0.143)#55 | 0.14%(+0.055)#1,059 |
| 58. | Fullerton | 0.19% | 0.052%(+0.138)#56 | 0.14%(+0.050)#1,060 |
| 59. | Shenandoah Borough | 0.19% | 0.052%(+0.135)#57 | 0.14%(+0.047)#1,061 |
| 60. | Hyde Park | 0.17% | 0.052%(+0.120)#58 | 0.14%(+0.032)#1,062 |
| 61. | Ardmore | 0.17% | 0.052%(+0.119)#59 | 0.14%(+0.031)#1,063 |
| 62. | Pleasant Hills Borough | 0.17% | 0.052%(+0.114)#60 | 0.14%(+0.026)#1,064 |
| 63. | Norwood Borough | 0.13% | 0.052%(+0.083)#61 | 0.14%(-0.004)#1,065 |
| 64. | Bethlehem | 0.13% | 0.052%(+0.079)#62 | 0.14%(-0.009)#1,066 |
| 65. | King Of Prussia | 0.13% | 0.052%(+0.075)#63 | 0.14%(-0.012)#1,067 |
| 66. | Fort Washington | 0.13% | 0.052%(+0.075)#64 | 0.14%(-0.013)#1,068 |
| 67. | Progress | 0.12% | 0.052%(+0.072)#65 | 0.14%(-0.016)#1,069 |
| 68. | Mount Carmel Borough | 0.12% | 0.052%(+0.071)#66 | 0.14%(-0.017)#1,070 |
| 69. | Adamstown Borough | 0.12% | 0.052%(+0.070)#67 | 0.14%(-0.017)#1,071 |
| 70. | Quakertown Borough | 0.12% | 0.052%(+0.067)#68 | 0.14%(-0.021)#1,072 |
| 71. | Brentwood Borough | 0.11% | 0.052%(+0.059)#69 | 0.14%(-0.029)#1,073 |
| 72. | Millersville Borough | 0.11% | 0.052%(+0.055)#70 | 0.14%(-0.033)#1,074 |
| 73. | Chester Heights Borough | 0.10% | 0.052%(+0.052)#71 | 0.14%(-0.036)#1,075 |
| 74. | Emmaus Borough | 0.10% | 0.052%(+0.052)#72 | 0.14%(-0.036)#1,076 |
| 75. | York | 0.10% | 0.052%(+0.049)#73 | 0.14%(-0.039)#1,077 |
| 76. | Wilkes Barre | 0.088% | 0.052%(+0.037)#74 | 0.14%(-0.051)#1,078 |
| 77. | Franklin Park Borough | 0.085% | 0.052%(+0.033)#75 | 0.14%(-0.054)#1,079 |
| 78. | Catasauqua Borough | 0.077% | 0.052%(+0.025)#76 | 0.14%(-0.063)#1,080 |
| 79. | Titusville | 0.076% | 0.052%(+0.025)#77 | 0.14%(-0.063)#1,081 |
| 80. | East Lansdowne Borough | 0.074% | 0.052%(+0.022)#78 | 0.14%(-0.065)#1,082 |
| 81. | Hanover Borough | 0.073% | 0.052%(+0.022)#79 | 0.14%(-0.066)#1,083 |
| 82. | Willow Grove | 0.073% | 0.052%(+0.021)#80 | 0.14%(-0.067)#1,084 |
| 83. | Reading | 0.062% | 0.052%(+0.011)#81 | 0.14%(-0.077)#1,085 |
| 84. | Scranton | 0.062% | 0.052%(+0.010)#82 | 0.14%(-0.078)#1,086 |
| 85. | Philadelphia | 0.060% | 0.052%(+0.009)#83 | 0.14%(-0.079)#1,466 |
| 86. | Drexel Hill | 0.058% | 0.052%(+0.007)#84 | 0.14%(-0.081)#1,467 |
| 87. | Hazleton | 0.057% | 0.052%(+0.006)#85 | 0.14%(-0.082)#1,468 |
| 88. | Fairless Hills | 0.055% | 0.052%(+0.003)#86 | 0.14%(-0.084)#1,469 |
| 89. | Chester | 0.042% | 0.052%(-0.009)#87 | 0.14%(-0.097)#1,470 |
| 90. | Lebanon | 0.037% | 0.052%(-0.014)#88 | 0.14%(-0.102)#1,471 |
| 91. | Levittown | 0.037% | 0.052%(-0.014)#89 | 0.14%(-0.102)#1,472 |
| 92. | Wilkinsburg Borough | 0.035% | 0.052%(-0.017)#90 | 0.14%(-0.104)#1,473 |
| 93. | Pittsburgh | 0.030% | 0.052%(-0.022)#91 | 0.14%(-0.110)#1,474 |
| 94. | Baldwin Borough | 0.028% | 0.052%(-0.023)#92 | 0.14%(-0.111)#1,475 |
| 95. | West Chester Borough | 0.021% | 0.052%(-0.030)#93 | 0.14%(-0.118)#1,476 |
| 96. | Wescosville | 0.015% | 0.052%(-0.037)#94 | 0.14%(-0.125)#1,477 |
| 97. | Elkins Park | 0.014% | 0.052%(-0.037)#95 | 0.14%(-0.125)#1,478 |
| 98. | Plum Borough | 0.011% | 0.052%(-0.040)#96 | 0.14%(-0.128)#1,479 |
Common Questions
What are the Top 10 Cities with the Highest Percentage of Immigrants from Peru in Pennsylvania?
Top 10 Cities with the Highest Percentage of Immigrants from Peru in Pennsylvania are:
#1
13.40%
#2
2.59%
#3
2.36%
#4
2.23%
#5
2.08%
#6
0.78%
#7
0.70%
#8
0.63%
#9
0.62%
#10
0.62%
What city has the Highest Percentage of Immigrants from Peru in Pennsylvania?
Gardners has the Highest Percentage of Immigrants from Peru in Pennsylvania with 13.40%.
What is the Percentage of Immigrants from Peru in the State of Pennsylvania?
Percentage of Immigrants from Peru in Pennsylvania is 0.052%.
What is the Percentage of Immigrants from Peru in the United States?
Percentage of Immigrants from Peru in the United States is 0.14%.