Cities with the Highest Percentage of Guamanian / Chamorro Population in New York
RELATED REPORTS & OPTIONS
Guamanian / Chamorro
New York
Compare Cities
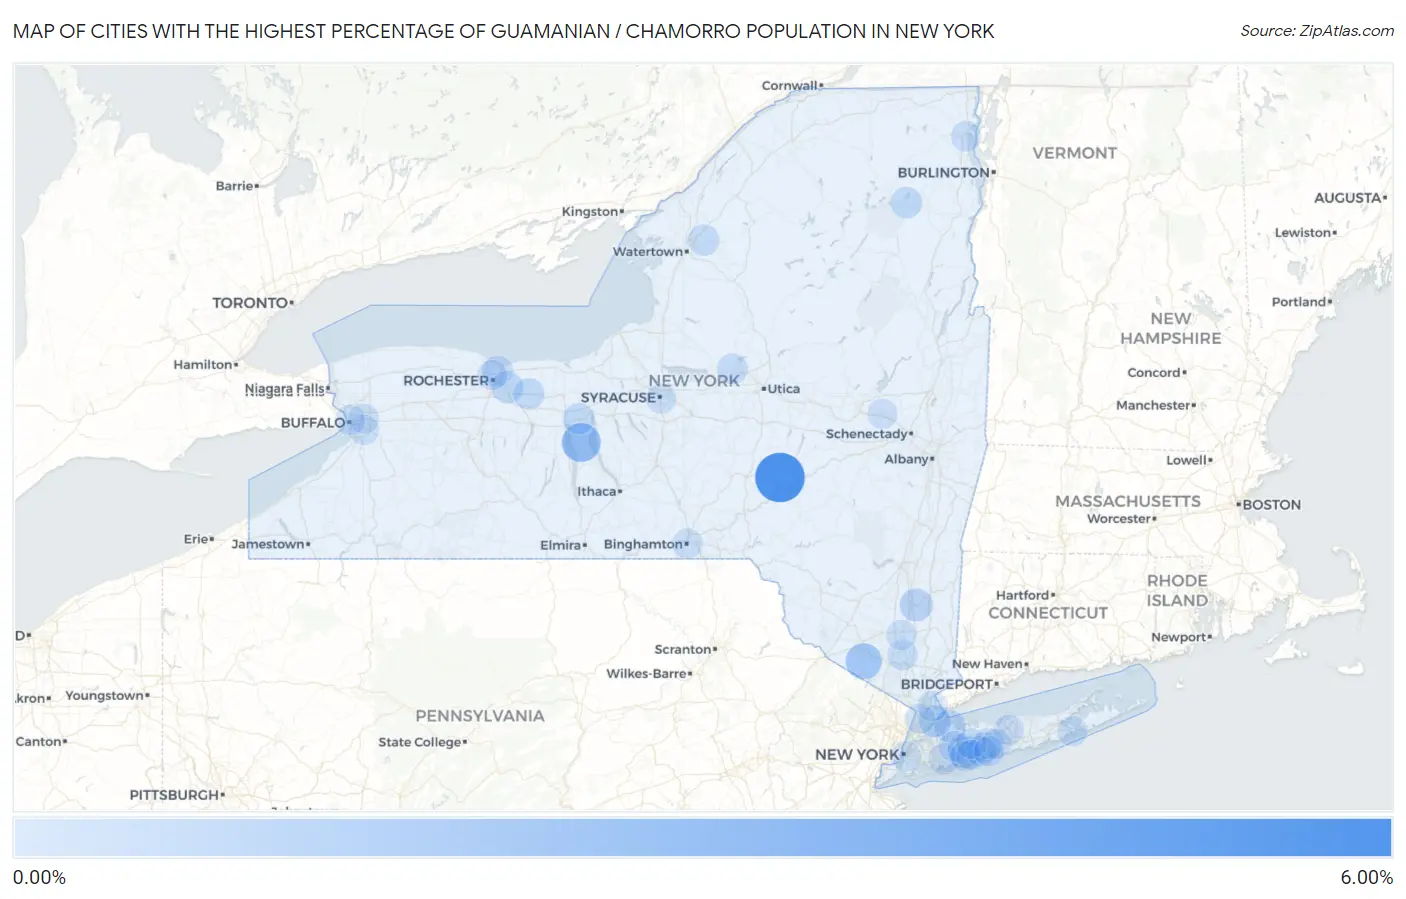
Map of Cities with the Highest Percentage of Guamanian / Chamorro Population in New York
0.00%
6.00%
Cities with the Highest Percentage of Guamanian / Chamorro Population in New York
| City | Guamanian / Chamorro | vs State | vs National | |
| 1. | Laurens | 5.38% | 0.011%(+5.37)#1 | 0.047%(+5.33)#15 |
| 2. | Romulus | 2.35% | 0.011%(+2.34)#2 | 0.047%(+2.30)#66 |
| 3. | Florida | 1.60% | 0.011%(+1.59)#3 | 0.047%(+1.55)#112 |
| 4. | Arlington | 0.75% | 0.011%(+0.738)#4 | 0.047%(+0.702)#257 |
| 5. | Lattingtown | 0.54% | 0.011%(+0.529)#5 | 0.047%(+0.493)#362 |
| 6. | Plainedge | 0.49% | 0.011%(+0.480)#6 | 0.047%(+0.444)#389 |
| 7. | Mamaroneck | 0.47% | 0.011%(+0.456)#7 | 0.047%(+0.420)#408 |
| 8. | East Rochester | 0.44% | 0.011%(+0.432)#8 | 0.047%(+0.396)#428 |
| 9. | Macedon | 0.36% | 0.011%(+0.349)#9 | 0.047%(+0.313)#503 |
| 10. | Lake Placid | 0.35% | 0.011%(+0.340)#10 | 0.047%(+0.304)#508 |
| 11. | Waterloo | 0.33% | 0.011%(+0.316)#11 | 0.047%(+0.280)#530 |
| 12. | Fort Drum | 0.27% | 0.011%(+0.259)#12 | 0.047%(+0.223)#621 |
| 13. | Lakeview | 0.22% | 0.011%(+0.208)#13 | 0.047%(+0.172)#714 |
| 14. | Irondequoit | 0.22% | 0.011%(+0.206)#14 | 0.047%(+0.170)#720 |
| 15. | Rome | 0.16% | 0.011%(+0.145)#15 | 0.047%(+0.110)#885 |
| 16. | Baywood | 0.13% | 0.011%(+0.115)#16 | 0.047%(+0.079)#973 |
| 17. | New Cassel | 0.11% | 0.011%(+0.102)#17 | 0.047%(+0.066)#1,025 |
| 18. | Plattsburgh | 0.11% | 0.011%(+0.100)#18 | 0.047%(+0.064)#1,035 |
| 19. | West Point | 0.11% | 0.011%(+0.099)#19 | 0.047%(+0.063)#1,043 |
| 20. | Brentwood | 0.11% | 0.011%(+0.099)#20 | 0.047%(+0.063)#1,047 |
| 21. | Centereach | 0.094% | 0.011%(+0.083)#21 | 0.047%(+0.048)#1,102 |
| 22. | Bethpage | 0.081% | 0.011%(+0.070)#22 | 0.047%(+0.034)#1,170 |
| 23. | North Massapequa | 0.066% | 0.011%(+0.055)#23 | 0.047%(+0.019)#1,243 |
| 24. | North Babylon | 0.065% | 0.011%(+0.055)#24 | 0.047%(+0.019)#1,252 |
| 25. | Melville | 0.065% | 0.011%(+0.054)#25 | 0.047%(+0.018)#1,256 |
| 26. | Binghamton | 0.050% | 0.011%(+0.040)#26 | 0.047%(+0.004)#1,350 |
| 27. | Newburgh | 0.038% | 0.011%(+0.028)#27 | 0.047%(-0.008)#1,457 |
| 28. | North Amityville | 0.034% | 0.011%(+0.024)#28 | 0.047%(-0.012)#1,491 |
| 29. | Amsterdam | 0.033% | 0.011%(+0.022)#29 | 0.047%(-0.014)#1,502 |
| 30. | West Seneca | 0.029% | 0.011%(+0.018)#30 | 0.047%(-0.018)#1,543 |
| 31. | White Plains | 0.027% | 0.011%(+0.016)#31 | 0.047%(-0.020)#1,561 |
| 32. | Central Islip | 0.025% | 0.011%(+0.014)#32 | 0.047%(-0.022)#1,584 |
| 33. | Hampton Bays | 0.024% | 0.011%(+0.013)#33 | 0.047%(-0.023)#1,590 |
| 34. | Bay Shore | 0.020% | 0.011%(+0.009)#34 | 0.047%(-0.027)#1,625 |
| 35. | Rochester | 0.012% | 0.011%(+0.002)#35 | 0.047%(-0.034)#1,709 |
| 36. | New York | 0.011% | 0.011%(+0.001)#36 | 0.047%(-0.035)#1,727 |
| 37. | Yonkers | 0.011% | 0.011%(+0.000)#37 | 0.047%(-0.036)#1,730 |
| 38. | Cheektowaga | 0.0052% | 0.011%(-0.005)#38 | 0.047%(-0.041)#1,793 |
| 39. | Syracuse | 0.0034% | 0.011%(-0.007)#39 | 0.047%(-0.043)#1,817 |
| 40. | Buffalo | 0.0014% | 0.011%(-0.009)#40 | 0.047%(-0.045)#1,833 |
1
2Common Questions
What are the Top 10 Cities with the Highest Percentage of Guamanian / Chamorro Population in New York?
Top 10 Cities with the Highest Percentage of Guamanian / Chamorro Population in New York are:
#1
5.38%
#2
2.35%
#3
1.60%
#4
0.75%
#5
0.54%
#6
0.49%
#7
0.47%
#8
0.44%
#9
0.36%
#10
0.35%
What city has the Highest Percentage of Guamanian / Chamorro Population in New York?
Laurens has the Highest Percentage of Guamanian / Chamorro Population in New York with 5.38%.
What is the Percentage of Guamanian / Chamorro Population in the State of New York?
Percentage of Guamanian / Chamorro Population in New York is 0.011%.
What is the Percentage of Guamanian / Chamorro Population in the United States?
Percentage of Guamanian / Chamorro Population in the United States is 0.047%.