Zip Codes with the Highest Percentage of Guamanian / Chamorro Population in Moraga, CA
RELATED REPORTS & OPTIONS
Guamanian / Chamorro
Moraga
Compare Zip Codes
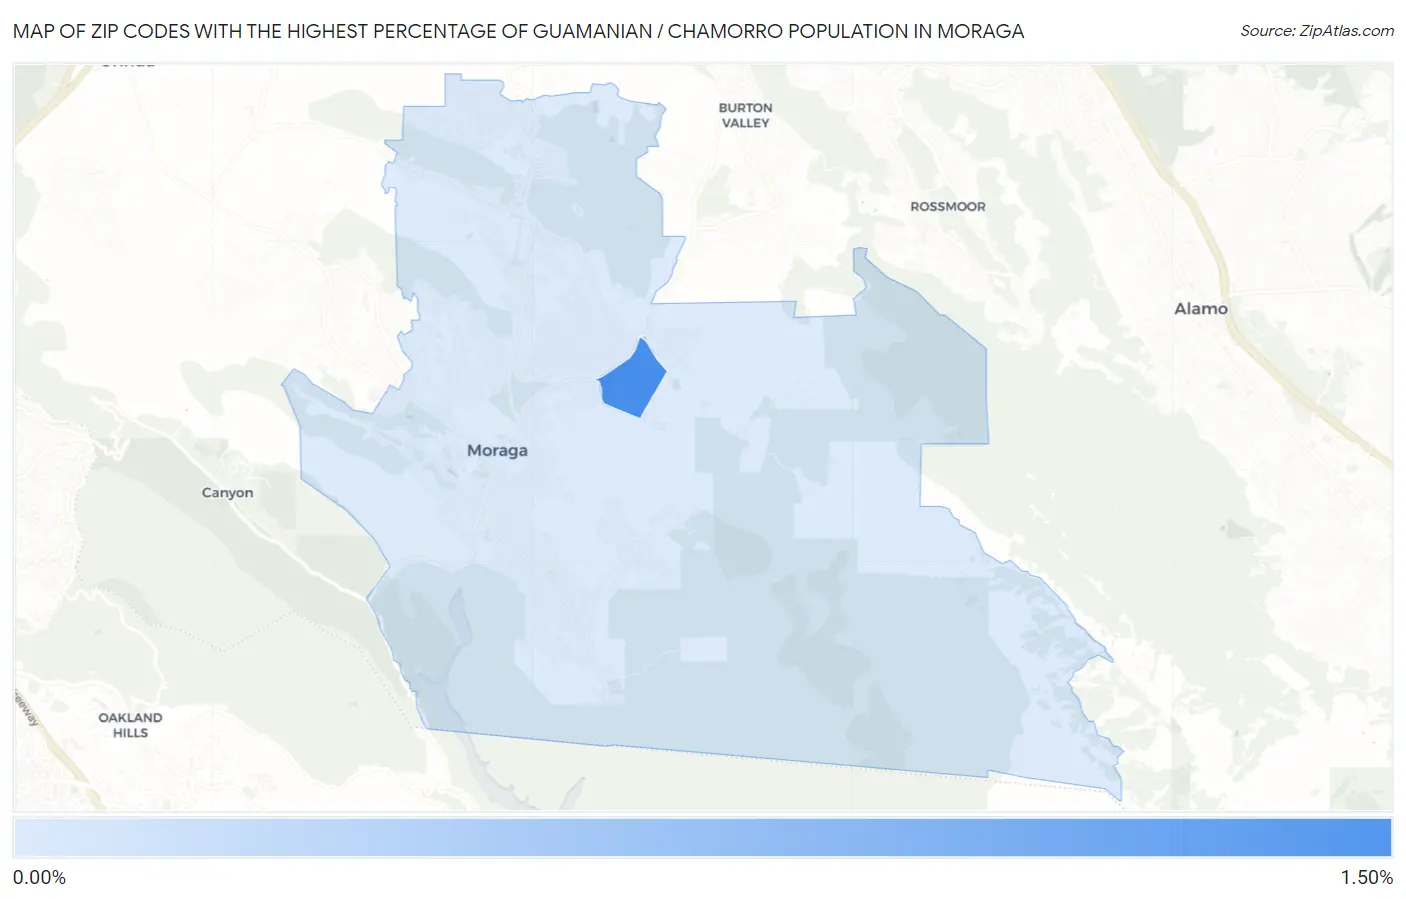
Map of Zip Codes with the Highest Percentage of Guamanian / Chamorro Population in Moraga
0.34%
1.15%
Zip Codes with the Highest Percentage of Guamanian / Chamorro Population in Moraga, CA
| Zip Code | Guamanian / Chamorro | vs State | vs National | |
| 1. | 94575 | 1.15% | 0.12%(+1.03)#19 | 0.047%(+1.10)#127 |
| 2. | 94556 | 0.34% | 0.12%(+0.228)#117 | 0.047%(+0.298)#605 |
1
Common Questions
What are the Top Zip Codes with the Highest Percentage of Guamanian / Chamorro Population in Moraga, CA?
Top Zip Codes with the Highest Percentage of Guamanian / Chamorro Population in Moraga, CA are:
What zip code has the Highest Percentage of Guamanian / Chamorro Population in Moraga, CA?
94575 has the Highest Percentage of Guamanian / Chamorro Population in Moraga, CA with 1.15%.
What is the Percentage of Guamanian / Chamorro Population in Moraga, CA?
Percentage of Guamanian / Chamorro Population in Moraga is 0.40%.
What is the Percentage of Guamanian / Chamorro Population in California?
Percentage of Guamanian / Chamorro Population in California is 0.12%.
What is the Percentage of Guamanian / Chamorro Population in the United States?
Percentage of Guamanian / Chamorro Population in the United States is 0.047%.