Cities with the Highest Percentage of Guamanian / Chamorro Population in Missouri
RELATED REPORTS & OPTIONS
Guamanian / Chamorro
Missouri
Compare Cities
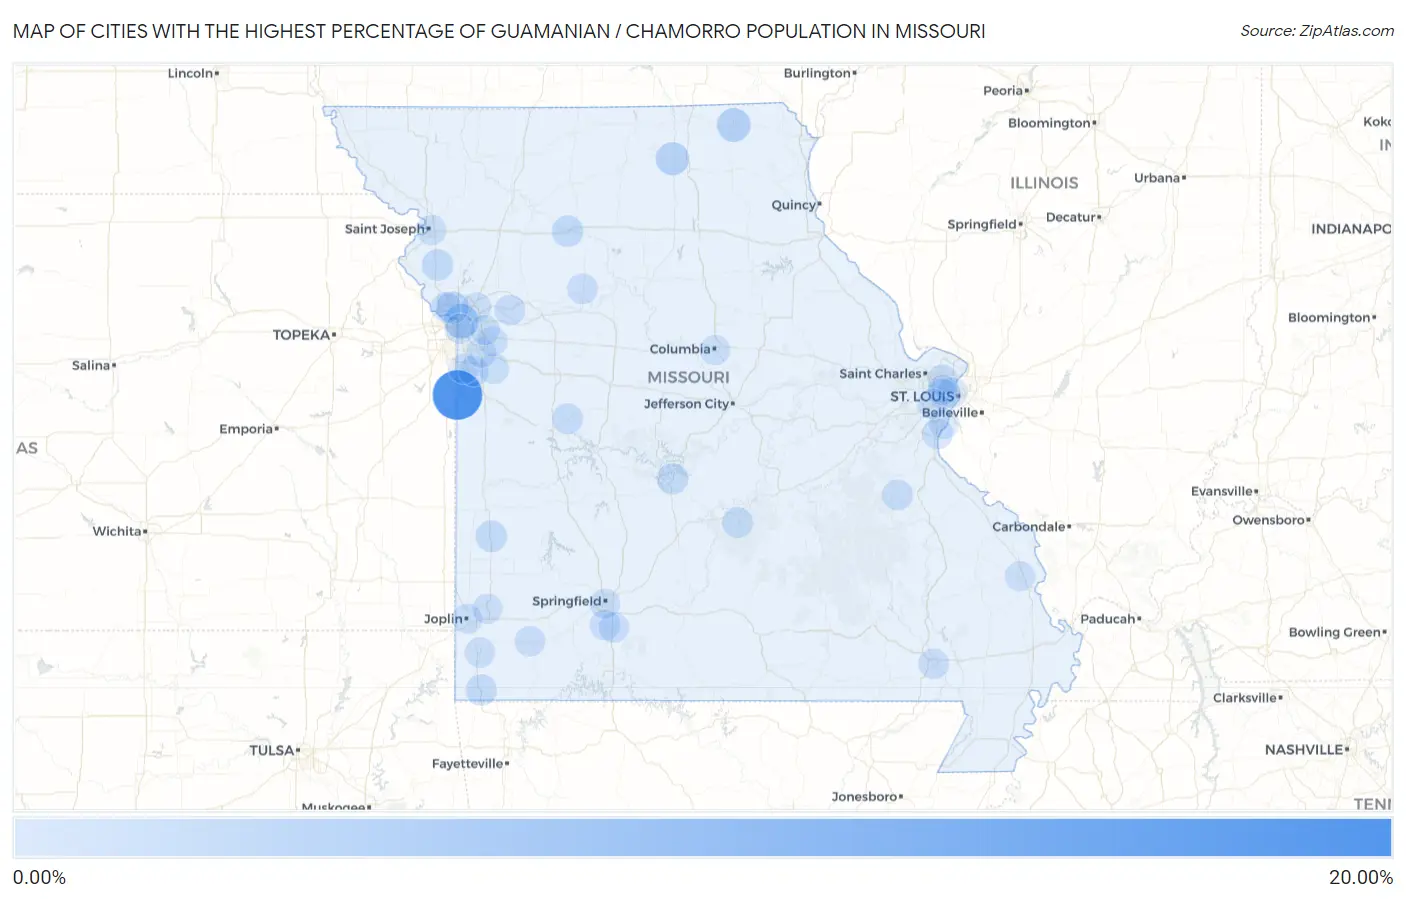
Map of Cities with the Highest Percentage of Guamanian / Chamorro Population in Missouri
0.00%
20.00%
Cities with the Highest Percentage of Guamanian / Chamorro Population in Missouri
| City | Guamanian / Chamorro | vs State | vs National | |
| 1. | West Line | 16.19% | 0.022%(+16.2)#1 | 0.047%(+16.1)#2 |
| 2. | North Kansas City | 3.45% | 0.022%(+3.43)#2 | 0.047%(+3.40)#36 |
| 3. | Memphis | 2.79% | 0.022%(+2.77)#3 | 0.047%(+2.75)#52 |
| 4. | Novinger | 2.32% | 0.022%(+2.30)#4 | 0.047%(+2.27)#69 |
| 5. | Lake Waukomis | 1.67% | 0.022%(+1.64)#5 | 0.047%(+1.62)#105 |
| 6. | Sheldon | 1.01% | 0.022%(+0.983)#6 | 0.047%(+0.958)#186 |
| 7. | Dearborn | 1.00% | 0.022%(+0.982)#7 | 0.047%(+0.957)#188 |
| 8. | Utica | 0.99% | 0.022%(+0.968)#8 | 0.047%(+0.944)#191 |
| 9. | Linn Creek | 0.81% | 0.022%(+0.788)#9 | 0.047%(+0.763)#237 |
| 10. | Pineville | 0.78% | 0.022%(+0.760)#10 | 0.047%(+0.736)#243 |
| 11. | Calhoun | 0.56% | 0.022%(+0.539)#11 | 0.047%(+0.514)#348 |
| 12. | Fort Leonard Wood | 0.53% | 0.022%(+0.503)#12 | 0.047%(+0.479)#366 |
| 13. | Mineral Point | 0.51% | 0.022%(+0.486)#13 | 0.047%(+0.461)#379 |
| 14. | Orrick | 0.38% | 0.022%(+0.359)#14 | 0.047%(+0.334)#479 |
| 15. | Kinloch | 0.34% | 0.022%(+0.322)#15 | 0.047%(+0.297)#514 |
| 16. | Carrollton | 0.32% | 0.022%(+0.297)#16 | 0.047%(+0.272)#541 |
| 17. | Nixa | 0.30% | 0.022%(+0.280)#17 | 0.047%(+0.255)#564 |
| 18. | Monett | 0.29% | 0.022%(+0.269)#18 | 0.047%(+0.244)#583 |
| 19. | Weatherby Lake | 0.25% | 0.022%(+0.226)#19 | 0.047%(+0.201)#660 |
| 20. | Poplar Bluff | 0.24% | 0.022%(+0.217)#20 | 0.047%(+0.193)#677 |
| 21. | Pleasant Hill | 0.22% | 0.022%(+0.194)#21 | 0.047%(+0.169)#723 |
| 22. | Imperial | 0.19% | 0.022%(+0.164)#22 | 0.047%(+0.139)#794 |
| 23. | Ozark | 0.16% | 0.022%(+0.141)#23 | 0.047%(+0.117)#866 |
| 24. | Raymore | 0.15% | 0.022%(+0.129)#24 | 0.047%(+0.104)#895 |
| 25. | Belton | 0.14% | 0.022%(+0.123)#25 | 0.047%(+0.098)#912 |
| 26. | Liberty | 0.12% | 0.022%(+0.100)#26 | 0.047%(+0.076)#985 |
| 27. | Lee S Summit | 0.099% | 0.022%(+0.078)#27 | 0.047%(+0.053)#1,083 |
| 28. | St Joseph | 0.096% | 0.022%(+0.074)#28 | 0.047%(+0.049)#1,097 |
| 29. | Oakville | 0.088% | 0.022%(+0.066)#29 | 0.047%(+0.041)#1,131 |
| 30. | Jackson | 0.065% | 0.022%(+0.043)#30 | 0.047%(+0.018)#1,254 |
| 31. | Neosho | 0.063% | 0.022%(+0.041)#31 | 0.047%(+0.017)#1,263 |
| 32. | Carthage | 0.045% | 0.022%(+0.024)#32 | 0.047%(-0.001)#1,394 |
| 33. | Joplin | 0.037% | 0.022%(+0.015)#33 | 0.047%(-0.010)#1,469 |
| 34. | St Louis | 0.031% | 0.022%(+0.009)#34 | 0.047%(-0.016)#1,524 |
| 35. | Columbia | 0.026% | 0.022%(+0.004)#35 | 0.047%(-0.020)#1,569 |
| 36. | Clayton | 0.023% | 0.022%(+0.002)#36 | 0.047%(-0.023)#1,597 |
| 37. | University City | 0.023% | 0.022%(+0.001)#37 | 0.047%(-0.024)#1,601 |
| 38. | Kansas City | 0.015% | 0.022%(-0.007)#38 | 0.047%(-0.032)#1,686 |
| 39. | Blue Springs | 0.012% | 0.022%(-0.010)#39 | 0.047%(-0.035)#1,718 |
| 40. | Kirkwood | 0.010% | 0.022%(-0.011)#40 | 0.047%(-0.036)#1,745 |
| 41. | Independence | 0.0090% | 0.022%(-0.013)#41 | 0.047%(-0.038)#1,754 |
| 42. | Springfield | 0.0018% | 0.022%(-0.020)#42 | 0.047%(-0.045)#1,828 |
1
2Common Questions
What are the Top 10 Cities with the Highest Percentage of Guamanian / Chamorro Population in Missouri?
Top 10 Cities with the Highest Percentage of Guamanian / Chamorro Population in Missouri are:
#1
16.19%
#2
3.45%
#3
2.79%
#4
2.32%
#5
1.67%
#6
1.01%
#7
1.00%
#8
0.99%
#9
0.81%
#10
0.78%
What city has the Highest Percentage of Guamanian / Chamorro Population in Missouri?
West Line has the Highest Percentage of Guamanian / Chamorro Population in Missouri with 16.19%.
What is the Percentage of Guamanian / Chamorro Population in the State of Missouri?
Percentage of Guamanian / Chamorro Population in Missouri is 0.022%.
What is the Percentage of Guamanian / Chamorro Population in the United States?
Percentage of Guamanian / Chamorro Population in the United States is 0.047%.