Cities with the Highest Percentage of Guamanian / Chamorro Population in Georgia
RELATED REPORTS & OPTIONS
Guamanian / Chamorro
Georgia
Compare Cities
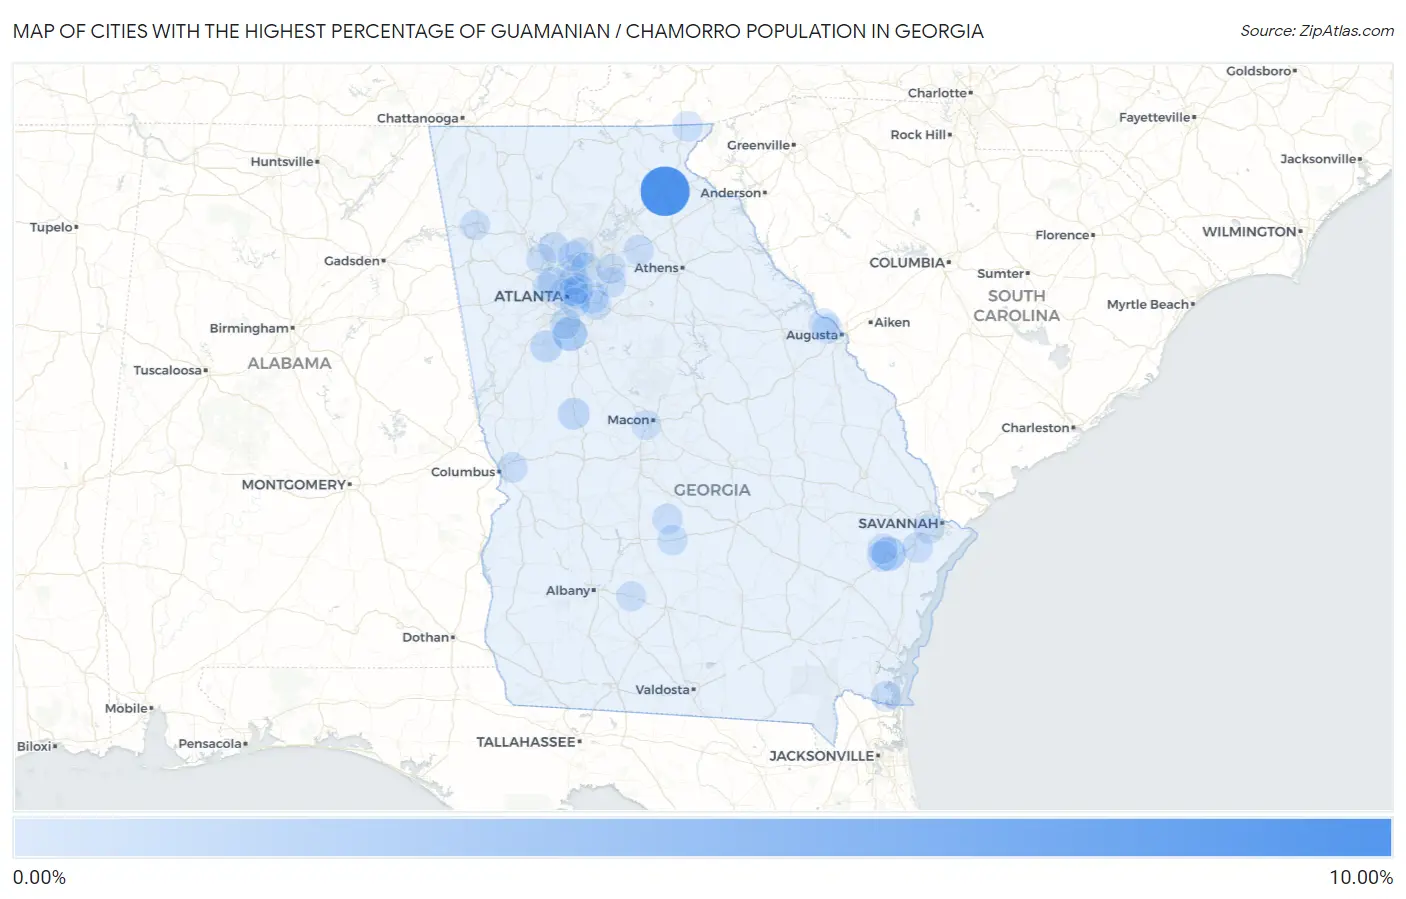
Map of Cities with the Highest Percentage of Guamanian / Chamorro Population in Georgia
0.00%
10.00%
Cities with the Highest Percentage of Guamanian / Chamorro Population in Georgia
| City | Guamanian / Chamorro | vs State | vs National | |
| 1. | Cornelia | 8.30% | 0.034%(+8.27)#1 | 0.047%(+8.26)#7 |
| 2. | Irondale | 1.76% | 0.034%(+1.72)#2 | 0.047%(+1.71)#96 |
| 3. | Flemington | 1.66% | 0.034%(+1.63)#3 | 0.047%(+1.62)#106 |
| 4. | Cusseta Chattahoochee County Unified Government | 1.02% | 0.034%(+0.987)#4 | 0.047%(+0.975)#175 |
| 5. | Peachtree City | 0.73% | 0.034%(+0.692)#5 | 0.047%(+0.680)#269 |
| 6. | Thomaston | 0.70% | 0.034%(+0.665)#6 | 0.047%(+0.653)#280 |
| 7. | Redan | 0.62% | 0.034%(+0.585)#7 | 0.047%(+0.573)#318 |
| 8. | Hinesville | 0.32% | 0.034%(+0.288)#8 | 0.047%(+0.276)#536 |
| 9. | Riverdale | 0.28% | 0.034%(+0.247)#9 | 0.047%(+0.235)#597 |
| 10. | Richmond Hill | 0.21% | 0.034%(+0.175)#10 | 0.047%(+0.163)#735 |
| 11. | St Marys | 0.17% | 0.034%(+0.139)#11 | 0.047%(+0.126)#834 |
| 12. | Sky Valley | 0.17% | 0.034%(+0.133)#12 | 0.047%(+0.120)#852 |
| 13. | Pineview | 0.16% | 0.034%(+0.130)#13 | 0.047%(+0.118)#860 |
| 14. | Hoschton | 0.13% | 0.034%(+0.095)#14 | 0.047%(+0.083)#955 |
| 15. | Smyrna | 0.11% | 0.034%(+0.080)#15 | 0.047%(+0.068)#1,015 |
| 16. | Columbus | 0.11% | 0.034%(+0.079)#16 | 0.047%(+0.067)#1,019 |
| 17. | Evans | 0.11% | 0.034%(+0.075)#17 | 0.047%(+0.063)#1,045 |
| 18. | Rochelle | 0.10% | 0.034%(+0.067)#18 | 0.047%(+0.054)#1,074 |
| 19. | Fort Stewart | 0.086% | 0.034%(+0.052)#19 | 0.047%(+0.039)#1,143 |
| 20. | Woodstock | 0.080% | 0.034%(+0.045)#20 | 0.047%(+0.033)#1,174 |
| 21. | Decatur | 0.066% | 0.034%(+0.031)#21 | 0.047%(+0.019)#1,245 |
| 22. | Kennesaw | 0.060% | 0.034%(+0.026)#22 | 0.047%(+0.013)#1,285 |
| 23. | Rome | 0.058% | 0.034%(+0.024)#23 | 0.047%(+0.012)#1,296 |
| 24. | Sylvester | 0.053% | 0.034%(+0.019)#24 | 0.047%(+0.007)#1,329 |
| 25. | Martinez | 0.050% | 0.034%(+0.016)#25 | 0.047%(+0.004)#1,351 |
| 26. | Stonecrest | 0.039% | 0.034%(+0.005)#26 | 0.047%(-0.008)#1,450 |
| 27. | Brookhaven | 0.030% | 0.034%(-0.004)#27 | 0.047%(-0.017)#1,531 |
| 28. | Savannah | 0.030% | 0.034%(-0.004)#28 | 0.047%(-0.017)#1,533 |
| 29. | Augusta-Richmond County Consolidated Government (Balance) | 0.027% | 0.034%(-0.007)#29 | 0.047%(-0.019)#1,557 |
| 30. | Atlanta | 0.019% | 0.034%(-0.015)#30 | 0.047%(-0.027)#1,628 |
| 31. | Sandy Springs | 0.019% | 0.034%(-0.015)#31 | 0.047%(-0.028)#1,638 |
| 32. | Macon Bibb County | 0.018% | 0.034%(-0.016)#32 | 0.047%(-0.029)#1,650 |
| 33. | North Decatur | 0.017% | 0.034%(-0.017)#33 | 0.047%(-0.029)#1,656 |
| 34. | Mableton | 0.014% | 0.034%(-0.020)#34 | 0.047%(-0.032)#1,692 |
| 35. | Gresham Park | 0.013% | 0.034%(-0.021)#35 | 0.047%(-0.034)#1,704 |
| 36. | Roswell | 0.012% | 0.034%(-0.022)#36 | 0.047%(-0.035)#1,719 |
| 37. | Druid Hills | 0.012% | 0.034%(-0.022)#37 | 0.047%(-0.035)#1,720 |
| 38. | Alpharetta | 0.011% | 0.034%(-0.024)#38 | 0.047%(-0.036)#1,736 |
| 39. | Snellville | 0.0048% | 0.034%(-0.029)#39 | 0.047%(-0.042)#1,797 |
| 40. | Peachtree Corners | 0.0047% | 0.034%(-0.029)#40 | 0.047%(-0.042)#1,800 |
| 41. | Lawrenceville | 0.0033% | 0.034%(-0.031)#41 | 0.047%(-0.043)#1,818 |
1
2Common Questions
What are the Top 10 Cities with the Highest Percentage of Guamanian / Chamorro Population in Georgia?
Top 10 Cities with the Highest Percentage of Guamanian / Chamorro Population in Georgia are:
#1
8.30%
#2
1.76%
#3
1.66%
#4
0.73%
#5
0.70%
#6
0.62%
#7
0.32%
#8
0.28%
#9
0.21%
#10
0.17%
What city has the Highest Percentage of Guamanian / Chamorro Population in Georgia?
Cornelia has the Highest Percentage of Guamanian / Chamorro Population in Georgia with 8.30%.
What is the Percentage of Guamanian / Chamorro Population in the State of Georgia?
Percentage of Guamanian / Chamorro Population in Georgia is 0.034%.
What is the Percentage of Guamanian / Chamorro Population in the United States?
Percentage of Guamanian / Chamorro Population in the United States is 0.047%.