Cities with the Highest Percentage of Population Employed in Education, Arts & Media in Virginia
RELATED REPORTS & OPTIONS
Education, Arts & Media
Virginia
Compare Cities
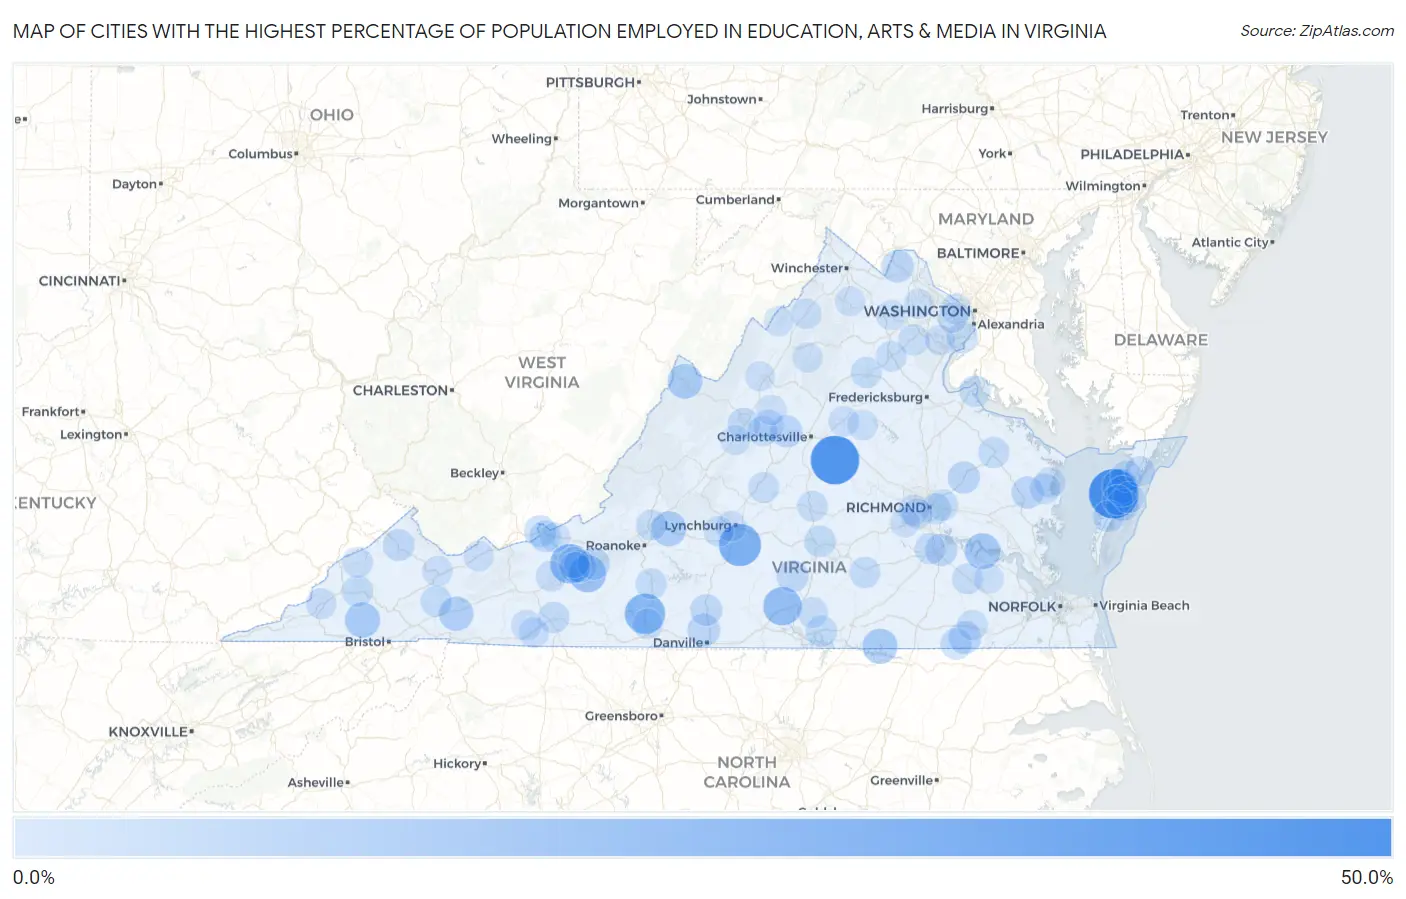
Map of Cities with the Highest Percentage of Population Employed in Education, Arts & Media in Virginia
0.0%
50.0%
Cities with the Highest Percentage of Population Employed in Education, Arts & Media in Virginia
| City | % Employed | vs State | vs National | |
| 1. | Pungoteague | 43.8% | 1.9%(+41.9)#1 | 1.8%(+42.0)#60 |
| 2. | Palmyra | 41.6% | 1.9%(+39.7)#2 | 1.8%(+39.8)#66 |
| 3. | Rustburg | 27.7% | 1.9%(+25.8)#3 | 1.8%(+25.9)#125 |
| 4. | Oak Level | 24.0% | 1.9%(+22.1)#4 | 1.8%(+22.2)#155 |
| 5. | New River | 22.4% | 1.9%(+20.5)#5 | 1.8%(+20.6)#173 |
| 6. | Clover | 20.2% | 1.9%(+18.3)#6 | 1.8%(+18.4)#204 |
| 7. | Riner | 17.5% | 1.9%(+15.6)#7 | 1.8%(+15.7)#261 |
| 8. | Camp Barrett | 16.7% | 1.9%(+14.8)#8 | 1.8%(+14.9)#283 |
| 9. | Claremont | 14.8% | 1.9%(+12.9)#9 | 1.8%(+13.0)#343 |
| 10. | Nickelsville | 13.4% | 1.9%(+11.5)#10 | 1.8%(+11.6)#399 |
| 11. | Savageville | 13.3% | 1.9%(+11.4)#11 | 1.8%(+11.5)#406 |
| 12. | Gasburg | 13.0% | 1.9%(+11.1)#12 | 1.8%(+11.2)#421 |
| 13. | Montvale | 12.8% | 1.9%(+10.9)#13 | 1.8%(+11.0)#435 |
| 14. | Monterey | 12.5% | 1.9%(+10.6)#14 | 1.8%(+10.7)#447 |
| 15. | Adwolf | 11.5% | 1.9%(+9.65)#15 | 1.8%(+9.75)#500 |
| 16. | Mount Hermon | 8.2% | 1.9%(+6.29)#16 | 1.8%(+6.40)#933 |
| 17. | Plum Creek | 8.1% | 1.9%(+6.19)#17 | 1.8%(+6.30)#955 |
| 18. | Hillsboro | 8.0% | 1.9%(+6.11)#18 | 1.8%(+6.21)#976 |
| 19. | Newsoms | 7.7% | 1.9%(+5.84)#19 | 1.8%(+5.95)#1,028 |
| 20. | Crozet | 7.6% | 1.9%(+5.67)#20 | 1.8%(+5.77)#1,078 |
| 21. | Quinby | 7.3% | 1.9%(+5.45)#21 | 1.8%(+5.55)#1,139 |
| 22. | Fort Lee | 7.3% | 1.9%(+5.37)#22 | 1.8%(+5.47)#1,155 |
| 23. | Urbanna | 7.2% | 1.9%(+5.32)#23 | 1.8%(+5.43)#1,168 |
| 24. | Central Garage | 7.2% | 1.9%(+5.27)#24 | 1.8%(+5.38)#1,177 |
| 25. | Christiansburg | 6.9% | 1.9%(+5.02)#25 | 1.8%(+5.12)#1,264 |
| 26. | Charlotte Court House | 6.8% | 1.9%(+4.90)#26 | 1.8%(+5.00)#1,302 |
| 27. | Grundy | 6.8% | 1.9%(+4.89)#27 | 1.8%(+4.99)#1,308 |
| 28. | Chatham | 6.8% | 1.9%(+4.87)#28 | 1.8%(+4.97)#1,315 |
| 29. | Jolivue | 6.7% | 1.9%(+4.84)#29 | 1.8%(+4.95)#1,327 |
| 30. | Glen Lyn | 6.7% | 1.9%(+4.77)#30 | 1.8%(+4.88)#1,357 |
| 31. | Moorefield | 6.3% | 1.9%(+4.38)#31 | 1.8%(+4.48)#1,519 |
| 32. | Boydton | 5.9% | 1.9%(+3.99)#32 | 1.8%(+4.10)#1,689 |
| 33. | Nassawadox | 5.9% | 1.9%(+3.96)#33 | 1.8%(+4.07)#1,708 |
| 34. | Farmville | 5.8% | 1.9%(+3.95)#34 | 1.8%(+4.06)#1,712 |
| 35. | Narrows | 5.8% | 1.9%(+3.94)#35 | 1.8%(+4.05)#1,716 |
| 36. | Bayside | 5.8% | 1.9%(+3.90)#36 | 1.8%(+4.01)#1,733 |
| 37. | Keezletown | 5.7% | 1.9%(+3.82)#37 | 1.8%(+3.93)#1,769 |
| 38. | Boykins | 5.7% | 1.9%(+3.80)#38 | 1.8%(+3.90)#1,780 |
| 39. | Hillsville | 5.6% | 1.9%(+3.72)#39 | 1.8%(+3.83)#1,824 |
| 40. | Saltville | 5.5% | 1.9%(+3.64)#40 | 1.8%(+3.75)#1,877 |
| 41. | Dahlgren Center | 5.5% | 1.9%(+3.59)#41 | 1.8%(+3.69)#1,901 |
| 42. | Mcgaheysville | 5.4% | 1.9%(+3.55)#42 | 1.8%(+3.66)#1,927 |
| 43. | Coeburn | 5.4% | 1.9%(+3.47)#43 | 1.8%(+3.58)#1,980 |
| 44. | Fort Belvoir | 5.4% | 1.9%(+3.47)#44 | 1.8%(+3.58)#1,982 |
| 45. | Earlysville | 5.3% | 1.9%(+3.39)#45 | 1.8%(+3.49)#2,037 |
| 46. | Blackstone | 5.2% | 1.9%(+3.27)#46 | 1.8%(+3.38)#2,123 |
| 47. | Wachapreague | 5.1% | 1.9%(+3.21)#47 | 1.8%(+3.32)#2,168 |
| 48. | Highland Springs | 5.1% | 1.9%(+3.18)#48 | 1.8%(+3.29)#2,198 |
| 49. | Tappahannock | 5.0% | 1.9%(+3.13)#49 | 1.8%(+3.23)#2,233 |
| 50. | Fairlawn | 5.0% | 1.9%(+3.11)#50 | 1.8%(+3.21)#2,250 |
| 51. | Culpeper | 4.9% | 1.9%(+3.02)#51 | 1.8%(+3.13)#2,323 |
| 52. | Rocky Mount | 4.9% | 1.9%(+2.99)#52 | 1.8%(+3.10)#2,351 |
| 53. | Nokesville | 4.8% | 1.9%(+2.89)#53 | 1.8%(+3.00)#2,441 |
| 54. | Kilmarnock | 4.8% | 1.9%(+2.88)#54 | 1.8%(+2.99)#2,445 |
| 55. | Arrington | 4.8% | 1.9%(+2.86)#55 | 1.8%(+2.97)#2,462 |
| 56. | Pulaski | 4.7% | 1.9%(+2.79)#56 | 1.8%(+2.90)#2,536 |
| 57. | Troutville | 4.7% | 1.9%(+2.76)#57 | 1.8%(+2.87)#2,566 |
| 58. | Irvington | 4.6% | 1.9%(+2.72)#58 | 1.8%(+2.83)#2,611 |
| 59. | Dillwyn | 4.6% | 1.9%(+2.72)#59 | 1.8%(+2.82)#2,618 |
| 60. | Montrose | 4.6% | 1.9%(+2.71)#60 | 1.8%(+2.82)#2,622 |
| 61. | Big Stone Gap | 4.6% | 1.9%(+2.70)#61 | 1.8%(+2.81)#2,640 |
| 62. | Chase City | 4.6% | 1.9%(+2.69)#62 | 1.8%(+2.79)#2,652 |
| 63. | Ettrick | 4.6% | 1.9%(+2.69)#63 | 1.8%(+2.79)#2,653 |
| 64. | Radford | 4.5% | 1.9%(+2.58)#64 | 1.8%(+2.69)#2,766 |
| 65. | Bon Air | 4.4% | 1.9%(+2.53)#65 | 1.8%(+2.64)#2,808 |
| 66. | Waverly | 4.3% | 1.9%(+2.44)#66 | 1.8%(+2.55)#2,896 |
| 67. | Melfa | 4.3% | 1.9%(+2.43)#67 | 1.8%(+2.54)#2,902 |
| 68. | Dooms | 4.3% | 1.9%(+2.42)#68 | 1.8%(+2.53)#2,907 |
| 69. | Bealeton | 4.3% | 1.9%(+2.36)#69 | 1.8%(+2.47)#2,982 |
| 70. | Pimmit Hills | 4.2% | 1.9%(+2.34)#70 | 1.8%(+2.45)#3,004 |
| 71. | Clintwood | 4.2% | 1.9%(+2.26)#71 | 1.8%(+2.37)#3,099 |
| 72. | Gordonsville | 4.0% | 1.9%(+2.14)#72 | 1.8%(+2.25)#3,280 |
| 73. | Waynesboro | 4.0% | 1.9%(+2.06)#73 | 1.8%(+2.17)#3,387 |
| 74. | Blue Ridge Shores | 3.9% | 1.9%(+2.02)#74 | 1.8%(+2.12)#3,449 |
| 75. | Lynchburg | 3.9% | 1.9%(+1.98)#75 | 1.8%(+2.09)#3,506 |
| 76. | Cedar Bluff | 3.8% | 1.9%(+1.91)#76 | 1.8%(+2.01)#3,621 |
| 77. | Fries | 3.8% | 1.9%(+1.88)#77 | 1.8%(+1.99)#3,662 |
| 78. | Collinsville | 3.8% | 1.9%(+1.87)#78 | 1.8%(+1.98)#3,687 |
| 79. | Manchester | 3.7% | 1.9%(+1.85)#79 | 1.8%(+1.96)#3,713 |
| 80. | Courtland | 3.7% | 1.9%(+1.85)#80 | 1.8%(+1.95)#3,723 |
| 81. | Woodstock | 3.7% | 1.9%(+1.84)#81 | 1.8%(+1.95)#3,728 |
| 82. | Springville | 3.7% | 1.9%(+1.83)#82 | 1.8%(+1.94)#3,743 |
| 83. | Gargatha | 3.7% | 1.9%(+1.81)#83 | 1.8%(+1.92)#3,769 |
| 84. | Forest | 3.6% | 1.9%(+1.71)#84 | 1.8%(+1.82)#3,939 |
| 85. | Galax | 3.6% | 1.9%(+1.68)#85 | 1.8%(+1.79)#3,990 |
| 86. | County Center | 3.5% | 1.9%(+1.65)#86 | 1.8%(+1.76)#4,054 |
| 87. | Harriston | 3.5% | 1.9%(+1.57)#87 | 1.8%(+1.68)#4,204 |
| 88. | Basye | 3.4% | 1.9%(+1.54)#88 | 1.8%(+1.65)#4,261 |
| 89. | Brandermill | 3.4% | 1.9%(+1.47)#89 | 1.8%(+1.58)#4,398 |
| 90. | Midlothian | 3.4% | 1.9%(+1.47)#90 | 1.8%(+1.58)#4,399 |
| 91. | The Plains | 3.4% | 1.9%(+1.46)#91 | 1.8%(+1.57)#4,419 |
| 92. | Woodburn | 3.3% | 1.9%(+1.40)#92 | 1.8%(+1.51)#4,534 |
| 93. | Arcola | 3.3% | 1.9%(+1.40)#93 | 1.8%(+1.51)#4,539 |
| 94. | Belmont Estates | 3.2% | 1.9%(+1.36)#94 | 1.8%(+1.46)#4,621 |
| 95. | Greenville | 3.2% | 1.9%(+1.35)#95 | 1.8%(+1.46)#4,623 |
| 96. | Painter | 3.2% | 1.9%(+1.33)#96 | 1.8%(+1.44)#4,671 |
| 97. | Pearisburg | 3.2% | 1.9%(+1.30)#97 | 1.8%(+1.40)#4,760 |
| 98. | Stanley | 3.2% | 1.9%(+1.27)#98 | 1.8%(+1.38)#4,815 |
| 99. | Dendron | 3.1% | 1.9%(+1.26)#99 | 1.8%(+1.36)#4,859 |
| 100. | Shenandoah Shores | 3.1% | 1.9%(+1.25)#100 | 1.8%(+1.36)#4,877 |
Common Questions
What are the Top 10 Cities with the Highest Percentage of Population Employed in Education, Arts & Media in Virginia?
Top 10 Cities with the Highest Percentage of Population Employed in Education, Arts & Media in Virginia are:
#1
43.8%
#2
41.6%
#3
27.7%
#4
24.0%
#5
22.4%
#6
20.2%
#7
17.5%
#8
14.8%
#9
13.4%
#10
13.3%
What city has the Highest Percentage of Population Employed in Education, Arts & Media in Virginia?
Pungoteague has the Highest Percentage of Population Employed in Education, Arts & Media in Virginia with 43.8%.
What is the Percentage of Population Employed in Education, Arts & Media in the State of Virginia?
Percentage of Population Employed in Education, Arts & Media in Virginia is 1.9%.
What is the Percentage of Population Employed in Education, Arts & Media in the United States?
Percentage of Population Employed in Education, Arts & Media in the United States is 1.8%.