Cities with the Highest Percentage of Population Employed in Education, Arts & Media in Maryland
RELATED REPORTS & OPTIONS
Education, Arts & Media
Maryland
Compare Cities
Map of Cities with the Highest Percentage of Population Employed in Education, Arts & Media in Maryland
0.0%
40.0%
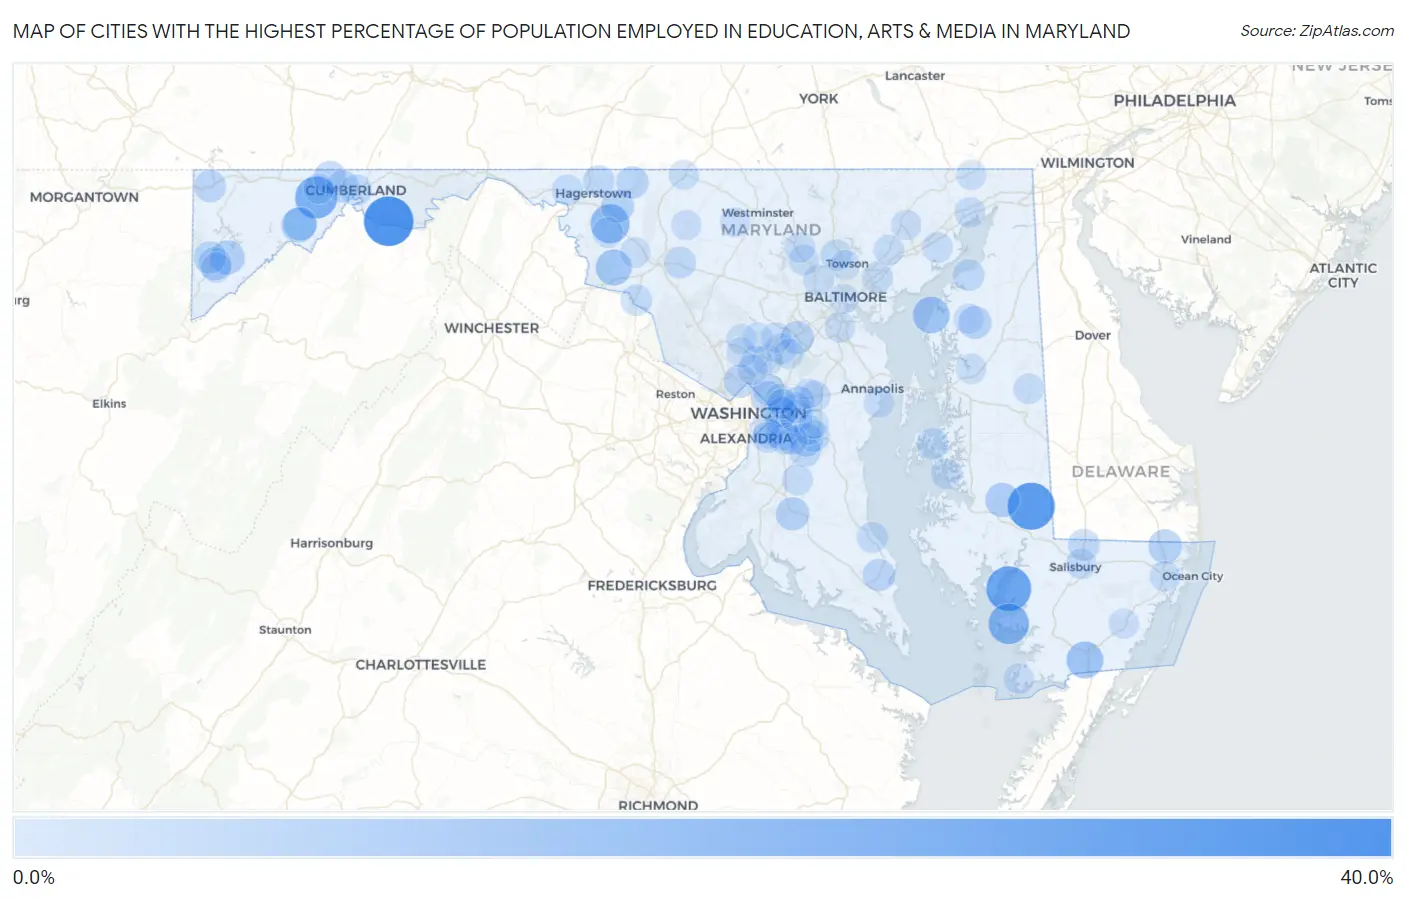
Cities with the Highest Percentage of Population Employed in Education, Arts & Media in Maryland
| City | % Employed | vs State | vs National | |
| 1. | Oldtown | 32.4% | 1.9%(+30.5)#1 | 1.8%(+30.6)#100 |
| 2. | Brookview | 28.6% | 1.9%(+26.6)#2 | 1.8%(+26.8)#121 |
| 3. | Jesterville | 25.0% | 1.9%(+23.1)#3 | 1.8%(+23.2)#142 |
| 4. | Shaft | 20.8% | 1.9%(+18.9)#4 | 1.8%(+19.0)#197 |
| 5. | Dames Quarter | 18.3% | 1.9%(+16.4)#5 | 1.8%(+16.5)#243 |
| 6. | Mapleville | 16.1% | 1.9%(+14.1)#6 | 1.8%(+14.3)#306 |
| 7. | Pocomoke City | 12.5% | 1.9%(+10.6)#7 | 1.8%(+10.7)#443 |
| 8. | Graceham | 12.5% | 1.9%(+10.6)#8 | 1.8%(+10.7)#446 |
| 9. | Tolchester | 12.3% | 1.9%(+10.3)#9 | 1.8%(+10.5)#467 |
| 10. | Burkittsville | 11.3% | 1.9%(+9.35)#10 | 1.8%(+9.48)#524 |
| 11. | Barton | 9.6% | 1.9%(+7.63)#11 | 1.8%(+7.76)#690 |
| 12. | Crumpton | 9.5% | 1.9%(+7.54)#12 | 1.8%(+7.67)#706 |
| 13. | East New Market | 8.8% | 1.9%(+6.87)#13 | 1.8%(+7.01)#811 |
| 14. | Deer Park | 8.7% | 1.9%(+6.74)#14 | 1.8%(+6.88)#836 |
| 15. | Bishopville | 8.1% | 1.9%(+6.15)#15 | 1.8%(+6.28)#961 |
| 16. | Moscow | 7.6% | 1.9%(+5.66)#16 | 1.8%(+5.80)#1,070 |
| 17. | Bryantown | 7.4% | 1.9%(+5.47)#17 | 1.8%(+5.61)#1,130 |
| 18. | Queensland | 7.3% | 1.9%(+5.36)#18 | 1.8%(+5.49)#1,150 |
| 19. | Morningside | 7.2% | 1.9%(+5.32)#19 | 1.8%(+5.46)#1,157 |
| 20. | Seat Pleasant | 6.9% | 1.9%(+5.00)#20 | 1.8%(+5.14)#1,260 |
| 21. | Savage | 6.9% | 1.9%(+4.99)#21 | 1.8%(+5.13)#1,263 |
| 22. | Kingstown | 6.9% | 1.9%(+4.96)#22 | 1.8%(+5.10)#1,277 |
| 23. | Mount Aetna | 6.7% | 1.9%(+4.81)#23 | 1.8%(+4.94)#1,328 |
| 24. | Mountain Lake Park | 6.7% | 1.9%(+4.78)#24 | 1.8%(+4.92)#1,337 |
| 25. | Mount Savage | 6.7% | 1.9%(+4.77)#25 | 1.8%(+4.91)#1,340 |
| 26. | Brentwood | 6.6% | 1.9%(+4.67)#26 | 1.8%(+4.81)#1,383 |
| 27. | North Chevy Chase | 6.4% | 1.9%(+4.51)#27 | 1.8%(+4.64)#1,457 |
| 28. | Largo | 6.4% | 1.9%(+4.44)#28 | 1.8%(+4.58)#1,488 |
| 29. | Edgemont | 6.2% | 1.9%(+4.24)#29 | 1.8%(+4.38)#1,572 |
| 30. | Solomons | 6.1% | 1.9%(+4.19)#30 | 1.8%(+4.33)#1,591 |
| 31. | Oakland | 5.9% | 1.9%(+3.93)#31 | 1.8%(+4.07)#1,709 |
| 32. | Friendsville | 5.6% | 1.9%(+3.72)#32 | 1.8%(+3.85)#1,808 |
| 33. | La Vale | 5.6% | 1.9%(+3.68)#33 | 1.8%(+3.82)#1,833 |
| 34. | Mitchellville | 5.4% | 1.9%(+3.43)#34 | 1.8%(+3.57)#1,990 |
| 35. | Brown Station | 5.3% | 1.9%(+3.40)#35 | 1.8%(+3.53)#2,004 |
| 36. | University Park | 5.3% | 1.9%(+3.37)#36 | 1.8%(+3.50)#2,028 |
| 37. | Paramount Long Meadow | 5.0% | 1.9%(+3.09)#37 | 1.8%(+3.23)#2,240 |
| 38. | Spring Ridge | 5.0% | 1.9%(+3.08)#38 | 1.8%(+3.22)#2,246 |
| 39. | Delmar | 5.0% | 1.9%(+3.08)#39 | 1.8%(+3.21)#2,247 |
| 40. | Betterton | 5.0% | 1.9%(+3.08)#40 | 1.8%(+3.21)#2,260 |
| 41. | Andrews Afb | 5.0% | 1.9%(+3.03)#41 | 1.8%(+3.17)#2,294 |
| 42. | Marlton | 4.9% | 1.9%(+2.95)#42 | 1.8%(+3.08)#2,372 |
| 43. | Mays Chapel | 4.7% | 1.9%(+2.77)#43 | 1.8%(+2.90)#2,521 |
| 44. | Cumberland | 4.4% | 1.9%(+2.51)#44 | 1.8%(+2.65)#2,799 |
| 45. | St Michaels | 4.4% | 1.9%(+2.50)#45 | 1.8%(+2.64)#2,807 |
| 46. | Upper Marlboro | 4.3% | 1.9%(+2.41)#46 | 1.8%(+2.54)#2,897 |
| 47. | Point Of Rocks | 4.3% | 1.9%(+2.41)#47 | 1.8%(+2.54)#2,898 |
| 48. | St Leonard | 4.3% | 1.9%(+2.33)#48 | 1.8%(+2.47)#2,973 |
| 49. | Rossville | 4.2% | 1.9%(+2.24)#49 | 1.8%(+2.38)#3,093 |
| 50. | Wilson Conococheague | 4.1% | 1.9%(+2.22)#50 | 1.8%(+2.36)#3,114 |
| 51. | Cedarville | 3.7% | 1.9%(+1.82)#51 | 1.8%(+1.96)#3,715 |
| 52. | Lochearn | 3.7% | 1.9%(+1.76)#52 | 1.8%(+1.90)#3,805 |
| 53. | Bowie | 3.7% | 1.9%(+1.74)#53 | 1.8%(+1.88)#3,840 |
| 54. | Colesville | 3.6% | 1.9%(+1.73)#54 | 1.8%(+1.86)#3,859 |
| 55. | Peppermill Village | 3.6% | 1.9%(+1.72)#55 | 1.8%(+1.86)#3,874 |
| 56. | Honeygo | 3.6% | 1.9%(+1.65)#56 | 1.8%(+1.79)#3,999 |
| 57. | Ferndale | 3.5% | 1.9%(+1.62)#57 | 1.8%(+1.75)#4,061 |
| 58. | Hillcrest Heights | 3.5% | 1.9%(+1.61)#58 | 1.8%(+1.74)#4,083 |
| 59. | West Laurel | 3.5% | 1.9%(+1.60)#59 | 1.8%(+1.74)#4,086 |
| 60. | Kingsville | 3.5% | 1.9%(+1.55)#60 | 1.8%(+1.69)#4,176 |
| 61. | Greensboro | 3.5% | 1.9%(+1.53)#61 | 1.8%(+1.67)#4,216 |
| 62. | Perryman | 3.5% | 1.9%(+1.53)#62 | 1.8%(+1.67)#4,218 |
| 63. | Owings Mills | 3.4% | 1.9%(+1.48)#63 | 1.8%(+1.62)#4,325 |
| 64. | Fairland | 3.4% | 1.9%(+1.46)#64 | 1.8%(+1.60)#4,364 |
| 65. | Oxford | 3.3% | 1.9%(+1.41)#65 | 1.8%(+1.55)#4,446 |
| 66. | Perryville | 3.3% | 1.9%(+1.40)#66 | 1.8%(+1.53)#4,480 |
| 67. | Berlin | 3.3% | 1.9%(+1.40)#67 | 1.8%(+1.53)#4,481 |
| 68. | Reisterstown | 3.3% | 1.9%(+1.40)#68 | 1.8%(+1.53)#4,482 |
| 69. | Salisbury | 3.3% | 1.9%(+1.36)#69 | 1.8%(+1.50)#4,547 |
| 70. | Temple Hills | 3.3% | 1.9%(+1.36)#70 | 1.8%(+1.50)#4,550 |
| 71. | Loch Lynn Heights | 3.3% | 1.9%(+1.36)#71 | 1.8%(+1.49)#4,564 |
| 72. | Highland Beach | 3.2% | 1.9%(+1.30)#72 | 1.8%(+1.44)#4,678 |
| 73. | Bel Air | 3.2% | 1.9%(+1.26)#73 | 1.8%(+1.40)#4,766 |
| 74. | Boonsboro | 3.2% | 1.9%(+1.25)#74 | 1.8%(+1.38)#4,813 |
| 75. | Crisfield | 3.2% | 1.9%(+1.24)#75 | 1.8%(+1.38)#4,820 |
| 76. | Marlow Heights | 3.1% | 1.9%(+1.22)#76 | 1.8%(+1.36)#4,875 |
| 77. | Fulton | 3.1% | 1.9%(+1.16)#77 | 1.8%(+1.30)#5,018 |
| 78. | Middletown | 3.1% | 1.9%(+1.13)#78 | 1.8%(+1.27)#5,080 |
| 79. | Lake Arbor | 3.0% | 1.9%(+1.13)#79 | 1.8%(+1.26)#5,109 |
| 80. | Woodsboro | 3.0% | 1.9%(+1.09)#80 | 1.8%(+1.23)#5,199 |
| 81. | Chestertown | 2.9% | 1.9%(+1.02)#81 | 1.8%(+1.16)#5,387 |
| 82. | Snow Hill | 2.9% | 1.9%(+1.01)#82 | 1.8%(+1.14)#5,437 |
| 83. | Centreville | 2.9% | 1.9%(+0.993)#83 | 1.8%(+1.13)#5,484 |
| 84. | New Windsor | 2.9% | 1.9%(+0.979)#84 | 1.8%(+1.11)#5,535 |
| 85. | Fairwood | 2.9% | 1.9%(+0.967)#85 | 1.8%(+1.10)#5,579 |
| 86. | Frostburg | 2.9% | 1.9%(+0.960)#86 | 1.8%(+1.10)#5,599 |
| 87. | Emmitsburg | 2.9% | 1.9%(+0.949)#87 | 1.8%(+1.09)#5,624 |
| 88. | Rising Sun | 2.9% | 1.9%(+0.946)#88 | 1.8%(+1.08)#5,634 |
| 89. | Kemp Mill | 2.7% | 1.9%(+0.787)#89 | 1.8%(+0.923)#6,133 |
| 90. | Laurel | 2.7% | 1.9%(+0.778)#90 | 1.8%(+0.914)#6,174 |
| 91. | Olney | 2.7% | 1.9%(+0.760)#91 | 1.8%(+0.896)#6,226 |
| 92. | Marlboro Village | 2.7% | 1.9%(+0.756)#92 | 1.8%(+0.892)#6,239 |
| 93. | Baltimore | 2.7% | 1.9%(+0.739)#93 | 1.8%(+0.875)#6,308 |
| 94. | Towson | 2.6% | 1.9%(+0.708)#94 | 1.8%(+0.844)#6,418 |
| 95. | Leisure World | 2.6% | 1.9%(+0.680)#95 | 1.8%(+0.817)#6,510 |
| 96. | Ashton Sandy Spring | 2.6% | 1.9%(+0.663)#96 | 1.8%(+0.800)#6,575 |
| 97. | Landover Hills | 2.6% | 1.9%(+0.662)#97 | 1.8%(+0.798)#6,577 |
| 98. | Brock Hall | 2.6% | 1.9%(+0.662)#98 | 1.8%(+0.798)#6,578 |
| 99. | Landover | 2.6% | 1.9%(+0.648)#99 | 1.8%(+0.784)#6,630 |
| 100. | Melwood | 2.5% | 1.9%(+0.605)#100 | 1.8%(+0.741)#6,791 |
Common Questions
What are the Top 10 Cities with the Highest Percentage of Population Employed in Education, Arts & Media in Maryland?
Top 10 Cities with the Highest Percentage of Population Employed in Education, Arts & Media in Maryland are:
#1
32.4%
#2
28.6%
#3
25.0%
#4
20.8%
#5
18.3%
#6
16.1%
#7
12.5%
#8
12.3%
#9
11.3%
#10
9.6%
What city has the Highest Percentage of Population Employed in Education, Arts & Media in Maryland?
Oldtown has the Highest Percentage of Population Employed in Education, Arts & Media in Maryland with 32.4%.
What is the Percentage of Population Employed in Education, Arts & Media in the State of Maryland?
Percentage of Population Employed in Education, Arts & Media in Maryland is 1.9%.
What is the Percentage of Population Employed in Education, Arts & Media in the United States?
Percentage of Population Employed in Education, Arts & Media in the United States is 1.8%.