Cities with the Highest Percentage of Population Employed in Education, Arts & Media in Illinois
RELATED REPORTS & OPTIONS
Education, Arts & Media
Illinois
Compare Cities
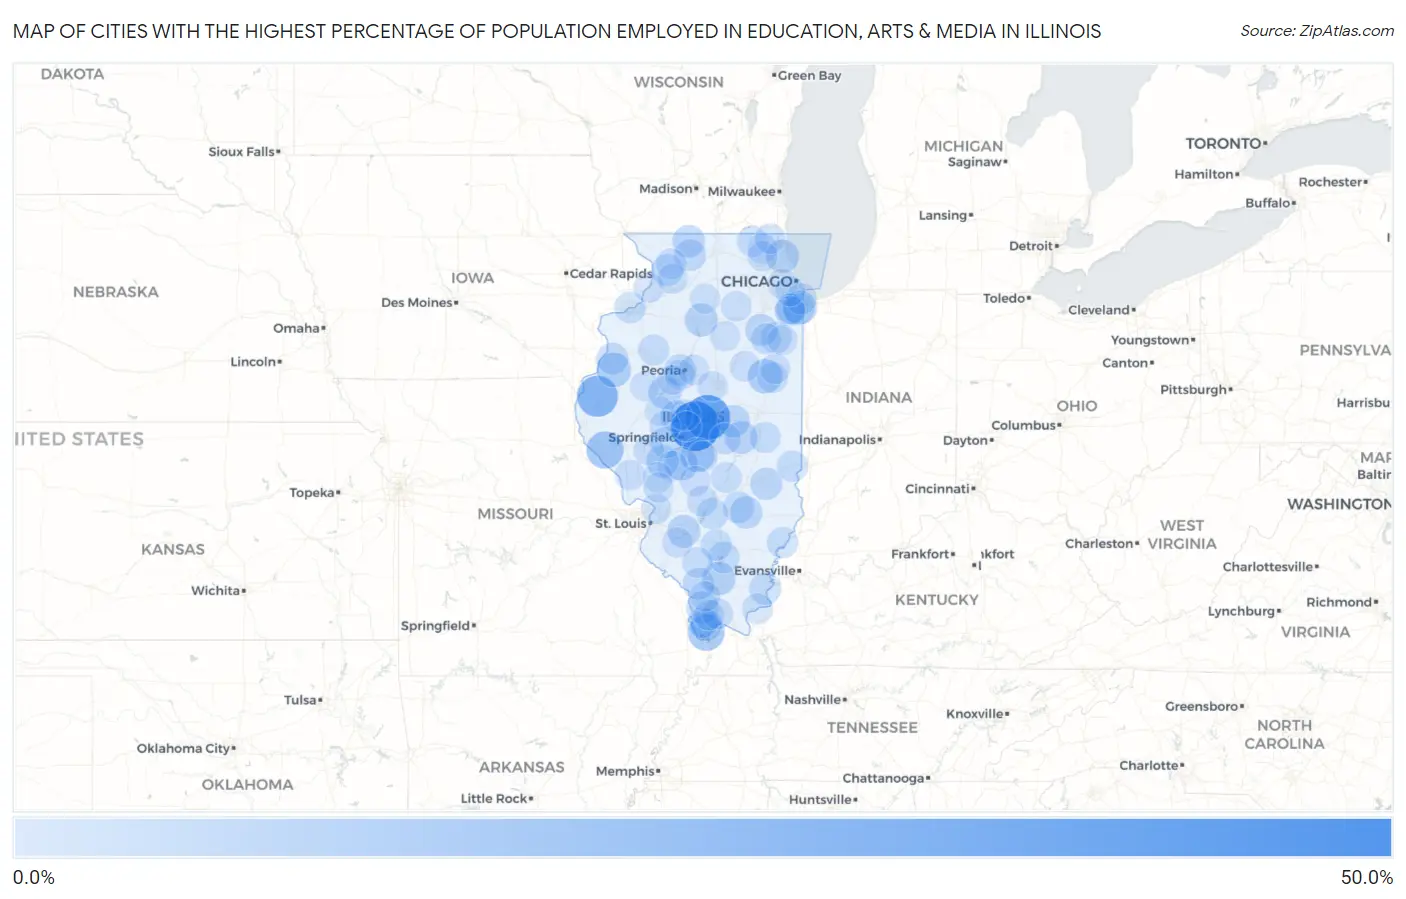
Map of Cities with the Highest Percentage of Population Employed in Education, Arts & Media in Illinois
0.0%
50.0%
Cities with the Highest Percentage of Population Employed in Education, Arts & Media in Illinois
| City | % Employed | vs State | vs National | |
| 1. | Cornland | 42.5% | 1.7%(+40.8)#1 | 1.8%(+40.7)#64 |
| 2. | Chestnut | 33.8% | 1.7%(+32.0)#2 | 1.8%(+32.0)#93 |
| 3. | Bentley | 25.0% | 1.7%(+23.3)#3 | 1.8%(+23.2)#147 |
| 4. | Merritt | 23.5% | 1.7%(+21.8)#4 | 1.8%(+21.7)#165 |
| 5. | Unity | 20.7% | 1.7%(+19.0)#5 | 1.8%(+18.9)#200 |
| 6. | Baileyville | 20.0% | 1.7%(+18.3)#6 | 1.8%(+18.2)#209 |
| 7. | El Dara | 17.6% | 1.7%(+15.9)#7 | 1.8%(+15.9)#259 |
| 8. | Mounds | 16.3% | 1.7%(+14.6)#8 | 1.8%(+14.5)#301 |
| 9. | Plum Valley | 14.6% | 1.7%(+12.9)#9 | 1.8%(+12.9)#349 |
| 10. | Roberts | 12.6% | 1.7%(+10.8)#10 | 1.8%(+10.8)#442 |
| 11. | Langleyville | 12.5% | 1.7%(+10.8)#11 | 1.8%(+10.7)#444 |
| 12. | Raritan | 12.5% | 1.7%(+10.8)#12 | 1.8%(+10.7)#450 |
| 13. | Lynwood | 10.9% | 1.7%(+9.22)#13 | 1.8%(+9.15)#562 |
| 14. | Freeman Spur | 10.5% | 1.7%(+8.81)#14 | 1.8%(+8.74)#592 |
| 15. | Bannockburn | 10.4% | 1.7%(+8.65)#15 | 1.8%(+8.58)#609 |
| 16. | Farmersville | 10.2% | 1.7%(+8.52)#16 | 1.8%(+8.44)#620 |
| 17. | Prairietown | 10.1% | 1.7%(+8.43)#17 | 1.8%(+8.36)#628 |
| 18. | Goofy Ridge | 10.0% | 1.7%(+8.28)#18 | 1.8%(+8.21)#637 |
| 19. | Hollowayville | 10.0% | 1.7%(+8.28)#19 | 1.8%(+8.21)#647 |
| 20. | Damiansville | 9.5% | 1.7%(+7.75)#20 | 1.8%(+7.68)#705 |
| 21. | Hammond | 9.4% | 1.7%(+7.66)#21 | 1.8%(+7.59)#718 |
| 22. | Dakota | 9.0% | 1.7%(+7.27)#22 | 1.8%(+7.20)#781 |
| 23. | Modesto | 8.9% | 1.7%(+7.14)#23 | 1.8%(+7.07)#799 |
| 24. | Cisco | 8.6% | 1.7%(+6.90)#24 | 1.8%(+6.83)#843 |
| 25. | Louisville | 8.5% | 1.7%(+6.83)#25 | 1.8%(+6.76)#858 |
| 26. | Jonesboro | 8.2% | 1.7%(+6.52)#26 | 1.8%(+6.45)#916 |
| 27. | Hidalgo | 8.1% | 1.7%(+6.39)#27 | 1.8%(+6.32)#953 |
| 28. | Alvan | 8.0% | 1.7%(+6.33)#28 | 1.8%(+6.26)#964 |
| 29. | Braceville | 8.0% | 1.7%(+6.24)#29 | 1.8%(+6.17)#991 |
| 30. | Biggsville | 7.7% | 1.7%(+6.02)#30 | 1.8%(+5.95)#1,029 |
| 31. | Shawneetown | 7.7% | 1.7%(+5.98)#31 | 1.8%(+5.91)#1,036 |
| 32. | German Valley | 7.7% | 1.7%(+5.95)#32 | 1.8%(+5.88)#1,052 |
| 33. | Chadwick | 7.5% | 1.7%(+5.83)#33 | 1.8%(+5.76)#1,081 |
| 34. | Pulaski | 7.5% | 1.7%(+5.78)#34 | 1.8%(+5.71)#1,098 |
| 35. | Harrison | 7.4% | 1.7%(+5.71)#35 | 1.8%(+5.64)#1,117 |
| 36. | Bellevue | 7.4% | 1.7%(+5.71)#36 | 1.8%(+5.64)#1,118 |
| 37. | Greenview | 7.3% | 1.7%(+5.59)#37 | 1.8%(+5.52)#1,146 |
| 38. | Limestone | 7.2% | 1.7%(+5.44)#38 | 1.8%(+5.37)#1,179 |
| 39. | Ford Heights | 7.1% | 1.7%(+5.43)#39 | 1.8%(+5.36)#1,180 |
| 40. | Iola | 7.1% | 1.7%(+5.43)#40 | 1.8%(+5.36)#1,193 |
| 41. | New Berlin | 7.1% | 1.7%(+5.36)#41 | 1.8%(+5.29)#1,212 |
| 42. | Rock Island Arsenal | 7.0% | 1.7%(+5.28)#42 | 1.8%(+5.21)#1,233 |
| 43. | Blairsville | 6.8% | 1.7%(+5.13)#43 | 1.8%(+5.06)#1,290 |
| 44. | Middletown | 6.8% | 1.7%(+5.10)#44 | 1.8%(+5.03)#1,297 |
| 45. | Ina | 6.8% | 1.7%(+5.07)#45 | 1.8%(+5.00)#1,304 |
| 46. | Mount Zion | 6.7% | 1.7%(+4.97)#46 | 1.8%(+4.90)#1,341 |
| 47. | Olympia Fields | 6.7% | 1.7%(+4.95)#47 | 1.8%(+4.88)#1,364 |
| 48. | Woodlawn | 6.5% | 1.7%(+4.78)#48 | 1.8%(+4.71)#1,418 |
| 49. | Patoka | 6.5% | 1.7%(+4.76)#49 | 1.8%(+4.69)#1,429 |
| 50. | Marshall | 6.4% | 1.7%(+4.72)#50 | 1.8%(+4.65)#1,454 |
| 51. | Camargo | 6.4% | 1.7%(+4.70)#51 | 1.8%(+4.63)#1,470 |
| 52. | Greenwood | 6.4% | 1.7%(+4.68)#52 | 1.8%(+4.60)#1,481 |
| 53. | Burnham | 6.3% | 1.7%(+4.58)#53 | 1.8%(+4.51)#1,513 |
| 54. | Keensburg | 6.2% | 1.7%(+4.53)#54 | 1.8%(+4.46)#1,531 |
| 55. | Oak Run | 5.9% | 1.7%(+4.22)#55 | 1.8%(+4.15)#1,659 |
| 56. | Elizabethtown | 5.9% | 1.7%(+4.17)#56 | 1.8%(+4.10)#1,688 |
| 57. | Cowden | 5.7% | 1.7%(+4.03)#57 | 1.8%(+3.96)#1,757 |
| 58. | Campbell's Island | 5.7% | 1.7%(+4.01)#58 | 1.8%(+3.94)#1,766 |
| 59. | Union Hill | 5.7% | 1.7%(+4.00)#59 | 1.8%(+3.93)#1,772 |
| 60. | Tamms | 5.7% | 1.7%(+3.98)#60 | 1.8%(+3.91)#1,776 |
| 61. | Cypress | 5.7% | 1.7%(+3.97)#61 | 1.8%(+3.90)#1,785 |
| 62. | Buckley | 5.6% | 1.7%(+3.90)#62 | 1.8%(+3.83)#1,827 |
| 63. | Dongola | 5.6% | 1.7%(+3.84)#63 | 1.8%(+3.77)#1,858 |
| 64. | Tallula | 5.5% | 1.7%(+3.74)#64 | 1.8%(+3.67)#1,918 |
| 65. | Mulberry Grove | 5.4% | 1.7%(+3.73)#65 | 1.8%(+3.66)#1,925 |
| 66. | Woodson | 5.4% | 1.7%(+3.69)#66 | 1.8%(+3.62)#1,951 |
| 67. | Pinckneyville | 5.3% | 1.7%(+3.58)#67 | 1.8%(+3.51)#2,027 |
| 68. | Nilwood | 5.3% | 1.7%(+3.55)#68 | 1.8%(+3.48)#2,052 |
| 69. | Lanark | 5.2% | 1.7%(+3.52)#69 | 1.8%(+3.45)#2,071 |
| 70. | Fairbury | 5.2% | 1.7%(+3.51)#70 | 1.8%(+3.44)#2,081 |
| 71. | Bartonville | 5.2% | 1.7%(+3.51)#71 | 1.8%(+3.44)#2,082 |
| 72. | Eldred | 5.2% | 1.7%(+3.49)#72 | 1.8%(+3.42)#2,092 |
| 73. | Cahokia Heights | 5.2% | 1.7%(+3.48)#73 | 1.8%(+3.41)#2,101 |
| 74. | Holiday Hills | 5.2% | 1.7%(+3.44)#74 | 1.8%(+3.37)#2,132 |
| 75. | Sheridan | 5.1% | 1.7%(+3.35)#75 | 1.8%(+3.28)#2,210 |
| 76. | Washington | 5.0% | 1.7%(+3.33)#76 | 1.8%(+3.26)#2,221 |
| 77. | Makanda | 5.0% | 1.7%(+3.24)#77 | 1.8%(+3.17)#2,293 |
| 78. | Onarga | 4.9% | 1.7%(+3.23)#78 | 1.8%(+3.16)#2,299 |
| 79. | Taylorville | 4.9% | 1.7%(+3.20)#79 | 1.8%(+3.13)#2,319 |
| 80. | Twin Grove | 4.9% | 1.7%(+3.20)#80 | 1.8%(+3.13)#2,320 |
| 81. | Irving | 4.9% | 1.7%(+3.18)#81 | 1.8%(+3.11)#2,348 |
| 82. | Matteson | 4.9% | 1.7%(+3.16)#82 | 1.8%(+3.09)#2,365 |
| 83. | Fox River Grove | 4.9% | 1.7%(+3.16)#83 | 1.8%(+3.09)#2,366 |
| 84. | Albany | 4.9% | 1.7%(+3.15)#84 | 1.8%(+3.08)#2,375 |
| 85. | St Libory | 4.9% | 1.7%(+3.14)#85 | 1.8%(+3.07)#2,386 |
| 86. | Lake Villa | 4.8% | 1.7%(+3.07)#86 | 1.8%(+3.00)#2,440 |
| 87. | Chesterfield | 4.7% | 1.7%(+2.99)#87 | 1.8%(+2.92)#2,509 |
| 88. | Coleta | 4.7% | 1.7%(+2.94)#88 | 1.8%(+2.87)#2,571 |
| 89. | Hartford | 4.6% | 1.7%(+2.92)#89 | 1.8%(+2.85)#2,591 |
| 90. | La Grange Park | 4.6% | 1.7%(+2.90)#90 | 1.8%(+2.83)#2,608 |
| 91. | Sublette | 4.6% | 1.7%(+2.88)#91 | 1.8%(+2.81)#2,643 |
| 92. | Richton Park | 4.5% | 1.7%(+2.80)#92 | 1.8%(+2.73)#2,715 |
| 93. | Kilbourne | 4.5% | 1.7%(+2.79)#93 | 1.8%(+2.72)#2,731 |
| 94. | Kangley | 4.5% | 1.7%(+2.79)#94 | 1.8%(+2.72)#2,733 |
| 95. | Smithfield | 4.5% | 1.7%(+2.76)#95 | 1.8%(+2.69)#2,760 |
| 96. | Kankakee | 4.4% | 1.7%(+2.71)#96 | 1.8%(+2.64)#2,802 |
| 97. | Williamsville | 4.4% | 1.7%(+2.69)#97 | 1.8%(+2.62)#2,819 |
| 98. | Shipman | 4.4% | 1.7%(+2.69)#98 | 1.8%(+2.62)#2,823 |
| 99. | Hometown | 4.4% | 1.7%(+2.64)#99 | 1.8%(+2.57)#2,873 |
| 100. | Glasford | 4.3% | 1.7%(+2.60)#100 | 1.8%(+2.53)#2,904 |
Common Questions
What are the Top 10 Cities with the Highest Percentage of Population Employed in Education, Arts & Media in Illinois?
Top 10 Cities with the Highest Percentage of Population Employed in Education, Arts & Media in Illinois are:
#1
42.5%
#2
33.8%
#3
25.0%
#4
17.6%
#5
16.3%
#6
12.6%
#7
12.5%
#8
12.5%
#9
10.9%
#10
10.5%
What city has the Highest Percentage of Population Employed in Education, Arts & Media in Illinois?
Cornland has the Highest Percentage of Population Employed in Education, Arts & Media in Illinois with 42.5%.
What is the Percentage of Population Employed in Education, Arts & Media in the State of Illinois?
Percentage of Population Employed in Education, Arts & Media in Illinois is 1.7%.
What is the Percentage of Population Employed in Education, Arts & Media in the United States?
Percentage of Population Employed in Education, Arts & Media in the United States is 1.8%.