Cities with the Highest Percentage of Population Employed in Education, Arts & Media in Iowa
RELATED REPORTS & OPTIONS
Education, Arts & Media
Iowa
Compare Cities
Map of Cities with the Highest Percentage of Population Employed in Education, Arts & Media in Iowa
0.0%
40.0%
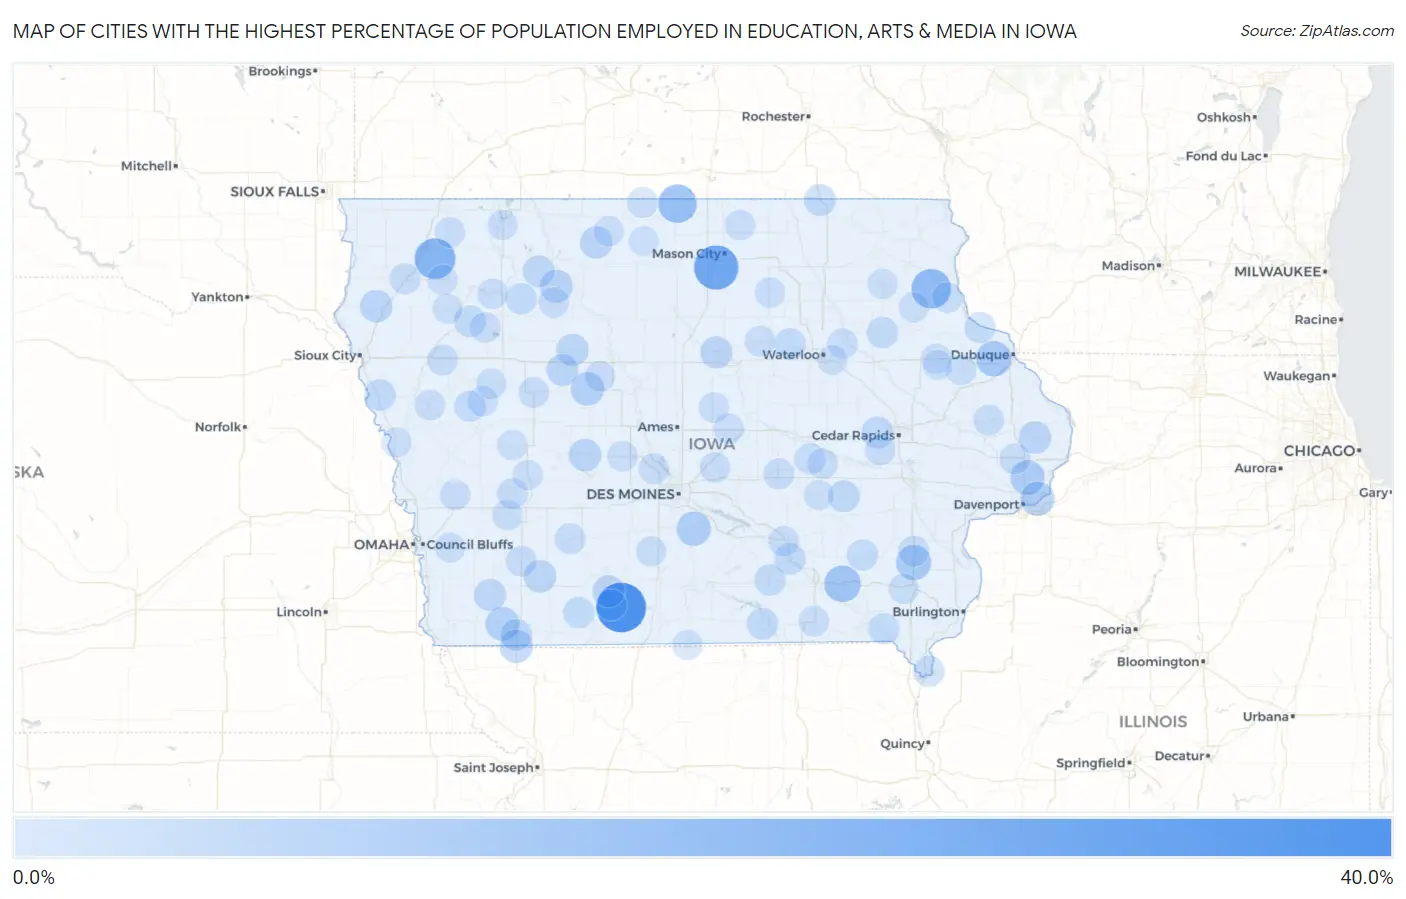
Cities with the Highest Percentage of Population Employed in Education, Arts & Media in Iowa
| City | % Employed | vs State | vs National | |
| 1. | Ellston | 33.3% | 1.6%(+31.7)#1 | 1.8%(+31.5)#94 |
| 2. | Burchinal | 25.0% | 1.6%(+23.4)#2 | 1.8%(+23.2)#146 |
| 3. | Archer | 19.7% | 1.6%(+18.0)#3 | 1.8%(+17.9)#221 |
| 4. | St Olaf | 17.5% | 1.6%(+15.8)#4 | 1.8%(+15.7)#264 |
| 5. | Scarville | 15.6% | 1.6%(+14.0)#5 | 1.8%(+13.8)#316 |
| 6. | Batavia | 13.1% | 1.6%(+11.5)#6 | 1.8%(+11.3)#413 |
| 7. | Centralia | 11.4% | 1.6%(+9.80)#7 | 1.8%(+9.64)#512 |
| 8. | Olds | 11.0% | 1.6%(+9.36)#8 | 1.8%(+9.20)#556 |
| 9. | Park View | 9.8% | 1.6%(+8.16)#9 | 1.8%(+8.00)#660 |
| 10. | Ackworth | 9.6% | 1.6%(+7.99)#10 | 1.8%(+7.83)#683 |
| 11. | Panorama Park | 9.3% | 1.6%(+7.71)#11 | 1.8%(+7.55)#728 |
| 12. | Yorktown | 9.1% | 1.6%(+7.46)#12 | 1.8%(+7.30)#770 |
| 13. | Farnhamville | 8.6% | 1.6%(+6.93)#13 | 1.8%(+6.77)#857 |
| 14. | Braddyville | 8.2% | 1.6%(+6.54)#14 | 1.8%(+6.38)#941 |
| 15. | Mallard | 7.6% | 1.6%(+5.99)#15 | 1.8%(+5.83)#1,064 |
| 16. | Brunsville | 7.2% | 1.6%(+5.62)#16 | 1.8%(+5.46)#1,159 |
| 17. | Bagley | 7.1% | 1.6%(+5.52)#17 | 1.8%(+5.36)#1,185 |
| 18. | Carbon | 7.1% | 1.6%(+5.52)#18 | 1.8%(+5.36)#1,192 |
| 19. | Lone Rock | 6.9% | 1.6%(+5.27)#19 | 1.8%(+5.11)#1,273 |
| 20. | Charlotte | 6.8% | 1.6%(+5.20)#20 | 1.8%(+5.04)#1,293 |
| 21. | Manson | 6.7% | 1.6%(+5.06)#21 | 1.8%(+4.90)#1,343 |
| 22. | Iowa Falls | 6.5% | 1.6%(+4.86)#22 | 1.8%(+4.70)#1,422 |
| 23. | Arispe | 6.5% | 1.6%(+4.83)#23 | 1.8%(+4.67)#1,445 |
| 24. | Rockwell City | 6.4% | 1.6%(+4.77)#24 | 1.8%(+4.61)#1,479 |
| 25. | Coburg | 6.2% | 1.6%(+4.62)#25 | 1.8%(+4.46)#1,536 |
| 26. | Ayrshire | 6.2% | 1.6%(+4.55)#26 | 1.8%(+4.39)#1,569 |
| 27. | Shambaugh | 6.1% | 1.6%(+4.47)#27 | 1.8%(+4.31)#1,602 |
| 28. | Chester | 6.0% | 1.6%(+4.34)#28 | 1.8%(+4.18)#1,647 |
| 29. | Atkins | 5.9% | 1.6%(+4.29)#29 | 1.8%(+4.13)#1,671 |
| 30. | Millersburg | 5.9% | 1.6%(+4.26)#30 | 1.8%(+4.10)#1,693 |
| 31. | Aurelia | 5.7% | 1.6%(+4.06)#31 | 1.8%(+3.90)#1,779 |
| 32. | Centerville | 5.7% | 1.6%(+4.03)#32 | 1.8%(+3.87)#1,801 |
| 33. | Sloan | 5.6% | 1.6%(+3.98)#33 | 1.8%(+3.82)#1,836 |
| 34. | Eddyville | 5.4% | 1.6%(+3.82)#34 | 1.8%(+3.66)#1,923 |
| 35. | Stanley | 5.4% | 1.6%(+3.78)#35 | 1.8%(+3.62)#1,956 |
| 36. | Albia | 5.2% | 1.6%(+3.55)#36 | 1.8%(+3.39)#2,113 |
| 37. | Schleswig | 5.2% | 1.6%(+3.54)#37 | 1.8%(+3.38)#2,120 |
| 38. | Marathon | 5.2% | 1.6%(+3.53)#38 | 1.8%(+3.37)#2,131 |
| 39. | Richland | 5.2% | 1.6%(+3.52)#39 | 1.8%(+3.36)#2,134 |
| 40. | Clearfield | 5.1% | 1.6%(+3.50)#40 | 1.8%(+3.34)#2,152 |
| 41. | Keokuk | 5.1% | 1.6%(+3.43)#41 | 1.8%(+3.27)#2,214 |
| 42. | New Hartford | 5.0% | 1.6%(+3.37)#42 | 1.8%(+3.21)#2,256 |
| 43. | Tingley | 5.0% | 1.6%(+3.37)#43 | 1.8%(+3.21)#2,270 |
| 44. | North Buena Vista | 5.0% | 1.6%(+3.37)#44 | 1.8%(+3.21)#2,271 |
| 45. | Bonaparte | 4.8% | 1.6%(+3.22)#45 | 1.8%(+3.06)#2,391 |
| 46. | Elk Horn | 4.7% | 1.6%(+3.12)#46 | 1.8%(+2.96)#2,476 |
| 47. | Fontanelle | 4.7% | 1.6%(+3.10)#47 | 1.8%(+2.94)#2,486 |
| 48. | Crawfordsville | 4.7% | 1.6%(+3.02)#48 | 1.8%(+2.87)#2,567 |
| 49. | Alton | 4.6% | 1.6%(+3.01)#49 | 1.8%(+2.85)#2,596 |
| 50. | Holiday Lake | 4.6% | 1.6%(+2.97)#50 | 1.8%(+2.81)#2,642 |
| 51. | Grinnell | 4.6% | 1.6%(+2.93)#51 | 1.8%(+2.77)#2,672 |
| 52. | Cushing | 4.5% | 1.6%(+2.85)#52 | 1.8%(+2.69)#2,758 |
| 53. | Granger | 4.4% | 1.6%(+2.80)#53 | 1.8%(+2.64)#2,803 |
| 54. | Grand Mound | 4.4% | 1.6%(+2.80)#54 | 1.8%(+2.64)#2,806 |
| 55. | Auburn | 4.4% | 1.6%(+2.77)#55 | 1.8%(+2.61)#2,838 |
| 56. | Monmouth | 4.3% | 1.6%(+2.72)#56 | 1.8%(+2.56)#2,887 |
| 57. | Grant | 4.3% | 1.6%(+2.72)#57 | 1.8%(+2.56)#2,891 |
| 58. | Kiron | 4.3% | 1.6%(+2.67)#58 | 1.8%(+2.52)#2,923 |
| 59. | Havelock | 4.3% | 1.6%(+2.67)#59 | 1.8%(+2.52)#2,924 |
| 60. | Mapleton | 4.3% | 1.6%(+2.67)#60 | 1.8%(+2.51)#2,933 |
| 61. | Rake | 4.3% | 1.6%(+2.66)#61 | 1.8%(+2.50)#2,943 |
| 62. | Alta | 4.3% | 1.6%(+2.65)#62 | 1.8%(+2.49)#2,955 |
| 63. | Marne | 4.3% | 1.6%(+2.63)#63 | 1.8%(+2.47)#2,978 |
| 64. | State Center | 4.2% | 1.6%(+2.62)#64 | 1.8%(+2.46)#2,989 |
| 65. | Aplington | 4.2% | 1.6%(+2.61)#65 | 1.8%(+2.45)#3,014 |
| 66. | Dunkerton | 4.2% | 1.6%(+2.58)#66 | 1.8%(+2.42)#3,039 |
| 67. | Linn Grove | 4.2% | 1.6%(+2.54)#67 | 1.8%(+2.38)#3,083 |
| 68. | Grafton | 4.1% | 1.6%(+2.51)#68 | 1.8%(+2.35)#3,120 |
| 69. | Perry | 4.1% | 1.6%(+2.50)#69 | 1.8%(+2.34)#3,137 |
| 70. | Garnavillo | 4.1% | 1.6%(+2.46)#70 | 1.8%(+2.30)#3,191 |
| 71. | Beacon | 4.1% | 1.6%(+2.45)#71 | 1.8%(+2.29)#3,217 |
| 72. | Bloomfield | 4.1% | 1.6%(+2.45)#72 | 1.8%(+2.29)#3,220 |
| 73. | Walford | 4.1% | 1.6%(+2.43)#73 | 1.8%(+2.27)#3,240 |
| 74. | Zearing | 4.0% | 1.6%(+2.42)#74 | 1.8%(+2.26)#3,247 |
| 75. | Callender | 4.0% | 1.6%(+2.42)#75 | 1.8%(+2.26)#3,251 |
| 76. | Mingo | 4.0% | 1.6%(+2.42)#76 | 1.8%(+2.26)#3,253 |
| 77. | Persia | 4.0% | 1.6%(+2.40)#77 | 1.8%(+2.24)#3,289 |
| 78. | Odebolt | 4.0% | 1.6%(+2.34)#78 | 1.8%(+2.18)#3,365 |
| 79. | Greene | 3.9% | 1.6%(+2.31)#79 | 1.8%(+2.15)#3,405 |
| 80. | Melvin | 3.9% | 1.6%(+2.30)#80 | 1.8%(+2.14)#3,432 |
| 81. | Hartwick | 3.9% | 1.6%(+2.30)#81 | 1.8%(+2.14)#3,435 |
| 82. | Truro | 3.9% | 1.6%(+2.25)#82 | 1.8%(+2.09)#3,501 |
| 83. | Westwood | 3.8% | 1.6%(+2.22)#83 | 1.8%(+2.06)#3,547 |
| 84. | Worthington | 3.8% | 1.6%(+2.20)#84 | 1.8%(+2.04)#3,574 |
| 85. | Audubon | 3.8% | 1.6%(+2.18)#85 | 1.8%(+2.02)#3,614 |
| 86. | Delaware | 3.8% | 1.6%(+2.17)#86 | 1.8%(+2.01)#3,627 |
| 87. | Bancroft | 3.8% | 1.6%(+2.17)#87 | 1.8%(+2.01)#3,632 |
| 88. | Manning | 3.8% | 1.6%(+2.13)#88 | 1.8%(+1.97)#3,694 |
| 89. | Lineville | 3.7% | 1.6%(+2.12)#89 | 1.8%(+1.96)#3,710 |
| 90. | Deep River | 3.7% | 1.6%(+2.08)#90 | 1.8%(+1.92)#3,776 |
| 91. | Paullina | 3.7% | 1.6%(+2.05)#91 | 1.8%(+1.89)#3,822 |
| 92. | Woden | 3.7% | 1.6%(+2.03)#92 | 1.8%(+1.87)#3,848 |
| 93. | Blencoe | 3.6% | 1.6%(+2.01)#93 | 1.8%(+1.85)#3,883 |
| 94. | Volga | 3.6% | 1.6%(+2.01)#94 | 1.8%(+1.85)#3,885 |
| 95. | West Union | 3.6% | 1.6%(+1.98)#95 | 1.8%(+1.82)#3,921 |
| 96. | Milford | 3.6% | 1.6%(+1.97)#96 | 1.8%(+1.81)#3,949 |
| 97. | Elk Run Heights | 3.6% | 1.6%(+1.97)#97 | 1.8%(+1.81)#3,956 |
| 98. | Treynor | 3.6% | 1.6%(+1.96)#98 | 1.8%(+1.80)#3,965 |
| 99. | Delhi | 3.6% | 1.6%(+1.96)#99 | 1.8%(+1.80)#3,980 |
| 100. | Meriden | 3.6% | 1.6%(+1.95)#100 | 1.8%(+1.79)#4,013 |
Common Questions
What are the Top 10 Cities with the Highest Percentage of Population Employed in Education, Arts & Media in Iowa?
Top 10 Cities with the Highest Percentage of Population Employed in Education, Arts & Media in Iowa are:
What city has the Highest Percentage of Population Employed in Education, Arts & Media in Iowa?
Ellston has the Highest Percentage of Population Employed in Education, Arts & Media in Iowa with 33.3%.
What is the Percentage of Population Employed in Education, Arts & Media in the State of Iowa?
Percentage of Population Employed in Education, Arts & Media in Iowa is 1.6%.
What is the Percentage of Population Employed in Education, Arts & Media in the United States?
Percentage of Population Employed in Education, Arts & Media in the United States is 1.8%.