Zip Codes with the Highest Percentage of Population Employed in Education, Arts & Media in Chino, CA
RELATED REPORTS & OPTIONS
Education, Arts & Media
Chino
Compare Zip Codes
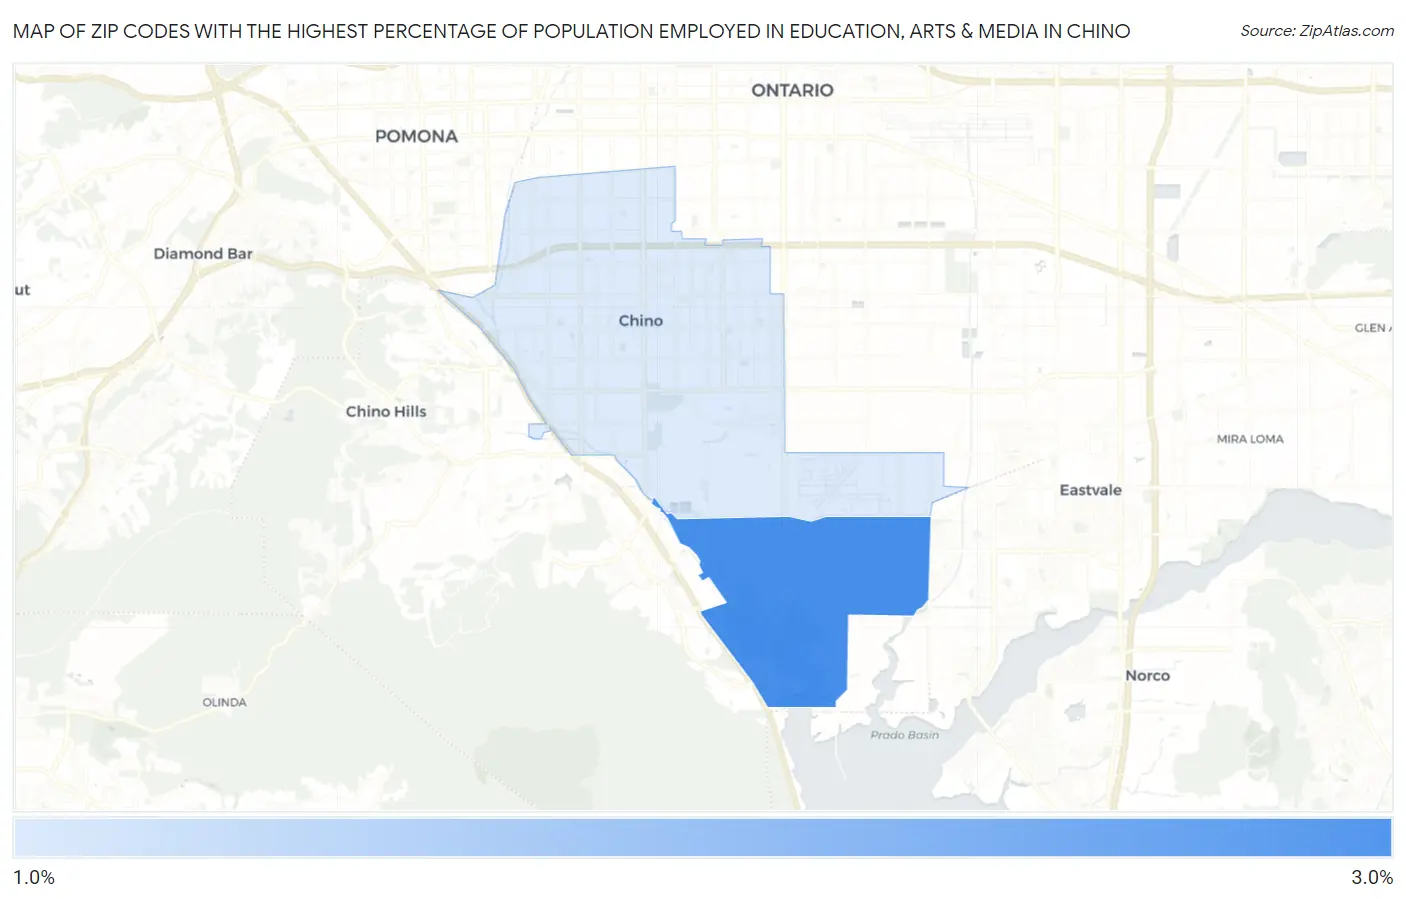
Map of Zip Codes with the Highest Percentage of Population Employed in Education, Arts & Media in Chino
1.8%
2.9%
Zip Codes with the Highest Percentage of Population Employed in Education, Arts & Media in Chino, CA
| Zip Code | % Employed | vs State | vs National | |
| 1. | 91708 | 2.9% | 1.7%(+1.18)#175 | 1.8%(+1.10)#4,861 |
| 2. | 91710 | 1.8% | 1.7%(+0.133)#559 | 1.8%(+0.059)#10,792 |
1
Common Questions
What are the Top Zip Codes with the Highest Percentage of Population Employed in Education, Arts & Media in Chino, CA?
Top Zip Codes with the Highest Percentage of Population Employed in Education, Arts & Media in Chino, CA are:
What zip code has the Highest Percentage of Population Employed in Education, Arts & Media in Chino, CA?
91708 has the Highest Percentage of Population Employed in Education, Arts & Media in Chino, CA with 2.9%.
What is the Percentage of Population Employed in Education, Arts & Media in Chino, CA?
Percentage of Population Employed in Education, Arts & Media in Chino is 2.0%.
What is the Percentage of Population Employed in Education, Arts & Media in California?
Percentage of Population Employed in Education, Arts & Media in California is 1.7%.
What is the Percentage of Population Employed in Education, Arts & Media in the United States?
Percentage of Population Employed in Education, Arts & Media in the United States is 1.8%.