Cities with the Highest Percentage of Population Employed in Education, Arts & Media in Massachusetts
RELATED REPORTS & OPTIONS
Education, Arts & Media
Massachusetts
Compare Cities
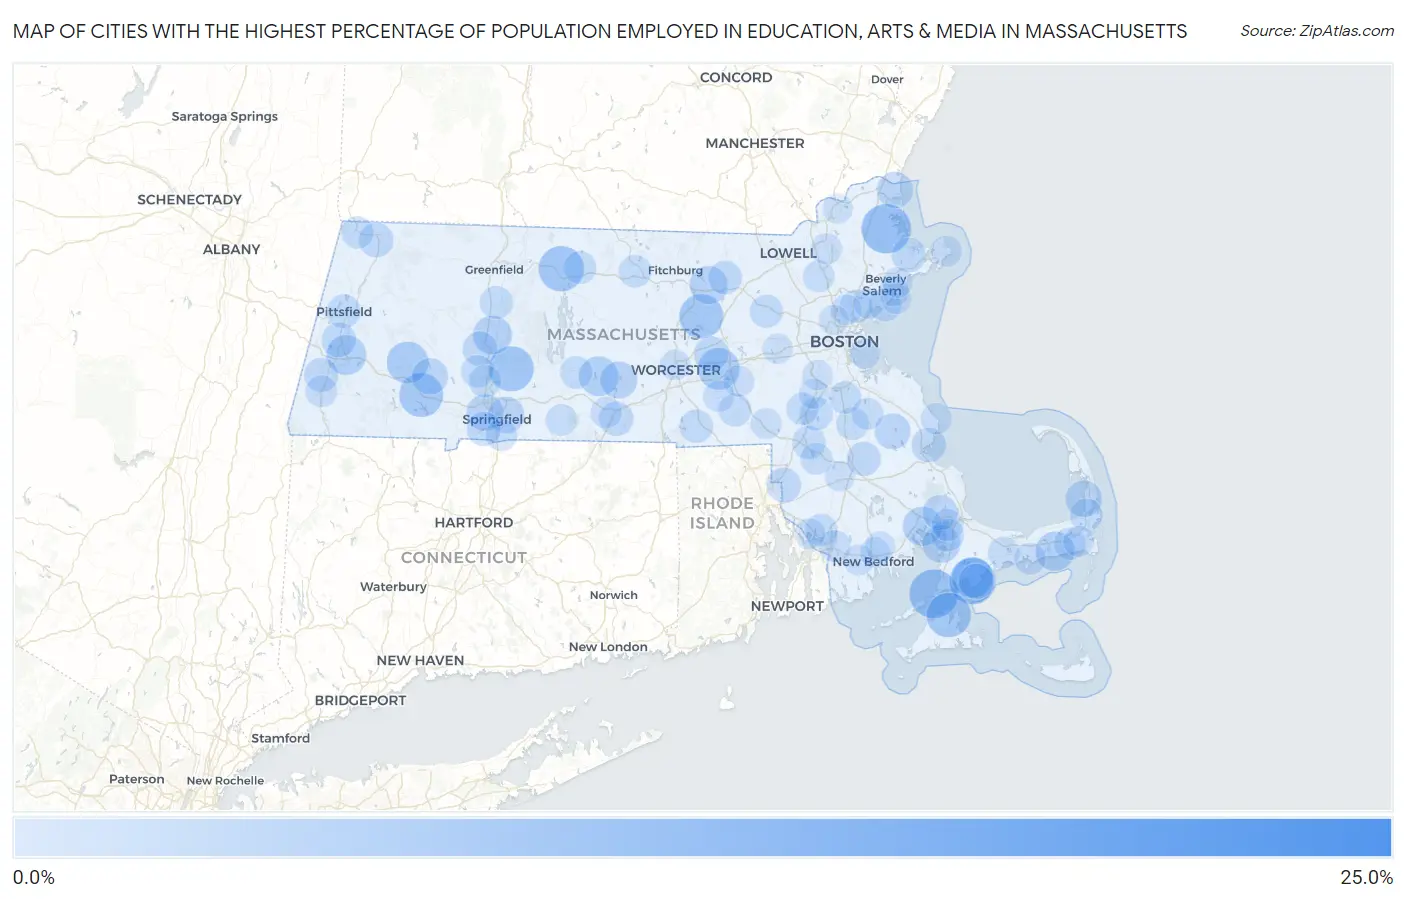
Map of Cities with the Highest Percentage of Population Employed in Education, Arts & Media in Massachusetts
0.0%
25.0%
Cities with the Highest Percentage of Population Employed in Education, Arts & Media in Massachusetts
| City | % Employed | vs State | vs National | |
| 1. | Lenox Dale | 22.9% | 2.1%(+20.8)#1 | 1.8%(+21.1)#168 |
| 2. | Rowley | 10.1% | 2.1%(+7.99)#2 | 1.8%(+8.33)#629 |
| 3. | Woods Hole | 9.9% | 2.1%(+7.75)#3 | 1.8%(+8.09)#653 |
| 4. | Monomoscoy Island | 8.8% | 2.1%(+6.69)#4 | 1.8%(+7.04)#806 |
| 5. | Orange | 8.5% | 2.1%(+6.35)#5 | 1.8%(+6.69)#865 |
| 6. | Granby | 8.3% | 2.1%(+6.19)#6 | 1.8%(+6.54)#903 |
| 7. | Vineyard Haven | 8.1% | 2.1%(+5.95)#7 | 1.8%(+6.29)#957 |
| 8. | South Lancaster | 8.0% | 2.1%(+5.83)#8 | 1.8%(+6.17)#989 |
| 9. | Blandford | 7.9% | 2.1%(+5.73)#9 | 1.8%(+6.08)#1,007 |
| 10. | Chester | 7.0% | 2.1%(+4.85)#10 | 1.8%(+5.20)#1,237 |
| 11. | Westborough | 7.0% | 2.1%(+4.83)#11 | 1.8%(+5.18)#1,245 |
| 12. | Seabrook | 6.6% | 2.1%(+4.42)#12 | 1.8%(+4.77)#1,399 |
| 13. | Lee | 6.2% | 2.1%(+4.05)#13 | 1.8%(+4.39)#1,565 |
| 14. | West Brookfield | 6.1% | 2.1%(+3.95)#14 | 1.8%(+4.30)#1,608 |
| 15. | Wareham Center | 5.9% | 2.1%(+3.76)#15 | 1.8%(+4.11)#1,678 |
| 16. | Dennis Port | 5.9% | 2.1%(+3.74)#16 | 1.8%(+4.08)#1,703 |
| 17. | Hatfield | 5.8% | 2.1%(+3.66)#17 | 1.8%(+4.01)#1,734 |
| 18. | Shirley | 5.4% | 2.1%(+3.25)#18 | 1.8%(+3.60)#1,962 |
| 19. | Pocasset | 5.4% | 2.1%(+3.23)#19 | 1.8%(+3.58)#1,981 |
| 20. | East Brookfield | 5.0% | 2.1%(+2.87)#20 | 1.8%(+3.21)#2,253 |
| 21. | West Springfield Town | 4.9% | 2.1%(+2.75)#21 | 1.8%(+3.10)#2,350 |
| 22. | North Eastham | 4.8% | 2.1%(+2.68)#22 | 1.8%(+3.03)#2,418 |
| 23. | Springfield | 4.8% | 2.1%(+2.66)#23 | 1.8%(+3.00)#2,437 |
| 24. | Huntington | 4.8% | 2.1%(+2.62)#24 | 1.8%(+2.97)#2,463 |
| 25. | Salisbury | 4.7% | 2.1%(+2.56)#25 | 1.8%(+2.91)#2,517 |
| 26. | Hanson | 4.5% | 2.1%(+2.36)#26 | 1.8%(+2.70)#2,743 |
| 27. | New Seabury | 4.3% | 2.1%(+2.16)#27 | 1.8%(+2.51)#2,936 |
| 28. | White Island Shores | 4.2% | 2.1%(+2.07)#28 | 1.8%(+2.41)#3,041 |
| 29. | Northampton | 4.1% | 2.1%(+1.97)#29 | 1.8%(+2.32)#3,164 |
| 30. | North Seekonk | 4.1% | 2.1%(+1.94)#30 | 1.8%(+2.29)#3,215 |
| 31. | Lenox | 4.1% | 2.1%(+1.93)#31 | 1.8%(+2.28)#3,232 |
| 32. | Northborough | 4.0% | 2.1%(+1.90)#32 | 1.8%(+2.25)#3,278 |
| 33. | South Duxbury | 4.0% | 2.1%(+1.86)#33 | 1.8%(+2.21)#3,330 |
| 34. | North Adams | 4.0% | 2.1%(+1.86)#34 | 1.8%(+2.21)#3,333 |
| 35. | Essex | 4.0% | 2.1%(+1.86)#35 | 1.8%(+2.20)#3,335 |
| 36. | Sturbridge | 3.9% | 2.1%(+1.78)#36 | 1.8%(+2.13)#3,447 |
| 37. | Housatonic | 3.8% | 2.1%(+1.69)#37 | 1.8%(+2.04)#3,580 |
| 38. | Agawam Town | 3.8% | 2.1%(+1.69)#38 | 1.8%(+2.04)#3,583 |
| 39. | Bridgewater Town | 3.8% | 2.1%(+1.65)#39 | 1.8%(+1.99)#3,655 |
| 40. | Pittsfield | 3.7% | 2.1%(+1.60)#40 | 1.8%(+1.95)#3,729 |
| 41. | Ayer | 3.7% | 2.1%(+1.55)#41 | 1.8%(+1.90)#3,806 |
| 42. | East Douglas | 3.6% | 2.1%(+1.46)#42 | 1.8%(+1.80)#3,966 |
| 43. | Greenfield | 3.6% | 2.1%(+1.44)#43 | 1.8%(+1.79)#3,997 |
| 44. | Mansfield Center | 3.5% | 2.1%(+1.39)#44 | 1.8%(+1.74)#4,093 |
| 45. | West Concord | 3.5% | 2.1%(+1.33)#45 | 1.8%(+1.68)#4,194 |
| 46. | Sharon | 3.4% | 2.1%(+1.31)#46 | 1.8%(+1.66)#4,250 |
| 47. | Saugus | 3.4% | 2.1%(+1.29)#47 | 1.8%(+1.64)#4,290 |
| 48. | South Deerfield | 3.4% | 2.1%(+1.26)#48 | 1.8%(+1.61)#4,343 |
| 49. | Hopedale | 3.4% | 2.1%(+1.23)#49 | 1.8%(+1.58)#4,396 |
| 50. | Swampscott | 3.4% | 2.1%(+1.23)#50 | 1.8%(+1.58)#4,400 |
| 51. | Athol | 3.3% | 2.1%(+1.20)#51 | 1.8%(+1.55)#4,439 |
| 52. | Monument Beach | 3.3% | 2.1%(+1.18)#52 | 1.8%(+1.52)#4,502 |
| 53. | Gardner | 3.3% | 2.1%(+1.14)#53 | 1.8%(+1.49)#4,574 |
| 54. | Orleans | 3.3% | 2.1%(+1.13)#54 | 1.8%(+1.47)#4,595 |
| 55. | Ware | 3.2% | 2.1%(+1.10)#55 | 1.8%(+1.45)#4,649 |
| 56. | Brockton | 3.2% | 2.1%(+1.07)#56 | 1.8%(+1.42)#4,722 |
| 57. | Randolph Town | 3.2% | 2.1%(+1.04)#57 | 1.8%(+1.39)#4,781 |
| 58. | Easthampton Town | 3.2% | 2.1%(+1.02)#58 | 1.8%(+1.37)#4,848 |
| 59. | Walpole | 3.1% | 2.1%(+1.000)#59 | 1.8%(+1.35)#4,903 |
| 60. | Somerset | 3.1% | 2.1%(+0.986)#60 | 1.8%(+1.33)#4,941 |
| 61. | Holyoke | 3.1% | 2.1%(+0.981)#61 | 1.8%(+1.33)#4,954 |
| 62. | Williamstown | 3.1% | 2.1%(+0.970)#62 | 1.8%(+1.32)#4,982 |
| 63. | Amherst | 3.1% | 2.1%(+0.955)#63 | 1.8%(+1.30)#5,016 |
| 64. | Harwich Center | 3.1% | 2.1%(+0.929)#64 | 1.8%(+1.28)#5,066 |
| 65. | Norton Center | 3.0% | 2.1%(+0.886)#65 | 1.8%(+1.23)#5,187 |
| 66. | Buzzards Bay | 3.0% | 2.1%(+0.858)#66 | 1.8%(+1.20)#5,269 |
| 67. | Barnstable Town | 2.9% | 2.1%(+0.802)#67 | 1.8%(+1.15)#5,427 |
| 68. | Great Barrington | 2.9% | 2.1%(+0.787)#68 | 1.8%(+1.13)#5,470 |
| 69. | West Yarmouth | 2.9% | 2.1%(+0.785)#69 | 1.8%(+1.13)#5,479 |
| 70. | Fall River | 2.9% | 2.1%(+0.761)#70 | 1.8%(+1.11)#5,563 |
| 71. | Abington | 2.9% | 2.1%(+0.744)#71 | 1.8%(+1.09)#5,615 |
| 72. | Longmeadow | 2.9% | 2.1%(+0.729)#72 | 1.8%(+1.08)#5,646 |
| 73. | Wilmington | 2.8% | 2.1%(+0.643)#73 | 1.8%(+0.989)#5,928 |
| 74. | Monson Center | 2.7% | 2.1%(+0.603)#74 | 1.8%(+0.950)#6,037 |
| 75. | Upton | 2.7% | 2.1%(+0.576)#75 | 1.8%(+0.922)#6,136 |
| 76. | Fiskdale | 2.7% | 2.1%(+0.551)#76 | 1.8%(+0.898)#6,217 |
| 77. | Cedar Crest | 2.7% | 2.1%(+0.545)#77 | 1.8%(+0.891)#6,242 |
| 78. | Ocean Bluff Brant Rock | 2.6% | 2.1%(+0.509)#78 | 1.8%(+0.855)#6,371 |
| 79. | Franklin Town | 2.6% | 2.1%(+0.458)#79 | 1.8%(+0.805)#6,556 |
| 80. | Hopkinton | 2.6% | 2.1%(+0.450)#80 | 1.8%(+0.797)#6,580 |
| 81. | Smith Mills | 2.6% | 2.1%(+0.441)#81 | 1.8%(+0.787)#6,620 |
| 82. | East Harwich | 2.6% | 2.1%(+0.438)#82 | 1.8%(+0.785)#6,628 |
| 83. | Andover | 2.6% | 2.1%(+0.427)#83 | 1.8%(+0.773)#6,676 |
| 84. | Rockport | 2.5% | 2.1%(+0.408)#84 | 1.8%(+0.754)#6,746 |
| 85. | Ocean Grove | 2.5% | 2.1%(+0.392)#85 | 1.8%(+0.739)#6,802 |
| 86. | Worcester | 2.4% | 2.1%(+0.313)#86 | 1.8%(+0.660)#7,075 |
| 87. | Melrose | 2.4% | 2.1%(+0.305)#87 | 1.8%(+0.652)#7,123 |
| 88. | Marblehead | 2.4% | 2.1%(+0.241)#88 | 1.8%(+0.587)#7,367 |
| 89. | Cochituate | 2.4% | 2.1%(+0.221)#89 | 1.8%(+0.568)#7,434 |
| 90. | Norwood | 2.3% | 2.1%(+0.205)#90 | 1.8%(+0.551)#7,505 |
| 91. | Dedham | 2.3% | 2.1%(+0.199)#91 | 1.8%(+0.545)#7,530 |
| 92. | Salem | 2.3% | 2.1%(+0.180)#92 | 1.8%(+0.527)#7,592 |
| 93. | Lynn | 2.3% | 2.1%(+0.166)#93 | 1.8%(+0.512)#7,656 |
| 94. | Boston | 2.3% | 2.1%(+0.164)#94 | 1.8%(+0.510)#7,667 |
| 95. | Beverly | 2.3% | 2.1%(+0.161)#95 | 1.8%(+0.507)#7,679 |
| 96. | Taunton | 2.3% | 2.1%(+0.154)#96 | 1.8%(+0.501)#7,709 |
| 97. | New Bedford | 2.2% | 2.1%(+0.105)#97 | 1.8%(+0.452)#7,948 |
| 98. | Acushnet Center | 2.2% | 2.1%(+0.104)#98 | 1.8%(+0.450)#7,953 |
| 99. | Medford | 2.2% | 2.1%(+0.093)#99 | 1.8%(+0.439)#8,004 |
| 100. | Haverhill | 2.2% | 2.1%(+0.085)#100 | 1.8%(+0.432)#8,033 |
Common Questions
What are the Top 10 Cities with the Highest Percentage of Population Employed in Education, Arts & Media in Massachusetts?
Top 10 Cities with the Highest Percentage of Population Employed in Education, Arts & Media in Massachusetts are:
#1
10.1%
#2
9.9%
#3
8.8%
#4
8.5%
#5
8.3%
#6
8.1%
#7
8.0%
#8
7.9%
#9
7.0%
#10
7.0%
What city has the Highest Percentage of Population Employed in Education, Arts & Media in Massachusetts?
Rowley has the Highest Percentage of Population Employed in Education, Arts & Media in Massachusetts with 10.1%.
What is the Percentage of Population Employed in Education, Arts & Media in the State of Massachusetts?
Percentage of Population Employed in Education, Arts & Media in Massachusetts is 2.1%.
What is the Percentage of Population Employed in Education, Arts & Media in the United States?
Percentage of Population Employed in Education, Arts & Media in the United States is 1.8%.