Cities with the Highest Percentage of Population Employed in Education, Arts & Media in Arkansas
RELATED REPORTS & OPTIONS
Education, Arts & Media
Arkansas
Compare Cities
Map of Cities with the Highest Percentage of Population Employed in Education, Arts & Media in Arkansas
0.0%
50.0%
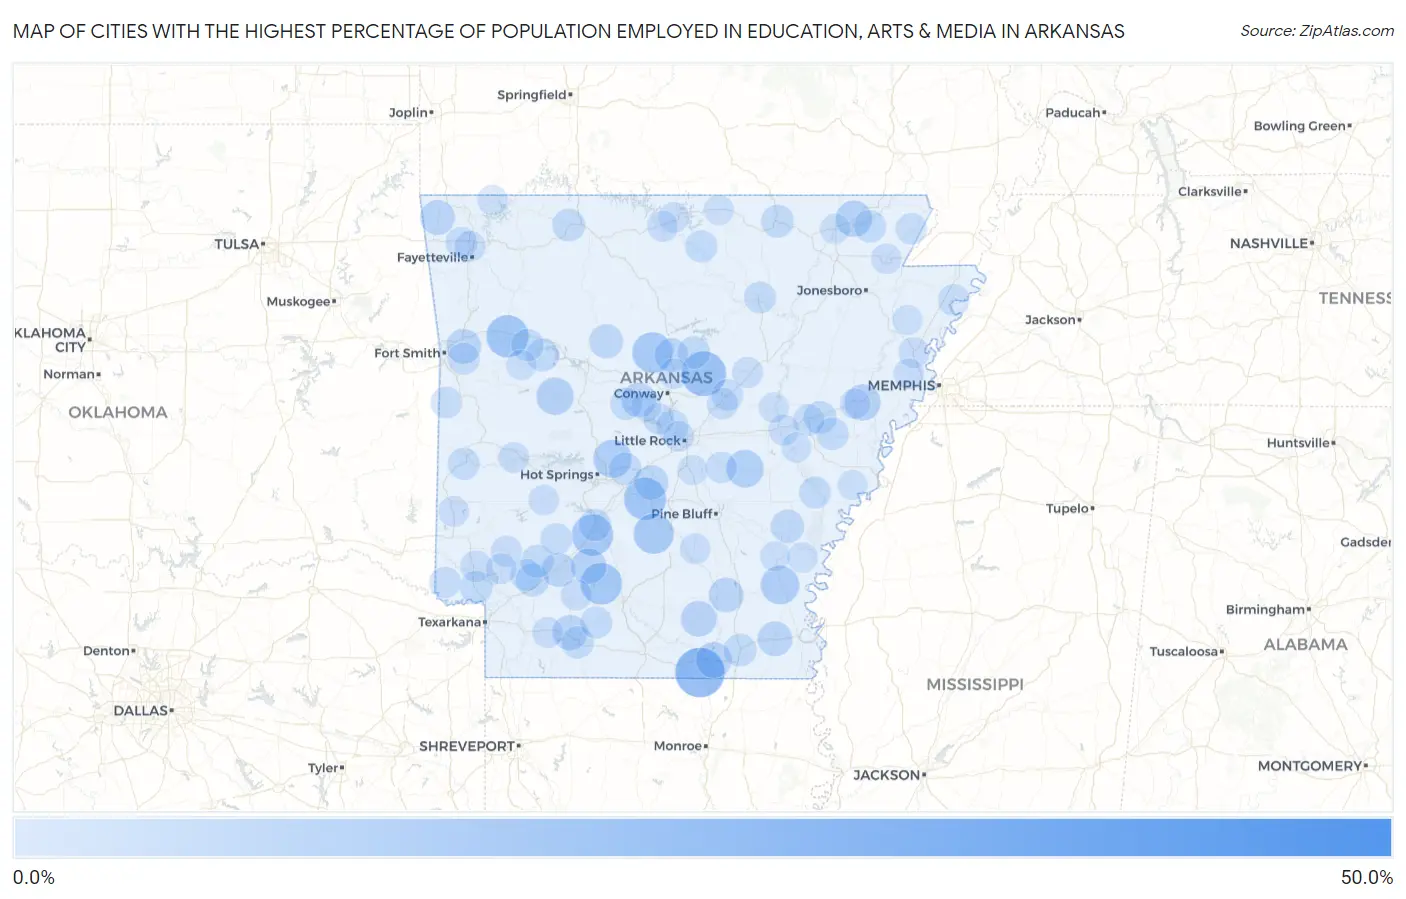
Cities with the Highest Percentage of Population Employed in Education, Arts & Media in Arkansas
| City | % Employed | vs State | vs National | |
| 1. | Morrow | 49.1% | 1.8% (+47.3)#1 | 1.8% (+47.3)#45 |
| 2. | Felsenthal | 25.0% | 1.8% (+23.2)#2 | 1.8% (+23.2)#144 |
| 3. | Mount Vernon | 19.5% | 1.8% (+17.7)#3 | 1.8% (+17.8)#224 |
| 4. | Ozark | 16.8% | 1.8% (+15.0)#4 | 1.8% (+15.0)#281 |
| 5. | Poyen | 16.7% | 1.8% (+14.8)#5 | 1.8% (+14.9)#285 |
| 6. | Chidester | 15.9% | 1.8% (+14.1)#6 | 1.8% (+14.1)#308 |
| 7. | Gum Springs | 15.8% | 1.8% (+14.0)#7 | 1.8% (+14.0)#314 |
| 8. | Center Ridge | 14.7% | 1.8% (+12.9)#8 | 1.8% (+12.9)#347 |
| 9. | Carthage | 14.3% | 1.8% (+12.5)#9 | 1.8% (+12.5)#361 |
| 10. | Reed | 12.5% | 1.8% (+10.7)#10 | 1.8% (+10.7)#448 |
| 11. | Fountain Lake | 12.1% | 1.8% (+10.3)#11 | 1.8% (+10.3)#474 |
| 12. | Humnoke | 11.3% | 1.8% (+9.50)#12 | 1.8% (+9.53)#518 |
| 13. | Payneway | 11.1% | 1.8% (+9.29)#13 | 1.8% (+9.33)#539 |
| 14. | Corinth | 11.1% | 1.8% (+9.29)#14 | 1.8% (+9.33)#546 |
| 15. | Biggers | 10.1% | 1.8% (+8.24)#15 | 1.8% (+8.27)#631 |
| 16. | Madison | 10.0% | 1.8% (+8.21)#16 | 1.8% (+8.24)#633 |
| 17. | West Crossett | 9.5% | 1.8% (+7.72)#17 | 1.8% (+7.75)#691 |
| 18. | Hermitage | 9.4% | 1.8% (+7.56)#18 | 1.8% (+7.59)#719 |
| 19. | Whelen Springs | 9.1% | 1.8% (+7.27)#19 | 1.8% (+7.30)#769 |
| 20. | Waldo | 8.6% | 1.8% (+6.79)#20 | 1.8% (+6.83)#846 |
| 21. | Decatur | 8.4% | 1.8% (+6.55)#21 | 1.8% (+6.58)#883 |
| 22. | Kibler | 8.4% | 1.8% (+6.54)#22 | 1.8% (+6.57)#886 |
| 23. | Montrose | 8.2% | 1.8% (+6.38)#23 | 1.8% (+6.41)#930 |
| 24. | Wilmar | 8.1% | 1.8% (+6.33)#24 | 1.8% (+6.36)#945 |
| 25. | Houston | 8.0% | 1.8% (+6.18)#25 | 1.8% (+6.21)#974 |
| 26. | Tull | 7.9% | 1.8% (+6.06)#26 | 1.8% (+6.09)#1,005 |
| 27. | Prescott | 7.6% | 1.8% (+5.74)#27 | 1.8% (+5.77)#1,079 |
| 28. | Hector | 7.4% | 1.8% (+5.55)#28 | 1.8% (+5.58)#1,136 |
| 29. | Damascus | 7.0% | 1.8% (+5.16)#29 | 1.8% (+5.19)#1,238 |
| 30. | Gillett | 6.8% | 1.8% (+5.03)#30 | 1.8% (+5.06)#1,287 |
| 31. | Oakhaven | 6.5% | 1.8% (+4.63)#31 | 1.8% (+4.67)#1,447 |
| 32. | Scranton | 6.3% | 1.8% (+4.48)#32 | 1.8% (+4.51)#1,512 |
| 33. | Hardy | 6.2% | 1.8% (+4.43)#33 | 1.8% (+4.46)#1,524 |
| 34. | Wheatley | 6.2% | 1.8% (+4.36)#34 | 1.8% (+4.39)#1,566 |
| 35. | Blevins | 6.1% | 1.8% (+4.32)#35 | 1.8% (+4.35)#1,580 |
| 36. | Alpena | 6.1% | 1.8% (+4.26)#36 | 1.8% (+4.29)#1,610 |
| 37. | Hamburg | 6.0% | 1.8% (+4.17)#37 | 1.8% (+4.20)#1,643 |
| 38. | Ashdown | 5.9% | 1.8% (+4.09)#38 | 1.8% (+4.12)#1,676 |
| 39. | Quitman | 5.9% | 1.8% (+4.05)#39 | 1.8% (+4.08)#1,705 |
| 40. | Moro | 5.8% | 1.8% (+4.02)#40 | 1.8% (+4.05)#1,720 |
| 41. | Genoa | 5.8% | 1.8% (+4.00)#41 | 1.8% (+4.03)#1,724 |
| 42. | Maumelle | 5.7% | 1.8% (+3.92)#42 | 1.8% (+3.96)#1,762 |
| 43. | Magnolia | 5.6% | 1.8% (+3.80)#43 | 1.8% (+3.83)#1,825 |
| 44. | Coal Hill | 5.6% | 1.8% (+3.74)#44 | 1.8% (+3.77)#1,857 |
| 45. | Lonsdale | 5.5% | 1.8% (+3.66)#45 | 1.8% (+3.69)#1,903 |
| 46. | Arkadelphia | 5.4% | 1.8% (+3.60)#46 | 1.8% (+3.63)#1,944 |
| 47. | Peach Orchard | 5.4% | 1.8% (+3.59)#47 | 1.8% (+3.62)#1,957 |
| 48. | Calico Rock | 5.4% | 1.8% (+3.56)#48 | 1.8% (+3.59)#1,966 |
| 49. | Perryville | 5.3% | 1.8% (+3.48)#49 | 1.8% (+3.51)#2,023 |
| 50. | Washington | 5.3% | 1.8% (+3.45)#50 | 1.8% (+3.48)#2,056 |
| 51. | Stephens | 5.2% | 1.8% (+3.38)#51 | 1.8% (+3.41)#2,097 |
| 52. | Batesville | 5.2% | 1.8% (+3.35)#52 | 1.8% (+3.38)#2,121 |
| 53. | St Charles | 5.1% | 1.8% (+3.31)#53 | 1.8% (+3.34)#2,153 |
| 54. | Mena | 5.1% | 1.8% (+3.28)#54 | 1.8% (+3.31)#2,177 |
| 55. | Central City | 5.1% | 1.8% (+3.25)#55 | 1.8% (+3.28)#2,206 |
| 56. | Luxora | 4.8% | 1.8% (+3.00)#56 | 1.8% (+3.03)#2,413 |
| 57. | Antoine | 4.8% | 1.8% (+2.95)#57 | 1.8% (+2.98)#2,453 |
| 58. | Ozark Acres | 4.7% | 1.8% (+2.90)#58 | 1.8% (+2.93)#2,501 |
| 59. | Ben Lomond | 4.7% | 1.8% (+2.89)#59 | 1.8% (+2.92)#2,508 |
| 60. | Beebe | 4.6% | 1.8% (+2.83)#60 | 1.8% (+2.86)#2,584 |
| 61. | Rector | 4.6% | 1.8% (+2.77)#61 | 1.8% (+2.80)#2,649 |
| 62. | Foreman | 4.5% | 1.8% (+2.69)#62 | 1.8% (+2.72)#2,725 |
| 63. | Brinkley | 4.5% | 1.8% (+2.65)#63 | 1.8% (+2.68)#2,769 |
| 64. | Ward | 4.5% | 1.8% (+2.65)#64 | 1.8% (+2.68)#2,771 |
| 65. | England | 4.4% | 1.8% (+2.61)#65 | 1.8% (+2.64)#2,809 |
| 66. | Tontitown | 4.4% | 1.8% (+2.59)#66 | 1.8% (+2.62)#2,824 |
| 67. | Roland | 4.4% | 1.8% (+2.57)#67 | 1.8% (+2.60)#2,842 |
| 68. | Hartford | 4.4% | 1.8% (+2.57)#68 | 1.8% (+2.60)#2,843 |
| 69. | Sardis | 4.3% | 1.8% (+2.46)#69 | 1.8% (+2.49)#2,956 |
| 70. | Cale | 4.2% | 1.8% (+2.35)#70 | 1.8% (+2.38)#3,089 |
| 71. | Nashville | 4.2% | 1.8% (+2.34)#71 | 1.8% (+2.37)#3,096 |
| 72. | Searcy | 4.1% | 1.8% (+2.30)#72 | 1.8% (+2.33)#3,138 |
| 73. | Johnson | 3.9% | 1.8% (+2.13)#73 | 1.8% (+2.16)#3,401 |
| 74. | Fredonia Biscoe | 3.8% | 1.8% (+2.03)#74 | 1.8% (+2.06)#3,539 |
| 75. | Mountain Home | 3.8% | 1.8% (+2.02)#75 | 1.8% (+2.05)#3,553 |
| 76. | Stamps | 3.8% | 1.8% (+2.01)#76 | 1.8% (+2.04)#3,572 |
| 77. | Turrell | 3.8% | 1.8% (+2.00)#77 | 1.8% (+2.03)#3,598 |
| 78. | Oden | 3.8% | 1.8% (+1.99)#78 | 1.8% (+2.02)#3,610 |
| 79. | Gassville | 3.8% | 1.8% (+1.97)#79 | 1.8% (+2.00)#3,640 |
| 80. | Cammack Village | 3.8% | 1.8% (+1.96)#80 | 1.8% (+1.99)#3,659 |
| 81. | Tollette | 3.8% | 1.8% (+1.96)#81 | 1.8% (+1.99)#3,670 |
| 82. | Glenwood | 3.7% | 1.8% (+1.88)#82 | 1.8% (+1.91)#3,794 |
| 83. | Grannis | 3.7% | 1.8% (+1.87)#83 | 1.8% (+1.90)#3,800 |
| 84. | Crawfordsville | 3.7% | 1.8% (+1.87)#84 | 1.8% (+1.90)#3,804 |
| 85. | Rison | 3.7% | 1.8% (+1.85)#85 | 1.8% (+1.88)#3,826 |
| 86. | Forrest City | 3.6% | 1.8% (+1.78)#86 | 1.8% (+1.81)#3,958 |
| 87. | Paragould | 3.6% | 1.8% (+1.76)#87 | 1.8% (+1.79)#3,984 |
| 88. | Watson | 3.5% | 1.8% (+1.69)#88 | 1.8% (+1.72)#4,125 |
| 89. | Greenbrier | 3.5% | 1.8% (+1.66)#89 | 1.8% (+1.69)#4,177 |
| 90. | Pocahontas | 3.3% | 1.8% (+1.46)#90 | 1.8% (+1.49)#4,575 |
| 91. | Paris | 3.2% | 1.8% (+1.42)#91 | 1.8% (+1.45)#4,644 |
| 92. | Lepanto | 3.2% | 1.8% (+1.41)#92 | 1.8% (+1.45)#4,656 |
| 93. | Clarendon | 3.2% | 1.8% (+1.41)#93 | 1.8% (+1.44)#4,665 |
| 94. | Garfield | 3.2% | 1.8% (+1.39)#94 | 1.8% (+1.42)#4,704 |
| 95. | Bigelow | 3.2% | 1.8% (+1.39)#95 | 1.8% (+1.42)#4,718 |
| 96. | Lake View | 3.2% | 1.8% (+1.37)#96 | 1.8% (+1.41)#4,753 |
| 97. | Viola | 3.2% | 1.8% (+1.37)#97 | 1.8% (+1.41)#4,756 |
| 98. | Woodson | 3.2% | 1.8% (+1.36)#98 | 1.8% (+1.39)#4,789 |
| 99. | Mitchellville | 3.2% | 1.8% (+1.36)#99 | 1.8% (+1.39)#4,795 |
| 100. | Des Arc | 3.2% | 1.8% (+1.34)#100 | 1.8% (+1.37)#4,831 |
Common Questions
What are the Top 10 Cities with the Highest Percentage of Population Employed in Education, Arts & Media in Arkansas?
Top 10 Cities with the Highest Percentage of Population Employed in Education, Arts & Media in Arkansas are:
#1
25.0%
#2
19.5%
#3
16.8%
#4
16.7%
#5
15.9%
#6
15.8%
#7
14.7%
#8
14.3%
#9
12.5%
#10
12.1%
What city has the Highest Percentage of Population Employed in Education, Arts & Media in Arkansas?
Felsenthal has the Highest Percentage of Population Employed in Education, Arts & Media in Arkansas with 25.0%.
What is the Percentage of Population Employed in Education, Arts & Media in the State of Arkansas?
Percentage of Population Employed in Education, Arts & Media in Arkansas is 1.8%.
What is the Percentage of Population Employed in Education, Arts & Media in the United States?
Percentage of Population Employed in Education, Arts & Media in the United States is 1.8%.