Cities with the Highest Percentage of Population Employed in Education, Arts & Media in Ohio
RELATED REPORTS & OPTIONS
Education, Arts & Media
Ohio
Compare Cities
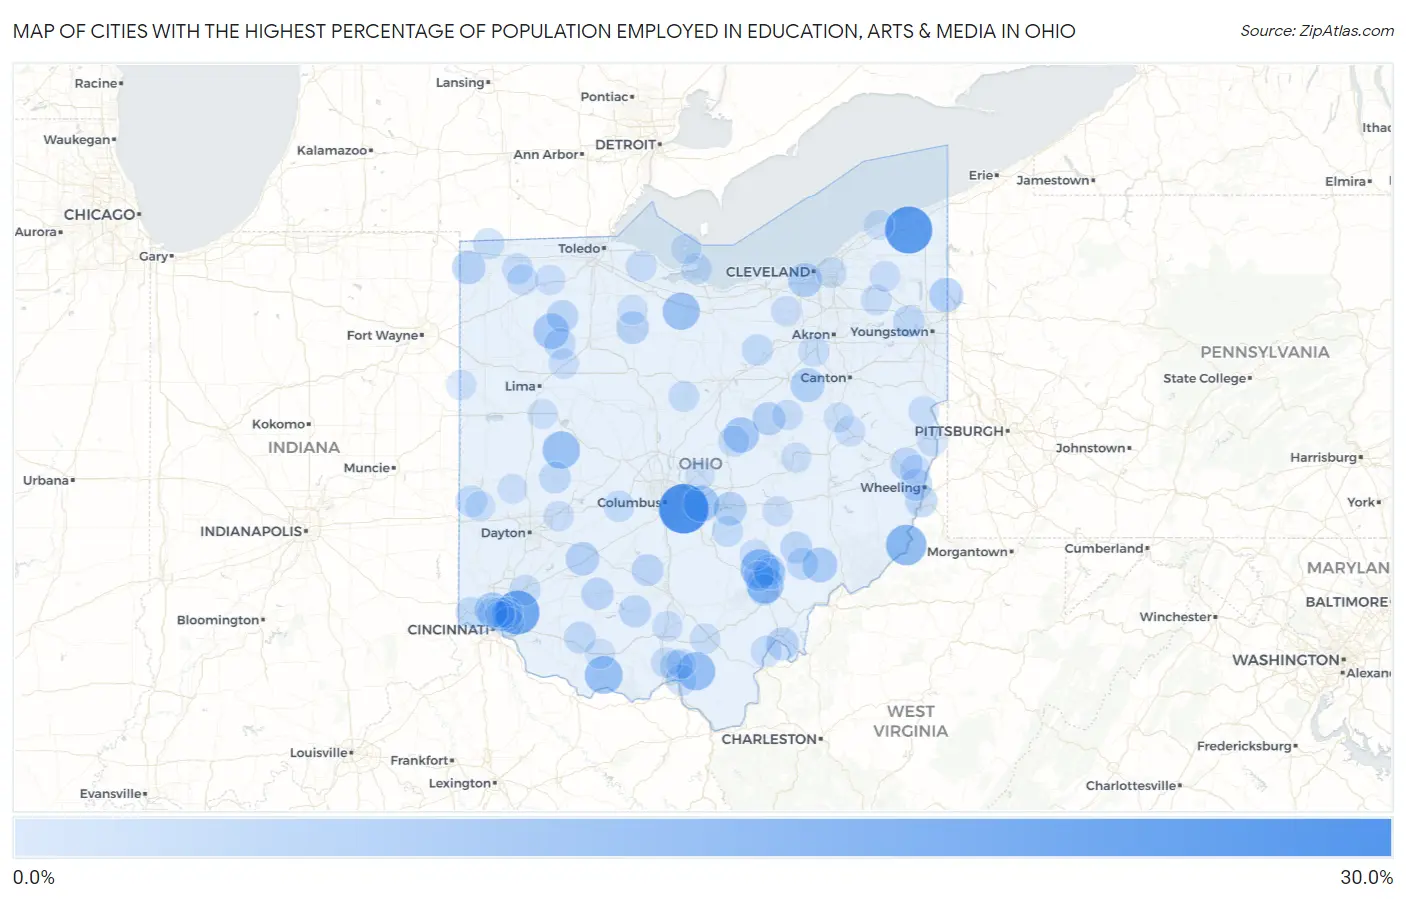
Map of Cities with the Highest Percentage of Population Employed in Education, Arts & Media in Ohio
0.0%
30.0%
Cities with the Highest Percentage of Population Employed in Education, Arts & Media in Ohio
| City | % Employed | vs State | vs National | |
| 1. | Brice | 27.7% | 1.8%(+25.8)#1 | 1.8%(+25.9)#127 |
| 2. | Austinburg | 24.6% | 1.8%(+22.7)#2 | 1.8%(+22.8)#149 |
| 3. | East Alliance | 20.8% | 1.8%(+19.0)#3 | 1.8%(+19.0)#196 |
| 4. | Miamiville | 20.6% | 1.8%(+18.8)#4 | 1.8%(+18.8)#201 |
| 5. | Hannibal | 16.4% | 1.8%(+14.6)#5 | 1.8%(+14.6)#299 |
| 6. | Murray City | 14.6% | 1.8%(+12.7)#6 | 1.8%(+12.8)#352 |
| 7. | South Webster | 13.7% | 1.8%(+11.9)#7 | 1.8%(+11.9)#388 |
| 8. | West Union | 13.3% | 1.8%(+11.5)#8 | 1.8%(+11.5)#402 |
| 9. | Nankin | 13.2% | 1.8%(+11.4)#9 | 1.8%(+11.4)#408 |
| 10. | De Graff | 12.8% | 1.8%(+10.9)#10 | 1.8%(+11.0)#438 |
| 11. | Flat Rock | 12.5% | 1.8%(+10.7)#11 | 1.8%(+10.7)#445 |
| 12. | Chauncey | 12.3% | 1.8%(+10.5)#12 | 1.8%(+10.5)#464 |
| 13. | Etna | 11.3% | 1.8%(+9.45)#13 | 1.8%(+9.50)#520 |
| 14. | Guilford Lake | 11.2% | 1.8%(+9.34)#14 | 1.8%(+9.38)#531 |
| 15. | West Leipsic | 10.6% | 1.8%(+8.78)#15 | 1.8%(+8.82)#587 |
| 16. | Howard | 10.4% | 1.8%(+8.55)#16 | 1.8%(+8.59)#608 |
| 17. | Pleasant Hills | 10.0% | 1.8%(+8.19)#17 | 1.8%(+8.23)#634 |
| 18. | Waterford | 9.7% | 1.8%(+7.91)#18 | 1.8%(+7.95)#667 |
| 19. | Medway | 9.6% | 1.8%(+7.73)#19 | 1.8%(+7.77)#688 |
| 20. | Ridgewood | 9.0% | 1.8%(+7.21)#20 | 1.8%(+7.25)#774 |
| 21. | Linndale | 9.0% | 1.8%(+7.13)#21 | 1.8%(+7.17)#785 |
| 22. | Orangeville | 8.9% | 1.8%(+7.06)#22 | 1.8%(+7.10)#797 |
| 23. | Kidron | 8.7% | 1.8%(+6.90)#23 | 1.8%(+6.94)#818 |
| 24. | Thornport | 8.2% | 1.8%(+6.39)#24 | 1.8%(+6.43)#924 |
| 25. | Bowersville | 8.1% | 1.8%(+6.32)#25 | 1.8%(+6.36)#946 |
| 26. | North Lima | 8.0% | 1.8%(+6.17)#26 | 1.8%(+6.21)#971 |
| 27. | Blakeslee | 8.0% | 1.8%(+6.17)#27 | 1.8%(+6.21)#978 |
| 28. | Glenmont | 7.7% | 1.8%(+5.86)#28 | 1.8%(+5.91)#1,039 |
| 29. | Syracuse | 7.4% | 1.8%(+5.62)#29 | 1.8%(+5.66)#1,115 |
| 30. | Bascom | 7.4% | 1.8%(+5.55)#30 | 1.8%(+5.59)#1,132 |
| 31. | Woodworth | 7.1% | 1.8%(+5.23)#31 | 1.8%(+5.27)#1,217 |
| 32. | Highland | 6.8% | 1.8%(+5.02)#32 | 1.8%(+5.06)#1,289 |
| 33. | Clarktown | 6.8% | 1.8%(+4.99)#33 | 1.8%(+5.03)#1,295 |
| 34. | Bainbridge | 6.8% | 1.8%(+4.98)#34 | 1.8%(+5.02)#1,299 |
| 35. | Shadyside | 6.8% | 1.8%(+4.94)#35 | 1.8%(+4.98)#1,314 |
| 36. | Deshler | 6.6% | 1.8%(+4.78)#36 | 1.8%(+4.82)#1,374 |
| 37. | Lansing | 6.6% | 1.8%(+4.78)#37 | 1.8%(+4.82)#1,375 |
| 38. | Mcconnelsville | 6.5% | 1.8%(+4.68)#38 | 1.8%(+4.72)#1,413 |
| 39. | Clarksburg | 6.5% | 1.8%(+4.62)#39 | 1.8%(+4.67)#1,437 |
| 40. | Adena | 6.5% | 1.8%(+4.62)#40 | 1.8%(+4.67)#1,438 |
| 41. | Mowrystown | 6.4% | 1.8%(+4.59)#41 | 1.8%(+4.64)#1,465 |
| 42. | Glouster | 6.3% | 1.8%(+4.48)#42 | 1.8%(+4.52)#1,503 |
| 43. | Lordstown | 6.3% | 1.8%(+4.48)#43 | 1.8%(+4.52)#1,505 |
| 44. | Stockport | 6.2% | 1.8%(+4.37)#44 | 1.8%(+4.41)#1,554 |
| 45. | St Paris | 6.2% | 1.8%(+4.36)#45 | 1.8%(+4.40)#1,556 |
| 46. | Silverton | 6.2% | 1.8%(+4.34)#46 | 1.8%(+4.38)#1,570 |
| 47. | The Plains | 6.0% | 1.8%(+4.17)#47 | 1.8%(+4.22)#1,638 |
| 48. | New Madison | 5.9% | 1.8%(+4.12)#48 | 1.8%(+4.16)#1,654 |
| 49. | Jacksonville | 5.9% | 1.8%(+4.09)#49 | 1.8%(+4.13)#1,670 |
| 50. | Cinnamon Lake | 5.8% | 1.8%(+4.00)#50 | 1.8%(+4.05)#1,721 |
| 51. | Gilboa | 5.8% | 1.8%(+4.00)#51 | 1.8%(+4.04)#1,723 |
| 52. | Miamitown | 5.7% | 1.8%(+3.85)#52 | 1.8%(+3.89)#1,791 |
| 53. | Marblehead | 5.7% | 1.8%(+3.83)#53 | 1.8%(+3.87)#1,800 |
| 54. | West Rushville | 5.6% | 1.8%(+3.78)#54 | 1.8%(+3.82)#1,831 |
| 55. | Gambier | 5.6% | 1.8%(+3.77)#55 | 1.8%(+3.81)#1,839 |
| 56. | Cheshire | 5.6% | 1.8%(+3.73)#56 | 1.8%(+3.77)#1,868 |
| 57. | Archbold | 5.5% | 1.8%(+3.68)#57 | 1.8%(+3.72)#1,887 |
| 58. | Lafayette | 5.5% | 1.8%(+3.65)#58 | 1.8%(+3.69)#1,904 |
| 59. | Pioneer | 5.4% | 1.8%(+3.60)#59 | 1.8%(+3.64)#1,936 |
| 60. | Sciotodale | 5.4% | 1.8%(+3.60)#60 | 1.8%(+3.64)#1,937 |
| 61. | Rossmoyne | 5.4% | 1.8%(+3.57)#61 | 1.8%(+3.61)#1,958 |
| 62. | Iberia | 5.3% | 1.8%(+3.48)#62 | 1.8%(+3.52)#2,015 |
| 63. | Ridgeville Corners | 5.3% | 1.8%(+3.44)#63 | 1.8%(+3.48)#2,046 |
| 64. | South Lebanon | 5.2% | 1.8%(+3.36)#64 | 1.8%(+3.40)#2,107 |
| 65. | Rocky Ridge | 5.2% | 1.8%(+3.35)#65 | 1.8%(+3.39)#2,116 |
| 66. | Mariemont | 5.2% | 1.8%(+3.34)#66 | 1.8%(+3.38)#2,124 |
| 67. | Doylestown | 5.1% | 1.8%(+3.27)#67 | 1.8%(+3.31)#2,171 |
| 68. | Shawnee | 5.1% | 1.8%(+3.24)#68 | 1.8%(+3.28)#2,207 |
| 69. | Hiram | 5.1% | 1.8%(+3.23)#69 | 1.8%(+3.27)#2,212 |
| 70. | Lucasville | 5.0% | 1.8%(+3.20)#70 | 1.8%(+3.24)#2,230 |
| 71. | University Heights | 4.9% | 1.8%(+3.09)#71 | 1.8%(+3.13)#2,325 |
| 72. | Millersburg | 4.9% | 1.8%(+3.08)#72 | 1.8%(+3.12)#2,332 |
| 73. | Irondale | 4.9% | 1.8%(+3.07)#73 | 1.8%(+3.12)#2,336 |
| 74. | Jackson | 4.9% | 1.8%(+3.07)#74 | 1.8%(+3.11)#2,339 |
| 75. | Steubenville | 4.9% | 1.8%(+3.03)#75 | 1.8%(+3.07)#2,376 |
| 76. | Waverly | 4.8% | 1.8%(+3.02)#76 | 1.8%(+3.06)#2,392 |
| 77. | Arlington Heights | 4.8% | 1.8%(+2.99)#77 | 1.8%(+3.03)#2,415 |
| 78. | Midvale | 4.8% | 1.8%(+2.98)#78 | 1.8%(+3.02)#2,423 |
| 79. | Bluffton | 4.8% | 1.8%(+2.97)#79 | 1.8%(+3.02)#2,431 |
| 80. | Middlefield | 4.8% | 1.8%(+2.93)#80 | 1.8%(+2.97)#2,461 |
| 81. | Valley City | 4.7% | 1.8%(+2.89)#81 | 1.8%(+2.93)#2,495 |
| 82. | South Zanesville | 4.7% | 1.8%(+2.82)#82 | 1.8%(+2.87)#2,563 |
| 83. | Put In Bay | 4.7% | 1.8%(+2.82)#83 | 1.8%(+2.87)#2,573 |
| 84. | Enon | 4.6% | 1.8%(+2.80)#84 | 1.8%(+2.84)#2,599 |
| 85. | Buchtel | 4.6% | 1.8%(+2.79)#85 | 1.8%(+2.83)#2,612 |
| 86. | Mount Pleasant | 4.6% | 1.8%(+2.79)#86 | 1.8%(+2.83)#2,614 |
| 87. | Liberty Center | 4.6% | 1.8%(+2.76)#87 | 1.8%(+2.80)#2,646 |
| 88. | Minford | 4.5% | 1.8%(+2.67)#88 | 1.8%(+2.71)#2,735 |
| 89. | Golf Manor | 4.5% | 1.8%(+2.67)#89 | 1.8%(+2.71)#2,737 |
| 90. | St Johns | 4.5% | 1.8%(+2.65)#90 | 1.8%(+2.69)#2,755 |
| 91. | Kansas | 4.5% | 1.8%(+2.65)#91 | 1.8%(+2.69)#2,759 |
| 92. | Willshire | 4.5% | 1.8%(+2.63)#92 | 1.8%(+2.67)#2,784 |
| 93. | Dover | 4.4% | 1.8%(+2.62)#93 | 1.8%(+2.66)#2,789 |
| 94. | Finneytown | 4.4% | 1.8%(+2.62)#94 | 1.8%(+2.66)#2,790 |
| 95. | Castine | 4.4% | 1.8%(+2.62)#95 | 1.8%(+2.66)#2,792 |
| 96. | Seaman | 4.4% | 1.8%(+2.60)#96 | 1.8%(+2.65)#2,800 |
| 97. | North Perry | 4.4% | 1.8%(+2.60)#97 | 1.8%(+2.64)#2,801 |
| 98. | Coshocton | 4.4% | 1.8%(+2.57)#98 | 1.8%(+2.62)#2,829 |
| 99. | Johnstown | 4.3% | 1.8%(+2.48)#99 | 1.8%(+2.52)#2,920 |
| 100. | Pleasant Hill | 4.3% | 1.8%(+2.47)#100 | 1.8%(+2.51)#2,927 |
Common Questions
What are the Top 10 Cities with the Highest Percentage of Population Employed in Education, Arts & Media in Ohio?
Top 10 Cities with the Highest Percentage of Population Employed in Education, Arts & Media in Ohio are:
#1
27.7%
#2
24.6%
#3
20.6%
#4
16.4%
#5
14.6%
#6
13.7%
#7
13.3%
#8
12.8%
#9
12.5%
#10
12.3%
What city has the Highest Percentage of Population Employed in Education, Arts & Media in Ohio?
Brice has the Highest Percentage of Population Employed in Education, Arts & Media in Ohio with 27.7%.
What is the Percentage of Population Employed in Education, Arts & Media in the State of Ohio?
Percentage of Population Employed in Education, Arts & Media in Ohio is 1.8%.
What is the Percentage of Population Employed in Education, Arts & Media in the United States?
Percentage of Population Employed in Education, Arts & Media in the United States is 1.8%.