Cities with the Highest Percentage of Population Employed in Education, Arts & Media in New York
RELATED REPORTS & OPTIONS
Education, Arts & Media
New York
Compare Cities
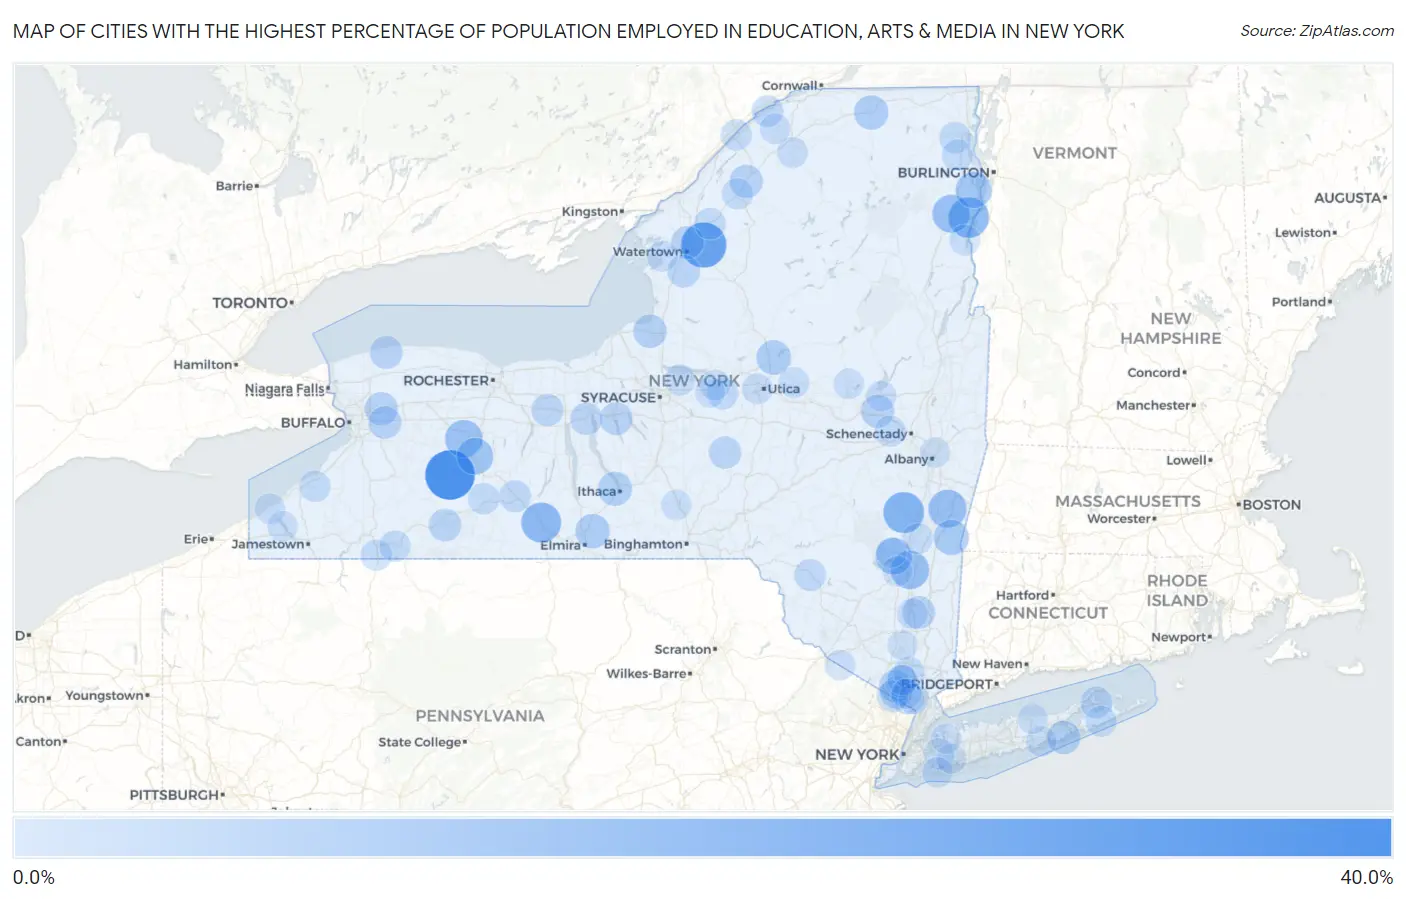
Map of Cities with the Highest Percentage of Population Employed in Education, Arts & Media in New York
0.0%
40.0%
Cities with the Highest Percentage of Population Employed in Education, Arts & Media in New York
| City | % Employed | vs State | vs National | |
| 1. | Hunt | 35.0% | 2.2%(+32.8)#1 | 1.8%(+33.2)#87 |
| 2. | Cementon | 33.8% | 2.2%(+31.6)#2 | 1.8%(+32.0)#92 |
| 3. | Felts Mills | 28.3% | 2.2%(+26.1)#3 | 1.8%(+26.5)#123 |
| 4. | Slaterville Springs | 21.7% | 2.2%(+19.6)#4 | 1.8%(+20.0)#179 |
| 5. | Cairo | 21.6% | 2.2%(+19.4)#5 | 1.8%(+19.8)#183 |
| 6. | Westport | 20.9% | 2.2%(+18.7)#6 | 1.8%(+19.1)#194 |
| 7. | Campbell | 20.0% | 2.2%(+17.8)#7 | 1.8%(+18.2)#206 |
| 8. | Fallsburg | 18.1% | 2.2%(+16.0)#8 | 1.8%(+16.4)#247 |
| 9. | Rhinecliff | 17.5% | 2.2%(+15.3)#9 | 1.8%(+15.7)#262 |
| 10. | Ghent | 17.1% | 2.2%(+14.9)#10 | 1.8%(+15.3)#272 |
| 11. | Elizabethtown | 16.9% | 2.2%(+14.7)#11 | 1.8%(+15.1)#278 |
| 12. | Cuylerville | 16.4% | 2.2%(+14.2)#12 | 1.8%(+14.6)#300 |
| 13. | Zena | 15.1% | 2.2%(+12.9)#13 | 1.8%(+13.3)#336 |
| 14. | Groveland Station | 15.0% | 2.2%(+12.8)#14 | 1.8%(+13.2)#339 |
| 15. | Willsboro | 14.3% | 2.2%(+12.2)#15 | 1.8%(+12.5)#357 |
| 16. | Copake Lake | 12.9% | 2.2%(+10.7)#16 | 1.8%(+11.1)#433 |
| 17. | Prospect | 12.0% | 2.2%(+9.87)#17 | 1.8%(+10.3)#478 |
| 18. | Breesport | 11.6% | 2.2%(+9.48)#18 | 1.8%(+9.86)#496 |
| 19. | Malone | 11.5% | 2.2%(+9.36)#19 | 1.8%(+9.74)#507 |
| 20. | Northwest Ithaca | 11.1% | 2.2%(+8.98)#20 | 1.8%(+9.35)#533 |
| 21. | Mexico | 10.2% | 2.2%(+8.06)#21 | 1.8%(+8.43)#621 |
| 22. | Quogue | 10.2% | 2.2%(+8.02)#22 | 1.8%(+8.39)#624 |
| 23. | Richville | 10.0% | 2.2%(+7.84)#23 | 1.8%(+8.21)#636 |
| 24. | Jacksonville | 10.0% | 2.2%(+7.80)#24 | 1.8%(+8.18)#649 |
| 25. | Clarence | 10.0% | 2.2%(+7.80)#25 | 1.8%(+8.18)#650 |
| 26. | Fort Johnson | 9.7% | 2.2%(+7.58)#26 | 1.8%(+7.96)#666 |
| 27. | West Nyack | 9.7% | 2.2%(+7.55)#27 | 1.8%(+7.93)#670 |
| 28. | Red Oaks Mill | 9.5% | 2.2%(+7.37)#28 | 1.8%(+7.75)#692 |
| 29. | Pamelia Center | 9.5% | 2.2%(+7.36)#29 | 1.8%(+7.74)#694 |
| 30. | Fly Creek | 9.5% | 2.2%(+7.32)#30 | 1.8%(+7.70)#702 |
| 31. | Town Line | 9.3% | 2.2%(+7.18)#31 | 1.8%(+7.56)#727 |
| 32. | Barker | 9.3% | 2.2%(+7.10)#32 | 1.8%(+7.48)#740 |
| 33. | Melrose Park | 9.2% | 2.2%(+7.07)#33 | 1.8%(+7.44)#746 |
| 34. | Belmont | 9.0% | 2.2%(+6.83)#34 | 1.8%(+7.21)#779 |
| 35. | Rodman | 9.0% | 2.2%(+6.81)#35 | 1.8%(+7.19)#783 |
| 36. | Smyrna | 8.7% | 2.2%(+6.59)#36 | 1.8%(+6.96)#816 |
| 37. | Wesley Hills | 8.6% | 2.2%(+6.40)#37 | 1.8%(+6.77)#856 |
| 38. | Kaser | 8.5% | 2.2%(+6.34)#38 | 1.8%(+6.72)#861 |
| 39. | Clifton Springs | 8.4% | 2.2%(+6.27)#39 | 1.8%(+6.65)#870 |
| 40. | Mount Ivy | 8.4% | 2.2%(+6.22)#40 | 1.8%(+6.59)#878 |
| 41. | Seneca Falls | 8.4% | 2.2%(+6.19)#41 | 1.8%(+6.57)#885 |
| 42. | Walworth | 8.3% | 2.2%(+6.13)#42 | 1.8%(+6.51)#904 |
| 43. | Avoca | 8.2% | 2.2%(+6.00)#43 | 1.8%(+6.38)#938 |
| 44. | Shelter Island | 7.9% | 2.2%(+5.69)#44 | 1.8%(+6.07)#1,008 |
| 45. | Waddington | 7.7% | 2.2%(+5.55)#45 | 1.8%(+5.93)#1,033 |
| 46. | Livingston Manor | 7.7% | 2.2%(+5.55)#46 | 1.8%(+5.93)#1,034 |
| 47. | Airmont | 7.6% | 2.2%(+5.41)#47 | 1.8%(+5.78)#1,076 |
| 48. | Philadelphia | 7.5% | 2.2%(+5.34)#48 | 1.8%(+5.71)#1,094 |
| 49. | Sherrill | 7.5% | 2.2%(+5.31)#49 | 1.8%(+5.69)#1,108 |
| 50. | Verplanck | 7.4% | 2.2%(+5.27)#50 | 1.8%(+5.65)#1,116 |
| 51. | Morrisonville | 7.4% | 2.2%(+5.25)#51 | 1.8%(+5.63)#1,120 |
| 52. | Arkport | 7.3% | 2.2%(+5.13)#52 | 1.8%(+5.51)#1,148 |
| 53. | Brewster Heights | 7.3% | 2.2%(+5.09)#53 | 1.8%(+5.47)#1,156 |
| 54. | Danby | 7.1% | 2.2%(+4.93)#54 | 1.8%(+5.31)#1,207 |
| 55. | Millwood | 7.1% | 2.2%(+4.93)#55 | 1.8%(+5.30)#1,208 |
| 56. | Sagaponack | 7.1% | 2.2%(+4.92)#56 | 1.8%(+5.30)#1,210 |
| 57. | Forestville | 7.0% | 2.2%(+4.88)#57 | 1.8%(+5.26)#1,222 |
| 58. | Ogdensburg | 7.0% | 2.2%(+4.87)#58 | 1.8%(+5.25)#1,223 |
| 59. | Limestone | 7.0% | 2.2%(+4.83)#59 | 1.8%(+5.20)#1,234 |
| 60. | St Bonaventure | 6.9% | 2.2%(+4.77)#60 | 1.8%(+5.15)#1,257 |
| 61. | Gouverneur | 6.9% | 2.2%(+4.76)#61 | 1.8%(+5.14)#1,259 |
| 62. | Peru | 6.9% | 2.2%(+4.73)#62 | 1.8%(+5.11)#1,267 |
| 63. | Mariaville Lake | 6.8% | 2.2%(+4.67)#63 | 1.8%(+5.05)#1,291 |
| 64. | Middleville | 6.7% | 2.2%(+4.53)#64 | 1.8%(+4.91)#1,338 |
| 65. | South Floral Park | 6.6% | 2.2%(+4.48)#65 | 1.8%(+4.85)#1,367 |
| 66. | Bridgeport | 6.6% | 2.2%(+4.40)#66 | 1.8%(+4.77)#1,394 |
| 67. | New York Mills | 6.6% | 2.2%(+4.40)#67 | 1.8%(+4.77)#1,396 |
| 68. | Port Henry | 6.6% | 2.2%(+4.39)#68 | 1.8%(+4.77)#1,397 |
| 69. | Macdonnell Heights | 6.5% | 2.2%(+4.32)#69 | 1.8%(+4.70)#1,423 |
| 70. | Rosendale | 6.5% | 2.2%(+4.32)#70 | 1.8%(+4.70)#1,426 |
| 71. | Crown Heights | 6.4% | 2.2%(+4.26)#71 | 1.8%(+4.64)#1,460 |
| 72. | Hannawa Falls | 6.4% | 2.2%(+4.24)#72 | 1.8%(+4.62)#1,474 |
| 73. | Germantown | 6.4% | 2.2%(+4.24)#73 | 1.8%(+4.62)#1,475 |
| 74. | Sackets Harbor | 6.3% | 2.2%(+4.14)#74 | 1.8%(+4.51)#1,507 |
| 75. | South Nyack | 6.3% | 2.2%(+4.12)#75 | 1.8%(+4.49)#1,518 |
| 76. | Durhamville | 6.2% | 2.2%(+4.09)#76 | 1.8%(+4.46)#1,525 |
| 77. | Mountain Dale | 6.2% | 2.2%(+4.09)#77 | 1.8%(+4.46)#1,529 |
| 78. | Madrid | 6.2% | 2.2%(+4.07)#78 | 1.8%(+4.45)#1,540 |
| 79. | Bard College | 6.2% | 2.2%(+4.06)#79 | 1.8%(+4.44)#1,543 |
| 80. | Caroga Lake | 6.2% | 2.2%(+4.00)#80 | 1.8%(+4.37)#1,574 |
| 81. | Hurleyville | 6.1% | 2.2%(+3.91)#81 | 1.8%(+4.29)#1,612 |
| 82. | Broadalbin | 5.9% | 2.2%(+3.73)#82 | 1.8%(+4.10)#1,680 |
| 83. | Kiamesha Lake | 5.9% | 2.2%(+3.72)#83 | 1.8%(+4.10)#1,687 |
| 84. | East Atlantic Beach | 5.9% | 2.2%(+3.70)#84 | 1.8%(+4.07)#1,706 |
| 85. | Unionville | 5.9% | 2.2%(+3.69)#85 | 1.8%(+4.07)#1,710 |
| 86. | Center Moriches | 5.8% | 2.2%(+3.65)#86 | 1.8%(+4.02)#1,725 |
| 87. | Westfield | 5.8% | 2.2%(+3.61)#87 | 1.8%(+3.98)#1,747 |
| 88. | Chautauqua | 5.8% | 2.2%(+3.61)#88 | 1.8%(+3.98)#1,750 |
| 89. | Woodstock | 5.7% | 2.2%(+3.54)#89 | 1.8%(+3.92)#1,773 |
| 90. | Hurley | 5.7% | 2.2%(+3.52)#90 | 1.8%(+3.90)#1,783 |
| 91. | Hamilton College | 5.7% | 2.2%(+3.50)#91 | 1.8%(+3.88)#1,792 |
| 92. | Lisle | 5.7% | 2.2%(+3.50)#92 | 1.8%(+3.87)#1,796 |
| 93. | Thiells | 5.6% | 2.2%(+3.48)#93 | 1.8%(+3.85)#1,810 |
| 94. | Wampsville | 5.6% | 2.2%(+3.41)#94 | 1.8%(+3.79)#1,847 |
| 95. | Menands | 5.6% | 2.2%(+3.41)#95 | 1.8%(+3.78)#1,850 |
| 96. | Roosevelt | 5.6% | 2.2%(+3.40)#96 | 1.8%(+3.78)#1,852 |
| 97. | Greenvale | 5.6% | 2.2%(+3.39)#97 | 1.8%(+3.77)#1,855 |
| 98. | East Shoreham | 5.5% | 2.2%(+3.38)#98 | 1.8%(+3.76)#1,874 |
| 99. | Bardonia | 5.5% | 2.2%(+3.35)#99 | 1.8%(+3.73)#1,882 |
| 100. | Cornwall On Hudson | 5.5% | 2.2%(+3.33)#100 | 1.8%(+3.71)#1,892 |
Common Questions
What are the Top 10 Cities with the Highest Percentage of Population Employed in Education, Arts & Media in New York?
Top 10 Cities with the Highest Percentage of Population Employed in Education, Arts & Media in New York are:
#1
35.0%
#2
28.3%
#3
21.6%
#4
20.9%
#5
20.0%
#6
17.5%
#7
17.1%
#8
16.9%
#9
16.4%
#10
15.1%
What city has the Highest Percentage of Population Employed in Education, Arts & Media in New York?
Hunt has the Highest Percentage of Population Employed in Education, Arts & Media in New York with 35.0%.
What is the Percentage of Population Employed in Education, Arts & Media in the State of New York?
Percentage of Population Employed in Education, Arts & Media in New York is 2.2%.
What is the Percentage of Population Employed in Education, Arts & Media in the United States?
Percentage of Population Employed in Education, Arts & Media in the United States is 1.8%.