Cities with the Highest Percentage of Population Employed in Education, Arts & Media in South Carolina
RELATED REPORTS & OPTIONS
Education, Arts & Media
South Carolina
Compare Cities
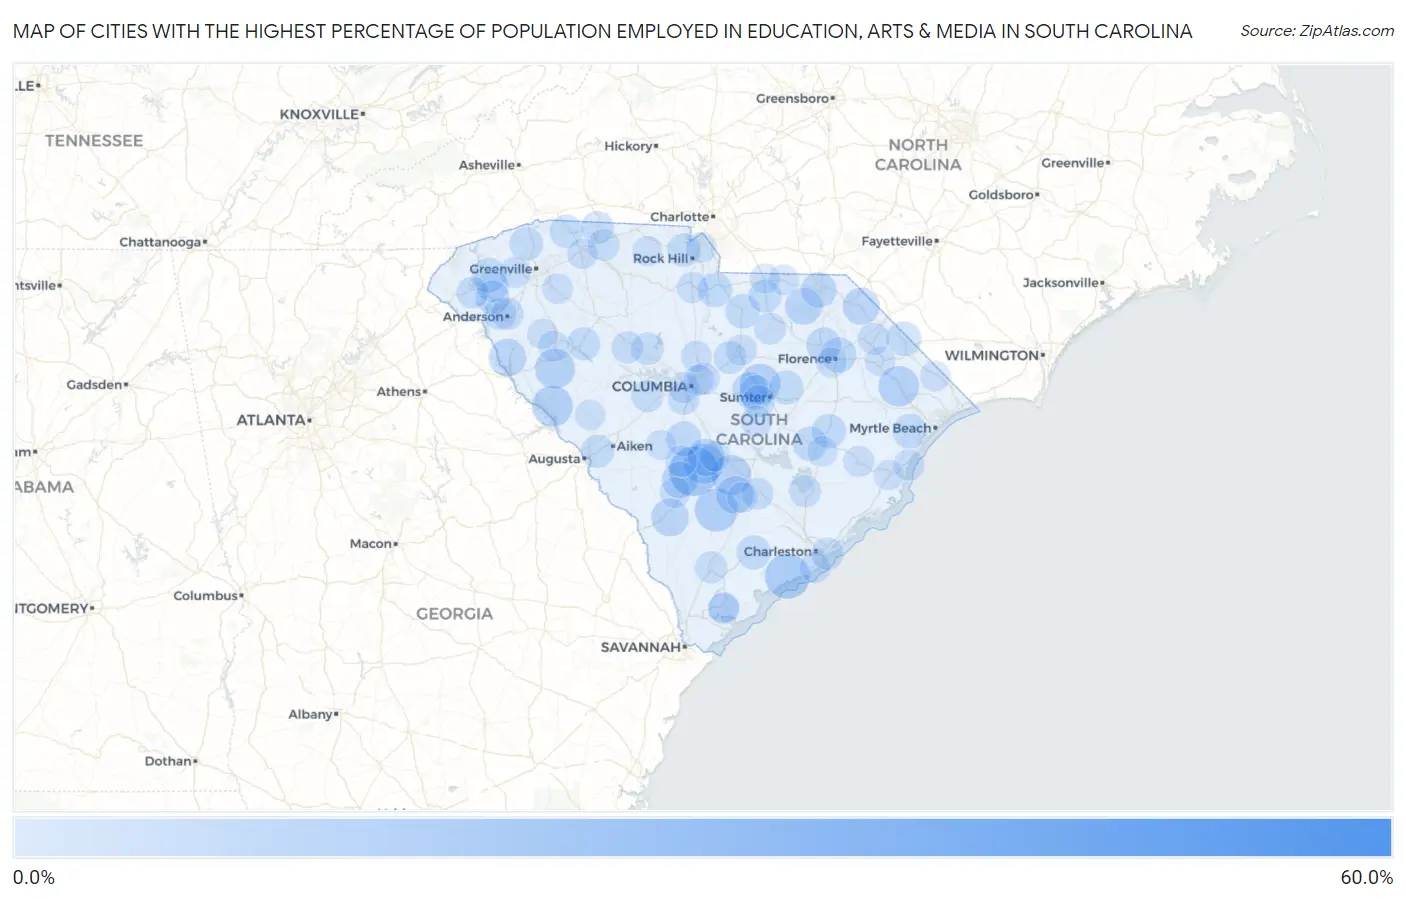
Map of Cities with the Highest Percentage of Population Employed in Education, Arts & Media in South Carolina
0.0%
60.0%
Cities with the Highest Percentage of Population Employed in Education, Arts & Media in South Carolina
| City | % Employed | vs State | vs National | |
| 1. | Caesars Head | 53.8% | 1.8%(+52.1)#1 | 1.8%(+52.1)#36 |
| 2. | Foreston | 30.0% | 1.8%(+28.2)#2 | 1.8%(+28.2)#109 |
| 3. | Cope | 18.2% | 1.8%(+16.4)#3 | 1.8%(+16.4)#246 |
| 4. | Rockville | 14.6% | 1.8%(+12.9)#4 | 1.8%(+12.8)#350 |
| 5. | Smoaks | 13.0% | 1.8%(+11.2)#5 | 1.8%(+11.2)#423 |
| 6. | Plum Branch | 11.1% | 1.8%(+9.34)#6 | 1.8%(+9.33)#541 |
| 7. | Aynor | 10.9% | 1.8%(+9.12)#7 | 1.8%(+9.10)#564 |
| 8. | Dalzell | 10.8% | 1.8%(+9.06)#8 | 1.8%(+9.05)#572 |
| 9. | Bowman | 10.7% | 1.8%(+8.95)#9 | 1.8%(+8.93)#580 |
| 10. | Cordova | 10.7% | 1.8%(+8.95)#10 | 1.8%(+8.93)#582 |
| 11. | Promised Land | 10.6% | 1.8%(+8.87)#11 | 1.8%(+8.85)#584 |
| 12. | Lobeco | 10.6% | 1.8%(+8.85)#12 | 1.8%(+8.83)#586 |
| 13. | East Camden | 10.3% | 1.8%(+8.52)#13 | 1.8%(+8.50)#614 |
| 14. | Sycamore | 8.7% | 1.8%(+6.93)#14 | 1.8%(+6.91)#826 |
| 15. | Reevesville | 8.6% | 1.8%(+6.85)#15 | 1.8%(+6.83)#844 |
| 16. | Dacusville | 8.6% | 1.8%(+6.80)#16 | 1.8%(+6.79)#852 |
| 17. | Lowndesville | 8.5% | 1.8%(+6.71)#17 | 1.8%(+6.69)#868 |
| 18. | Edisto | 8.3% | 1.8%(+6.51)#18 | 1.8%(+6.49)#909 |
| 19. | Patrick | 8.2% | 1.8%(+6.46)#19 | 1.8%(+6.44)#920 |
| 20. | Clio | 8.1% | 1.8%(+6.35)#20 | 1.8%(+6.33)#951 |
| 21. | Denmark | 7.6% | 1.8%(+5.81)#21 | 1.8%(+5.80)#1,072 |
| 22. | Stateburg | 7.2% | 1.8%(+5.40)#22 | 1.8%(+5.38)#1,176 |
| 23. | Cheraw | 6.9% | 1.8%(+5.11)#23 | 1.8%(+5.10)#1,278 |
| 24. | Quinby | 6.7% | 1.8%(+4.97)#24 | 1.8%(+4.95)#1,326 |
| 25. | North | 6.5% | 1.8%(+4.74)#25 | 1.8%(+4.72)#1,411 |
| 26. | Darlington | 6.5% | 1.8%(+4.74)#26 | 1.8%(+4.72)#1,412 |
| 27. | Bucksport | 6.2% | 1.8%(+4.46)#27 | 1.8%(+4.45)#1,541 |
| 28. | Irwin | 6.2% | 1.8%(+4.46)#28 | 1.8%(+4.44)#1,544 |
| 29. | Greeleyville | 6.2% | 1.8%(+4.44)#29 | 1.8%(+4.42)#1,550 |
| 30. | Cherryvale | 6.2% | 1.8%(+4.39)#30 | 1.8%(+4.37)#1,575 |
| 31. | Lake View | 6.1% | 1.8%(+4.38)#31 | 1.8%(+4.36)#1,578 |
| 32. | Kershaw | 6.1% | 1.8%(+4.32)#32 | 1.8%(+4.30)#1,604 |
| 33. | Six Mile | 6.1% | 1.8%(+4.30)#33 | 1.8%(+4.28)#1,617 |
| 34. | Kingstree | 6.0% | 1.8%(+4.24)#34 | 1.8%(+4.23)#1,634 |
| 35. | Jacksonboro | 5.9% | 1.8%(+4.16)#35 | 1.8%(+4.14)#1,666 |
| 36. | Mayesville | 5.9% | 1.8%(+4.15)#36 | 1.8%(+4.13)#1,669 |
| 37. | Pendleton | 5.7% | 1.8%(+3.89)#37 | 1.8%(+3.87)#1,799 |
| 38. | Slater Marietta | 5.4% | 1.8%(+3.68)#38 | 1.8%(+3.66)#1,922 |
| 39. | Chickasaw Point | 5.4% | 1.8%(+3.64)#39 | 1.8%(+3.62)#1,950 |
| 40. | Campobello | 5.3% | 1.8%(+3.52)#40 | 1.8%(+3.50)#2,030 |
| 41. | Newport | 5.1% | 1.8%(+3.38)#41 | 1.8%(+3.36)#2,137 |
| 42. | Camp Croft | 5.1% | 1.8%(+3.37)#42 | 1.8%(+3.35)#2,146 |
| 43. | Cross Hill | 5.1% | 1.8%(+3.30)#43 | 1.8%(+3.28)#2,200 |
| 44. | Burnettown | 5.0% | 1.8%(+3.22)#44 | 1.8%(+3.20)#2,277 |
| 45. | Jefferson | 5.0% | 1.8%(+3.20)#45 | 1.8%(+3.19)#2,281 |
| 46. | Lugoff | 4.8% | 1.8%(+3.05)#46 | 1.8%(+3.03)#2,408 |
| 47. | Debordieu Colony | 4.7% | 1.8%(+2.95)#47 | 1.8%(+2.93)#2,497 |
| 48. | Pomaria | 4.7% | 1.8%(+2.88)#48 | 1.8%(+2.87)#2,572 |
| 49. | Chesnee | 4.6% | 1.8%(+2.79)#49 | 1.8%(+2.77)#2,667 |
| 50. | Centerville | 4.5% | 1.8%(+2.75)#50 | 1.8%(+2.73)#2,714 |
| 51. | Anderson | 4.5% | 1.8%(+2.74)#51 | 1.8%(+2.72)#2,723 |
| 52. | Cane Savannah | 4.3% | 1.8%(+2.55)#52 | 1.8%(+2.53)#2,906 |
| 53. | Yemassee | 4.3% | 1.8%(+2.53)#53 | 1.8%(+2.51)#2,930 |
| 54. | Sullivan S Island | 4.3% | 1.8%(+2.50)#54 | 1.8%(+2.49)#2,962 |
| 55. | Pinopolis | 4.3% | 1.8%(+2.50)#55 | 1.8%(+2.48)#2,967 |
| 56. | Central | 4.2% | 1.8%(+2.48)#56 | 1.8%(+2.46)#2,991 |
| 57. | Summit | 4.2% | 1.8%(+2.42)#57 | 1.8%(+2.41)#3,046 |
| 58. | Newberry | 4.2% | 1.8%(+2.40)#58 | 1.8%(+2.39)#3,063 |
| 59. | Cowpens | 4.1% | 1.8%(+2.36)#59 | 1.8%(+2.35)#3,123 |
| 60. | Latta | 4.1% | 1.8%(+2.35)#60 | 1.8%(+2.33)#3,142 |
| 61. | Bethune | 4.1% | 1.8%(+2.29)#61 | 1.8%(+2.27)#3,243 |
| 62. | Seneca | 4.0% | 1.8%(+2.28)#62 | 1.8%(+2.26)#3,258 |
| 63. | Pine Ridge | 4.0% | 1.8%(+2.27)#63 | 1.8%(+2.25)#3,268 |
| 64. | Harleyville | 4.0% | 1.8%(+2.24)#64 | 1.8%(+2.22)#3,308 |
| 65. | Woodfield | 4.0% | 1.8%(+2.21)#65 | 1.8%(+2.20)#3,346 |
| 66. | Norway | 3.8% | 1.8%(+2.05)#66 | 1.8%(+2.03)#3,599 |
| 67. | Richburg | 3.6% | 1.8%(+1.88)#67 | 1.8%(+1.86)#3,855 |
| 68. | Pinewood | 3.6% | 1.8%(+1.82)#68 | 1.8%(+1.80)#3,974 |
| 69. | Pawleys Island | 3.6% | 1.8%(+1.80)#69 | 1.8%(+1.79)#4,014 |
| 70. | Camden | 3.5% | 1.8%(+1.77)#70 | 1.8%(+1.75)#4,069 |
| 71. | West Columbia | 3.5% | 1.8%(+1.70)#71 | 1.8%(+1.68)#4,197 |
| 72. | Easley | 3.4% | 1.8%(+1.63)#72 | 1.8%(+1.61)#4,339 |
| 73. | Hodges | 3.4% | 1.8%(+1.62)#73 | 1.8%(+1.60)#4,357 |
| 74. | Andrews | 3.4% | 1.8%(+1.60)#74 | 1.8%(+1.59)#4,387 |
| 75. | Govan | 3.3% | 1.8%(+1.56)#75 | 1.8%(+1.55)#4,464 |
| 76. | Blythewood | 3.3% | 1.8%(+1.51)#76 | 1.8%(+1.49)#4,570 |
| 77. | Folly Beach | 3.3% | 1.8%(+1.50)#77 | 1.8%(+1.48)#4,588 |
| 78. | Port Royal | 3.3% | 1.8%(+1.49)#78 | 1.8%(+1.47)#4,598 |
| 79. | Arkwright | 3.2% | 1.8%(+1.46)#79 | 1.8%(+1.44)#4,661 |
| 80. | Ben Avon | 3.2% | 1.8%(+1.45)#80 | 1.8%(+1.43)#4,690 |
| 81. | Shell Point | 3.2% | 1.8%(+1.42)#81 | 1.8%(+1.41)#4,747 |
| 82. | Forest Acres | 3.2% | 1.8%(+1.40)#82 | 1.8%(+1.39)#4,801 |
| 83. | Fountain Inn | 3.1% | 1.8%(+1.32)#83 | 1.8%(+1.30)#5,017 |
| 84. | Arcadia | 3.1% | 1.8%(+1.31)#84 | 1.8%(+1.29)#5,028 |
| 85. | Mount Croghan | 3.0% | 1.8%(+1.26)#85 | 1.8%(+1.24)#5,163 |
| 86. | Edgefield | 3.0% | 1.8%(+1.24)#86 | 1.8%(+1.23)#5,206 |
| 87. | St George | 3.0% | 1.8%(+1.24)#87 | 1.8%(+1.23)#5,211 |
| 88. | Hickory Grove | 3.0% | 1.8%(+1.20)#88 | 1.8%(+1.18)#5,333 |
| 89. | Lane | 3.0% | 1.8%(+1.19)#89 | 1.8%(+1.17)#5,346 |
| 90. | Wilkinson Heights | 2.9% | 1.8%(+1.18)#90 | 1.8%(+1.16)#5,366 |
| 91. | Donalds | 2.9% | 1.8%(+1.15)#91 | 1.8%(+1.13)#5,472 |
| 92. | Loris | 2.9% | 1.8%(+1.11)#92 | 1.8%(+1.10)#5,598 |
| 93. | Fort Mill | 2.8% | 1.8%(+1.08)#93 | 1.8%(+1.06)#5,704 |
| 94. | Marion | 2.8% | 1.8%(+1.05)#94 | 1.8%(+1.03)#5,794 |
| 95. | Helena | 2.8% | 1.8%(+1.02)#95 | 1.8%(+1.00)#5,888 |
| 96. | Georgetown | 2.7% | 1.8%(+0.971)#96 | 1.8%(+0.954)#6,017 |
| 97. | Florence | 2.7% | 1.8%(+0.946)#97 | 1.8%(+0.929)#6,099 |
| 98. | Conestee | 2.7% | 1.8%(+0.939)#98 | 1.8%(+0.922)#6,137 |
| 99. | Salley | 2.7% | 1.8%(+0.934)#99 | 1.8%(+0.917)#6,157 |
| 100. | Pageland | 2.6% | 1.8%(+0.878)#100 | 1.8%(+0.860)#6,357 |
Common Questions
What are the Top 10 Cities with the Highest Percentage of Population Employed in Education, Arts & Media in South Carolina?
Top 10 Cities with the Highest Percentage of Population Employed in Education, Arts & Media in South Carolina are:
#1
18.2%
#2
14.6%
#3
13.0%
#4
11.1%
#5
10.9%
#6
10.8%
#7
10.7%
#8
10.7%
#9
10.6%
#10
8.7%
What city has the Highest Percentage of Population Employed in Education, Arts & Media in South Carolina?
Cope has the Highest Percentage of Population Employed in Education, Arts & Media in South Carolina with 18.2%.
What is the Percentage of Population Employed in Education, Arts & Media in the State of South Carolina?
Percentage of Population Employed in Education, Arts & Media in South Carolina is 1.8%.
What is the Percentage of Population Employed in Education, Arts & Media in the United States?
Percentage of Population Employed in Education, Arts & Media in the United States is 1.8%.