Cities with the Highest Percentage of Population Employed in Education, Arts & Media in Missouri
RELATED REPORTS & OPTIONS
Education, Arts & Media
Missouri
Compare Cities
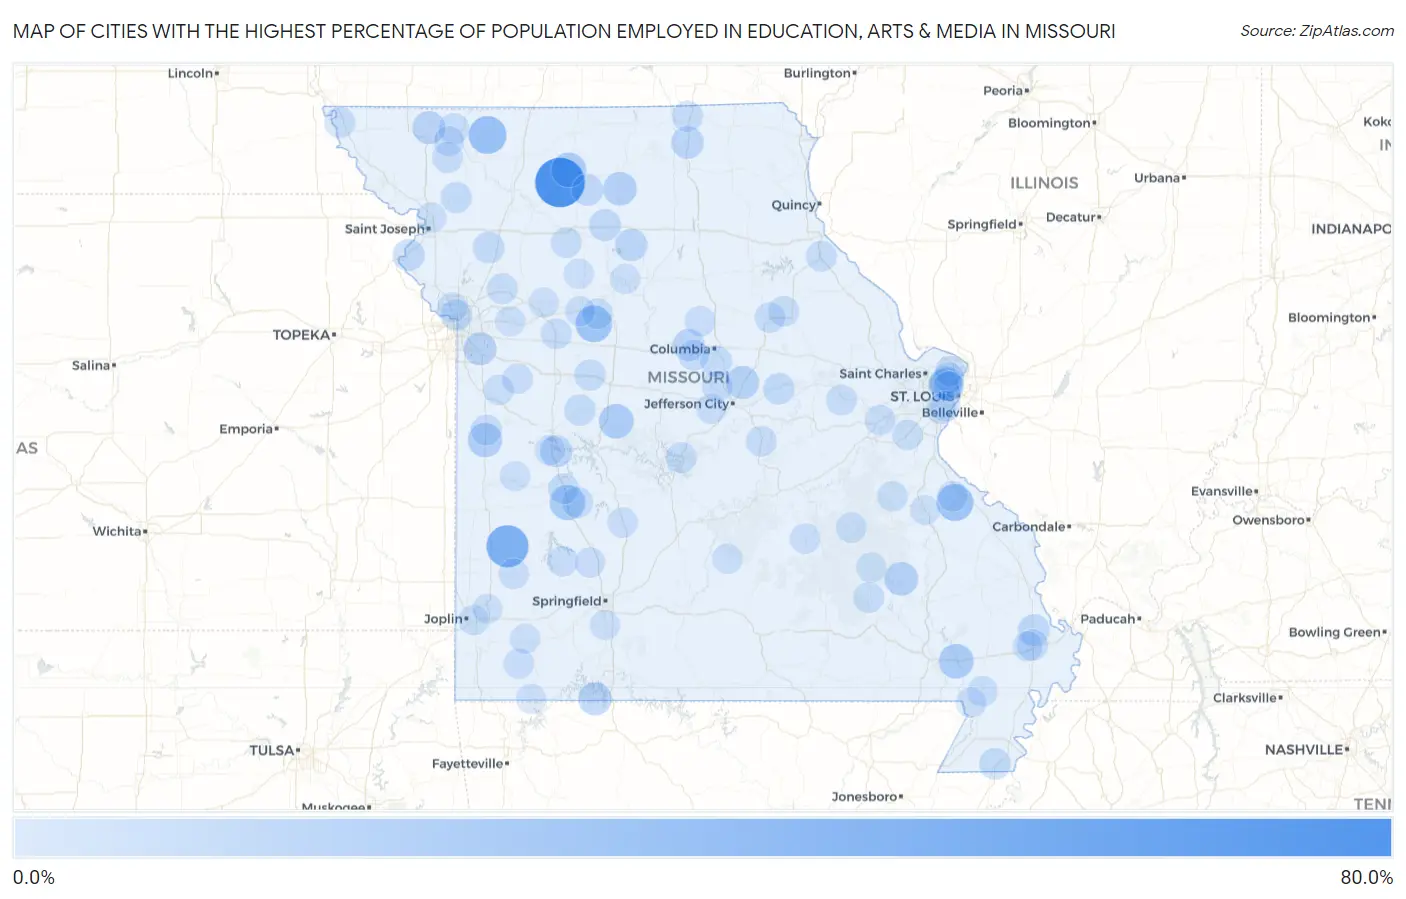
Map of Cities with the Highest Percentage of Population Employed in Education, Arts & Media in Missouri
0.0%
80.0%
Cities with the Highest Percentage of Population Employed in Education, Arts & Media in Missouri
| City | % Employed | vs State | vs National | |
| 1. | Edinburg | 80.0% | 1.8%(+78.2)#1 | 1.8%(+78.2)#18 |
| 2. | Milford | 50.0% | 1.8%(+48.2)#2 | 1.8%(+48.2)#43 |
| 3. | Denver | 33.3% | 1.8%(+31.5)#3 | 1.8%(+31.5)#95 |
| 4. | Weingarten | 29.7% | 1.8%(+27.9)#4 | 1.8%(+27.9)#113 |
| 5. | Mount Leonard | 28.6% | 1.8%(+26.8)#5 | 1.8%(+26.8)#120 |
| 6. | Frisbee | 24.2% | 1.8%(+22.4)#6 | 1.8%(+22.5)#152 |
| 7. | Collins | 23.7% | 1.8%(+21.9)#7 | 1.8%(+21.9)#162 |
| 8. | Tindall | 21.7% | 1.8%(+19.9)#8 | 1.8%(+20.0)#181 |
| 9. | Fisk | 21.4% | 1.8%(+19.6)#9 | 1.8%(+19.6)#184 |
| 10. | Cole Camp | 21.1% | 1.8%(+19.3)#10 | 1.8%(+19.3)#190 |
| 11. | Pasadena Park | 20.2% | 1.8%(+18.4)#11 | 1.8%(+18.4)#205 |
| 12. | Passaic | 20.0% | 1.8%(+18.2)#12 | 1.8%(+18.2)#215 |
| 13. | Browning | 16.8% | 1.8%(+15.0)#13 | 1.8%(+15.0)#280 |
| 14. | Annapolis | 16.7% | 1.8%(+14.9)#14 | 1.8%(+14.9)#284 |
| 15. | New Bloomfield | 16.0% | 1.8%(+14.2)#15 | 1.8%(+14.2)#307 |
| 16. | Summer Set | 15.8% | 1.8%(+14.0)#16 | 1.8%(+14.0)#311 |
| 17. | Blue Eye | 15.3% | 1.8%(+13.5)#17 | 1.8%(+13.5)#328 |
| 18. | Pickering | 14.5% | 1.8%(+12.7)#18 | 1.8%(+12.7)#353 |
| 19. | Unity Village | 14.3% | 1.8%(+12.5)#19 | 1.8%(+12.5)#363 |
| 20. | Greentop | 13.3% | 1.8%(+11.5)#20 | 1.8%(+11.5)#403 |
| 21. | Rothville | 12.5% | 1.8%(+10.7)#21 | 1.8%(+10.7)#455 |
| 22. | Brownington | 11.8% | 1.8%(+9.96)#22 | 1.8%(+9.98)#491 |
| 23. | Rocheport | 11.7% | 1.8%(+9.86)#23 | 1.8%(+9.88)#495 |
| 24. | Rushville | 10.3% | 1.8%(+8.45)#24 | 1.8%(+8.47)#616 |
| 25. | Meadville | 10.2% | 1.8%(+8.43)#25 | 1.8%(+8.45)#618 |
| 26. | Blodgett | 10.0% | 1.8%(+8.19)#26 | 1.8%(+8.21)#639 |
| 27. | Laredo | 10.0% | 1.8%(+8.19)#27 | 1.8%(+8.21)#642 |
| 28. | Turney | 9.5% | 1.8%(+7.65)#28 | 1.8%(+7.67)#708 |
| 29. | Northmoor | 9.3% | 1.8%(+7.46)#29 | 1.8%(+7.48)#738 |
| 30. | Chamois | 8.9% | 1.8%(+7.08)#30 | 1.8%(+7.10)#796 |
| 31. | Holland | 8.7% | 1.8%(+6.89)#31 | 1.8%(+6.91)#825 |
| 32. | Union Star | 8.4% | 1.8%(+6.61)#32 | 1.8%(+6.63)#875 |
| 33. | Windsor | 8.4% | 1.8%(+6.57)#33 | 1.8%(+6.59)#879 |
| 34. | Pierpont | 8.3% | 1.8%(+6.53)#34 | 1.8%(+6.55)#900 |
| 35. | Weaubleau | 8.2% | 1.8%(+6.40)#35 | 1.8%(+6.42)#928 |
| 36. | Miner | 8.2% | 1.8%(+6.35)#36 | 1.8%(+6.37)#942 |
| 37. | La Monte | 8.1% | 1.8%(+6.34)#37 | 1.8%(+6.36)#948 |
| 38. | Pasadena Hills | 7.7% | 1.8%(+5.87)#38 | 1.8%(+5.89)#1,049 |
| 39. | Homestead | 7.4% | 1.8%(+5.56)#39 | 1.8%(+5.58)#1,134 |
| 40. | Glenwood | 7.3% | 1.8%(+5.51)#40 | 1.8%(+5.53)#1,144 |
| 41. | Parnell | 7.2% | 1.8%(+5.42)#41 | 1.8%(+5.44)#1,163 |
| 42. | Vista | 7.1% | 1.8%(+5.34)#42 | 1.8%(+5.36)#1,197 |
| 43. | Adrian | 7.0% | 1.8%(+5.18)#43 | 1.8%(+5.20)#1,236 |
| 44. | Hartsburg | 7.0% | 1.8%(+5.17)#44 | 1.8%(+5.19)#1,241 |
| 45. | Conception | 6.9% | 1.8%(+5.09)#45 | 1.8%(+5.11)#1,271 |
| 46. | Rush Hill | 6.7% | 1.8%(+4.86)#46 | 1.8%(+4.88)#1,353 |
| 47. | Watson | 6.7% | 1.8%(+4.86)#47 | 1.8%(+4.88)#1,359 |
| 48. | Higginsville | 6.5% | 1.8%(+4.70)#48 | 1.8%(+4.72)#1,414 |
| 49. | Freeburg | 6.5% | 1.8%(+4.66)#49 | 1.8%(+4.68)#1,430 |
| 50. | Philadelphia | 6.4% | 1.8%(+4.62)#50 | 1.8%(+4.64)#1,459 |
| 51. | Lake Ozark | 6.4% | 1.8%(+4.61)#51 | 1.8%(+4.63)#1,469 |
| 52. | Dawn | 6.4% | 1.8%(+4.58)#52 | 1.8%(+4.60)#1,484 |
| 53. | Ellington | 6.3% | 1.8%(+4.51)#53 | 1.8%(+4.53)#1,498 |
| 54. | Bel Nor | 6.3% | 1.8%(+4.51)#54 | 1.8%(+4.53)#1,501 |
| 55. | Vandiver | 6.2% | 1.8%(+4.44)#55 | 1.8%(+4.46)#1,533 |
| 56. | Wooldridge | 6.2% | 1.8%(+4.44)#56 | 1.8%(+4.46)#1,538 |
| 57. | New Haven | 6.2% | 1.8%(+4.44)#57 | 1.8%(+4.46)#1,539 |
| 58. | Malta Bend | 6.2% | 1.8%(+4.37)#58 | 1.8%(+4.39)#1,568 |
| 59. | New London | 6.2% | 1.8%(+4.36)#59 | 1.8%(+4.38)#1,571 |
| 60. | Villa Ridge | 6.1% | 1.8%(+4.27)#60 | 1.8%(+4.29)#1,611 |
| 61. | Harrisburg | 6.0% | 1.8%(+4.24)#61 | 1.8%(+4.26)#1,625 |
| 62. | Viburnum | 6.0% | 1.8%(+4.21)#62 | 1.8%(+4.23)#1,632 |
| 63. | Grayhawk | 5.9% | 1.8%(+4.11)#63 | 1.8%(+4.13)#1,674 |
| 64. | Kingsville | 5.6% | 1.8%(+3.82)#64 | 1.8%(+3.84)#1,819 |
| 65. | Dadeville | 5.6% | 1.8%(+3.81)#65 | 1.8%(+3.83)#1,823 |
| 66. | Black Jack | 5.6% | 1.8%(+3.79)#66 | 1.8%(+3.81)#1,841 |
| 67. | Dellwood | 5.3% | 1.8%(+3.54)#67 | 1.8%(+3.56)#1,993 |
| 68. | Cedar Hill | 5.3% | 1.8%(+3.52)#68 | 1.8%(+3.54)#2,003 |
| 69. | Deepwater | 5.3% | 1.8%(+3.50)#69 | 1.8%(+3.52)#2,014 |
| 70. | Ravenwood | 5.3% | 1.8%(+3.46)#70 | 1.8%(+3.48)#2,044 |
| 71. | Louisburg | 5.3% | 1.8%(+3.46)#71 | 1.8%(+3.48)#2,058 |
| 72. | Potosi | 5.2% | 1.8%(+3.41)#72 | 1.8%(+3.43)#2,089 |
| 73. | Wheaton | 5.2% | 1.8%(+3.35)#73 | 1.8%(+3.37)#2,130 |
| 74. | Golden City | 5.1% | 1.8%(+3.33)#74 | 1.8%(+3.35)#2,143 |
| 75. | Lohman | 5.1% | 1.8%(+3.28)#75 | 1.8%(+3.30)#2,185 |
| 76. | Salem | 5.0% | 1.8%(+3.22)#76 | 1.8%(+3.24)#2,231 |
| 77. | Malden | 4.9% | 1.8%(+3.14)#77 | 1.8%(+3.16)#2,298 |
| 78. | Duquesne | 4.9% | 1.8%(+3.13)#78 | 1.8%(+3.15)#2,307 |
| 79. | Morrisville | 4.9% | 1.8%(+3.12)#79 | 1.8%(+3.14)#2,311 |
| 80. | East Lynne | 4.9% | 1.8%(+3.10)#80 | 1.8%(+3.12)#2,338 |
| 81. | Lakeshire | 4.9% | 1.8%(+3.07)#81 | 1.8%(+3.09)#2,363 |
| 82. | Wilbur Park | 4.8% | 1.8%(+2.98)#82 | 1.8%(+3.00)#2,443 |
| 83. | Pierce City | 4.7% | 1.8%(+2.94)#83 | 1.8%(+2.96)#2,468 |
| 84. | Campbell | 4.7% | 1.8%(+2.89)#84 | 1.8%(+2.91)#2,514 |
| 85. | Pine Lawn | 4.7% | 1.8%(+2.86)#85 | 1.8%(+2.88)#2,554 |
| 86. | Levasy | 4.7% | 1.8%(+2.85)#86 | 1.8%(+2.87)#2,576 |
| 87. | Lake Waukomis | 4.6% | 1.8%(+2.84)#87 | 1.8%(+2.86)#2,583 |
| 88. | Country Club | 4.6% | 1.8%(+2.79)#88 | 1.8%(+2.81)#2,632 |
| 89. | Plato | 4.5% | 1.8%(+2.74)#89 | 1.8%(+2.76)#2,685 |
| 90. | Nixa | 4.5% | 1.8%(+2.68)#90 | 1.8%(+2.70)#2,744 |
| 91. | Sikeston | 4.5% | 1.8%(+2.67)#91 | 1.8%(+2.69)#2,762 |
| 92. | Brunswick | 4.4% | 1.8%(+2.62)#92 | 1.8%(+2.64)#2,810 |
| 93. | Rockville | 4.3% | 1.8%(+2.54)#93 | 1.8%(+2.56)#2,882 |
| 94. | Bogard | 4.3% | 1.8%(+2.54)#94 | 1.8%(+2.56)#2,884 |
| 95. | Centerville | 4.3% | 1.8%(+2.50)#95 | 1.8%(+2.52)#2,916 |
| 96. | Hardin | 4.3% | 1.8%(+2.49)#96 | 1.8%(+2.51)#2,926 |
| 97. | Seligman | 4.3% | 1.8%(+2.48)#97 | 1.8%(+2.50)#2,942 |
| 98. | Waverly | 4.2% | 1.8%(+2.44)#98 | 1.8%(+2.46)#2,985 |
| 99. | Leadington | 4.2% | 1.8%(+2.44)#99 | 1.8%(+2.46)#2,986 |
| 100. | Carthage | 4.2% | 1.8%(+2.44)#100 | 1.8%(+2.46)#2,990 |
Common Questions
What are the Top 10 Cities with the Highest Percentage of Population Employed in Education, Arts & Media in Missouri?
Top 10 Cities with the Highest Percentage of Population Employed in Education, Arts & Media in Missouri are:
#1
80.0%
#2
50.0%
#3
33.3%
#4
29.7%
#5
28.6%
#6
23.7%
#7
21.7%
#8
21.4%
#9
21.1%
#10
20.2%
What city has the Highest Percentage of Population Employed in Education, Arts & Media in Missouri?
Edinburg has the Highest Percentage of Population Employed in Education, Arts & Media in Missouri with 80.0%.
What is the Percentage of Population Employed in Education, Arts & Media in the State of Missouri?
Percentage of Population Employed in Education, Arts & Media in Missouri is 1.8%.
What is the Percentage of Population Employed in Education, Arts & Media in the United States?
Percentage of Population Employed in Education, Arts & Media in the United States is 1.8%.