Cities with the Highest Percentage of Population Employed in Education, Arts & Media in Vermont
RELATED REPORTS & OPTIONS
Education, Arts & Media
Vermont
Compare Cities
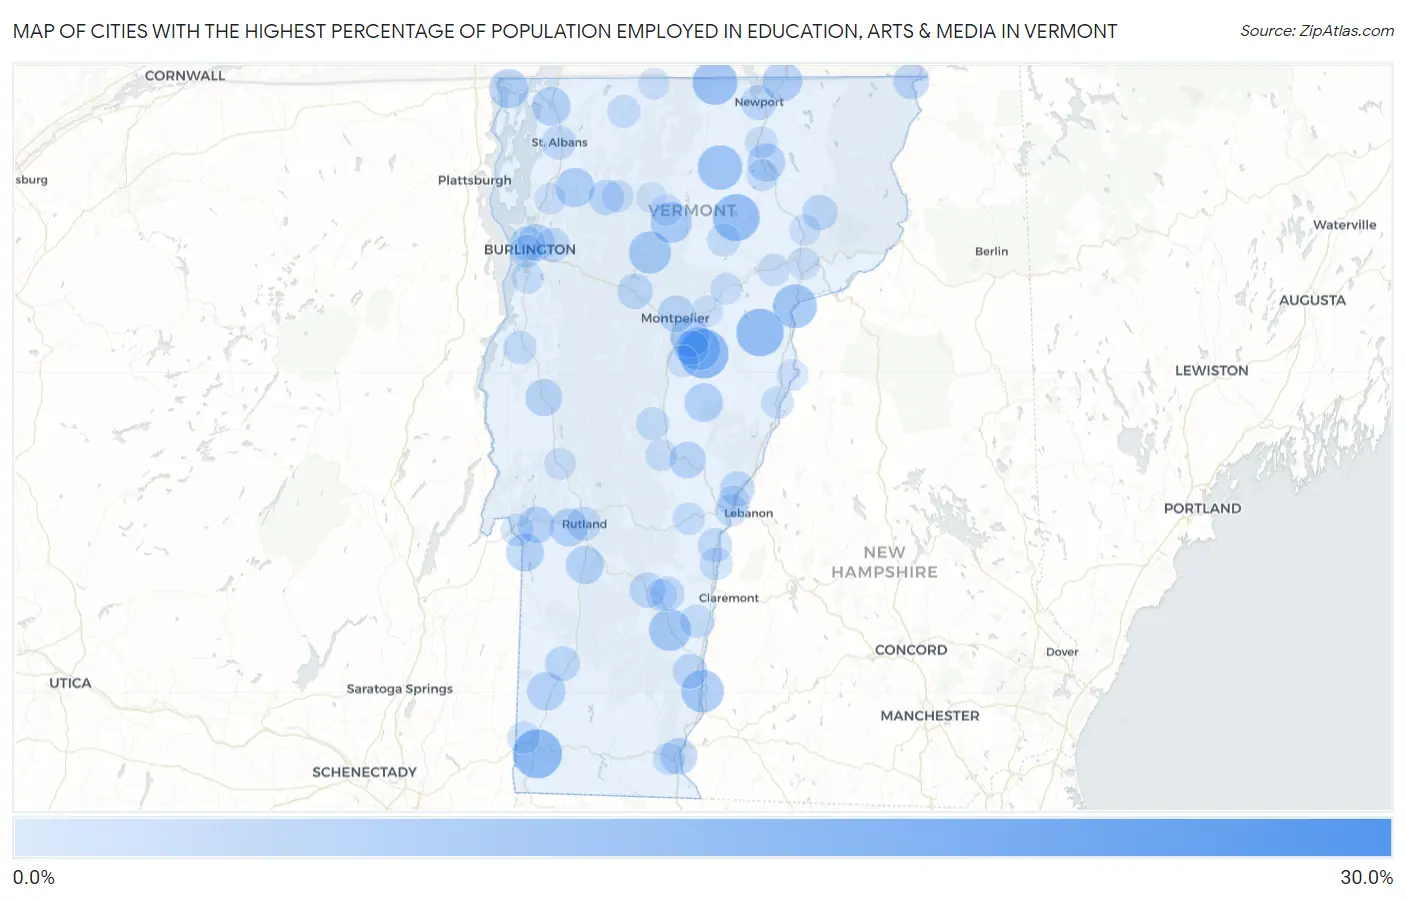
Map of Cities with the Highest Percentage of Population Employed in Education, Arts & Media in Vermont
0.0%
30.0%
Cities with the Highest Percentage of Population Employed in Education, Arts & Media in Vermont
| City | % Employed | vs State | vs National | |
| 1. | Jamaica | 28.8% | 2.8%(+26.0)#1 | 1.8%(+27.1)#117 |
| 2. | Whitingham | 21.7% | 2.8%(+18.9)#2 | 1.8%(+20.0)#180 |
| 3. | East Barre | 13.7% | 2.8%(+10.9)#3 | 1.8%(+11.9)#387 |
| 4. | Bennington | 13.5% | 2.8%(+10.7)#4 | 1.8%(+11.7)#395 |
| 5. | Groton | 12.4% | 2.8%(+9.50)#5 | 1.8%(+10.6)#462 |
| 6. | Greensboro | 11.9% | 2.8%(+9.06)#6 | 1.8%(+10.1)#487 |
| 7. | North Troy | 10.4% | 2.8%(+7.60)#7 | 1.8%(+8.66)#601 |
| 8. | Albany | 10.2% | 2.8%(+7.36)#8 | 1.8%(+8.42)#623 |
| 9. | Barnet | 9.7% | 2.8%(+6.83)#9 | 1.8%(+7.89)#675 |
| 10. | West Charlotte | 9.3% | 2.8%(+6.45)#10 | 1.8%(+7.52)#732 |
| 11. | Wolcott | 9.2% | 2.8%(+6.32)#11 | 1.8%(+7.38)#755 |
| 12. | Websterville | 9.2% | 2.8%(+6.30)#12 | 1.8%(+7.36)#757 |
| 13. | Westminster | 8.9% | 2.8%(+6.07)#13 | 1.8%(+7.14)#793 |
| 14. | Stowe | 8.5% | 2.8%(+5.62)#14 | 1.8%(+6.68)#869 |
| 15. | Chester | 8.4% | 2.8%(+5.52)#15 | 1.8%(+6.58)#881 |
| 16. | Morrisville | 7.8% | 2.8%(+4.95)#16 | 1.8%(+6.01)#1,018 |
| 17. | Hartford | 7.5% | 2.8%(+4.70)#17 | 1.8%(+5.76)#1,082 |
| 18. | Derby Line | 6.9% | 2.8%(+4.02)#18 | 1.8%(+5.09)#1,282 |
| 19. | Barre | 6.6% | 2.8%(+3.73)#19 | 1.8%(+4.79)#1,388 |
| 20. | Lincoln | 6.5% | 2.8%(+3.66)#20 | 1.8%(+4.72)#1,416 |
| 21. | Alburgh | 6.4% | 2.8%(+3.57)#21 | 1.8%(+4.64)#1,466 |
| 22. | Fairfax | 6.4% | 2.8%(+3.51)#22 | 1.8%(+4.57)#1,490 |
| 23. | Arlington | 5.9% | 2.8%(+3.08)#23 | 1.8%(+4.14)#1,664 |
| 24. | Swanton | 5.9% | 2.8%(+3.07)#24 | 1.8%(+4.13)#1,675 |
| 25. | Chelsea | 5.9% | 2.8%(+3.03)#25 | 1.8%(+4.10)#1,685 |
| 26. | Wallingford | 5.7% | 2.8%(+2.87)#26 | 1.8%(+3.93)#1,768 |
| 27. | West Rutland | 5.5% | 2.8%(+2.67)#27 | 1.8%(+3.73)#1,883 |
| 28. | Barton | 5.4% | 2.8%(+2.59)#28 | 1.8%(+3.65)#1,931 |
| 29. | Poultney | 5.4% | 2.8%(+2.52)#29 | 1.8%(+3.58)#1,983 |
| 30. | Middletown Springs | 5.3% | 2.8%(+2.41)#30 | 1.8%(+3.48)#2,051 |
| 31. | Middlebury | 4.9% | 2.8%(+2.02)#31 | 1.8%(+3.08)#2,370 |
| 32. | Castleton | 4.7% | 2.8%(+1.89)#32 | 1.8%(+2.95)#2,480 |
| 33. | Winooski | 4.7% | 2.8%(+1.85)#33 | 1.8%(+2.91)#2,515 |
| 34. | Brattleboro | 4.6% | 2.8%(+1.78)#34 | 1.8%(+2.84)#2,603 |
| 35. | South Royalton | 4.6% | 2.8%(+1.76)#35 | 1.8%(+2.82)#2,619 |
| 36. | Montpelier | 4.5% | 2.8%(+1.66)#36 | 1.8%(+2.73)#2,717 |
| 37. | Proctor | 4.4% | 2.8%(+1.56)#37 | 1.8%(+2.62)#2,820 |
| 38. | Canaan | 4.2% | 2.8%(+1.32)#38 | 1.8%(+2.38)#3,075 |
| 39. | Sheffield | 4.2% | 2.8%(+1.32)#39 | 1.8%(+2.38)#3,081 |
| 40. | Ludlow | 3.9% | 2.8%(+1.07)#40 | 1.8%(+2.13)#3,443 |
| 41. | Pownal Center | 3.9% | 2.8%(+1.05)#41 | 1.8%(+2.11)#3,466 |
| 42. | Burlington | 3.8% | 2.8%(+0.919)#42 | 1.8%(+1.98)#3,681 |
| 43. | Waterbury | 3.7% | 2.8%(+0.868)#43 | 1.8%(+1.93)#3,753 |
| 44. | Cambridge | 3.7% | 2.8%(+0.855)#44 | 1.8%(+1.92)#3,780 |
| 45. | Manchester | 3.6% | 2.8%(+0.788)#45 | 1.8%(+1.85)#3,880 |
| 46. | East Burke | 3.6% | 2.8%(+0.766)#46 | 1.8%(+1.83)#3,910 |
| 47. | Newport | 3.5% | 2.8%(+0.682)#47 | 1.8%(+1.74)#4,075 |
| 48. | Norwich | 3.4% | 2.8%(+0.563)#48 | 1.8%(+1.63)#4,309 |
| 49. | Saxtons River | 3.3% | 2.8%(+0.465)#49 | 1.8%(+1.53)#4,494 |
| 50. | Essex Junction | 3.2% | 2.8%(+0.305)#50 | 1.8%(+1.37)#4,845 |
| 51. | Lunenburg | 3.1% | 2.8%(+0.301)#51 | 1.8%(+1.36)#4,857 |
| 52. | Rutland | 3.1% | 2.8%(+0.269)#52 | 1.8%(+1.33)#4,942 |
| 53. | South Barre | 3.1% | 2.8%(+0.248)#53 | 1.8%(+1.31)#4,991 |
| 54. | St Albans | 3.1% | 2.8%(+0.202)#54 | 1.8%(+1.26)#5,098 |
| 55. | Hartland | 3.0% | 2.8%(+0.182)#55 | 1.8%(+1.24)#5,153 |
| 56. | Cavendish | 3.0% | 2.8%(+0.182)#56 | 1.8%(+1.24)#5,158 |
| 57. | Algiers | 2.8% | 2.8%(-0.012)#57 | 1.8%(+1.05)#5,734 |
| 58. | North Hyde Park | 2.8% | 2.8%(-0.015)#58 | 1.8%(+1.05)#5,745 |
| 59. | South Lincoln | 2.8% | 2.8%(-0.045)#59 | 1.8%(+1.02)#5,843 |
| 60. | Vergennes | 2.5% | 2.8%(-0.368)#60 | 1.8%(+0.694)#6,958 |
| 61. | St. George | 2.4% | 2.8%(-0.456)#61 | 1.8%(+0.606)#7,293 |
| 62. | Randolph | 2.3% | 2.8%(-0.588)#62 | 1.8%(+0.474)#7,833 |
| 63. | Bolton Valley | 2.3% | 2.8%(-0.593)#63 | 1.8%(+0.470)#7,862 |
| 64. | Springfield | 2.2% | 2.8%(-0.602)#64 | 1.8%(+0.460)#7,911 |
| 65. | Hardwick | 2.2% | 2.8%(-0.619)#65 | 1.8%(+0.443)#7,978 |
| 66. | Wardsboro | 2.1% | 2.8%(-0.721)#66 | 1.8%(+0.342)#8,440 |
| 67. | Enosburg Falls | 2.1% | 2.8%(-0.753)#67 | 1.8%(+0.310)#8,583 |
| 68. | Windsor | 2.0% | 2.8%(-0.808)#68 | 1.8%(+0.255)#8,863 |
| 69. | Fair Haven | 2.0% | 2.8%(-0.875)#69 | 1.8%(+0.188)#9,213 |
| 70. | South Burlington | 2.0% | 2.8%(-0.881)#70 | 1.8%(+0.181)#9,251 |
| 71. | North Bennington | 1.9% | 2.8%(-0.962)#71 | 1.8%(+0.101)#9,672 |
| 72. | White River Junction | 1.8% | 2.8%(-1.03)#72 | 1.8%(+0.037)#10,063 |
| 73. | Bradford | 1.8% | 2.8%(-1.03)#73 | 1.8%(+0.032)#10,087 |
| 74. | Woodstock | 1.8% | 2.8%(-1.06)#74 | 1.8%(-0.000)#10,279 |
| 75. | West Brattleboro | 1.7% | 2.8%(-1.12)#75 | 1.8%(-0.057)#10,619 |
| 76. | Bakersfield | 1.7% | 2.8%(-1.12)#76 | 1.8%(-0.062)#10,645 |
| 77. | Orleans | 1.7% | 2.8%(-1.17)#77 | 1.8%(-0.109)#10,907 |
| 78. | Shelburne | 1.7% | 2.8%(-1.17)#78 | 1.8%(-0.112)#10,930 |
| 79. | St Johnsbury | 1.7% | 2.8%(-1.19)#79 | 1.8%(-0.124)#11,015 |
| 80. | Jeffersonville | 1.6% | 2.8%(-1.22)#80 | 1.8%(-0.158)#11,230 |
| 81. | Danville | 1.6% | 2.8%(-1.29)#81 | 1.8%(-0.224)#11,687 |
| 82. | Glover | 1.5% | 2.8%(-1.31)#82 | 1.8%(-0.248)#11,809 |
| 83. | Proctorsville | 1.5% | 2.8%(-1.39)#83 | 1.8%(-0.330)#12,328 |
| 84. | Hyde Park | 1.4% | 2.8%(-1.44)#84 | 1.8%(-0.378)#12,646 |
| 85. | Bethel | 1.4% | 2.8%(-1.47)#85 | 1.8%(-0.409)#12,876 |
| 86. | Wilder | 1.3% | 2.8%(-1.50)#86 | 1.8%(-0.441)#13,107 |
| 87. | Brandon | 1.3% | 2.8%(-1.53)#87 | 1.8%(-0.470)#13,288 |
| 88. | Williamstown | 1.2% | 2.8%(-1.64)#88 | 1.8%(-0.576)#13,975 |
| 89. | Plainfield | 1.2% | 2.8%(-1.66)#89 | 1.8%(-0.596)#14,103 |
| 90. | Newbury | 1.1% | 2.8%(-1.77)#90 | 1.8%(-0.705)#14,769 |
| 91. | Marshfield | 1.1% | 2.8%(-1.77)#91 | 1.8%(-0.705)#14,770 |
| 92. | Huntington | 1.0% | 2.8%(-1.80)#92 | 1.8%(-0.741)#15,009 |
| 93. | Danby | 1.0% | 2.8%(-1.84)#93 | 1.8%(-0.776)#15,236 |
| 94. | Richford | 1.00% | 2.8%(-1.85)#94 | 1.8%(-0.788)#15,304 |
| 95. | Milton | 0.99% | 2.8%(-1.86)#95 | 1.8%(-0.801)#15,377 |
| 96. | Lyndonville | 0.92% | 2.8%(-1.93)#96 | 1.8%(-0.870)#15,786 |
| 97. | Stamford | 0.85% | 2.8%(-2.00)#97 | 1.8%(-0.939)#16,201 |
| 98. | Johnson | 0.57% | 2.8%(-2.28)#98 | 1.8%(-1.22)#17,759 |
1
2Common Questions
What are the Top 10 Cities with the Highest Percentage of Population Employed in Education, Arts & Media in Vermont?
Top 10 Cities with the Highest Percentage of Population Employed in Education, Arts & Media in Vermont are:
#1
13.7%
#2
13.5%
#3
12.4%
#4
11.9%
#5
10.4%
#6
10.2%
#7
9.7%
#8
9.2%
#9
8.9%
#10
8.5%
What city has the Highest Percentage of Population Employed in Education, Arts & Media in Vermont?
East Barre has the Highest Percentage of Population Employed in Education, Arts & Media in Vermont with 13.7%.
What is the Percentage of Population Employed in Education, Arts & Media in the State of Vermont?
Percentage of Population Employed in Education, Arts & Media in Vermont is 2.8%.
What is the Percentage of Population Employed in Education, Arts & Media in the United States?
Percentage of Population Employed in Education, Arts & Media in the United States is 1.8%.