Cities with the Largest Salvadoran Community in Ohio
RELATED REPORTS & OPTIONS
Salvadoran
Ohio
Compare Cities
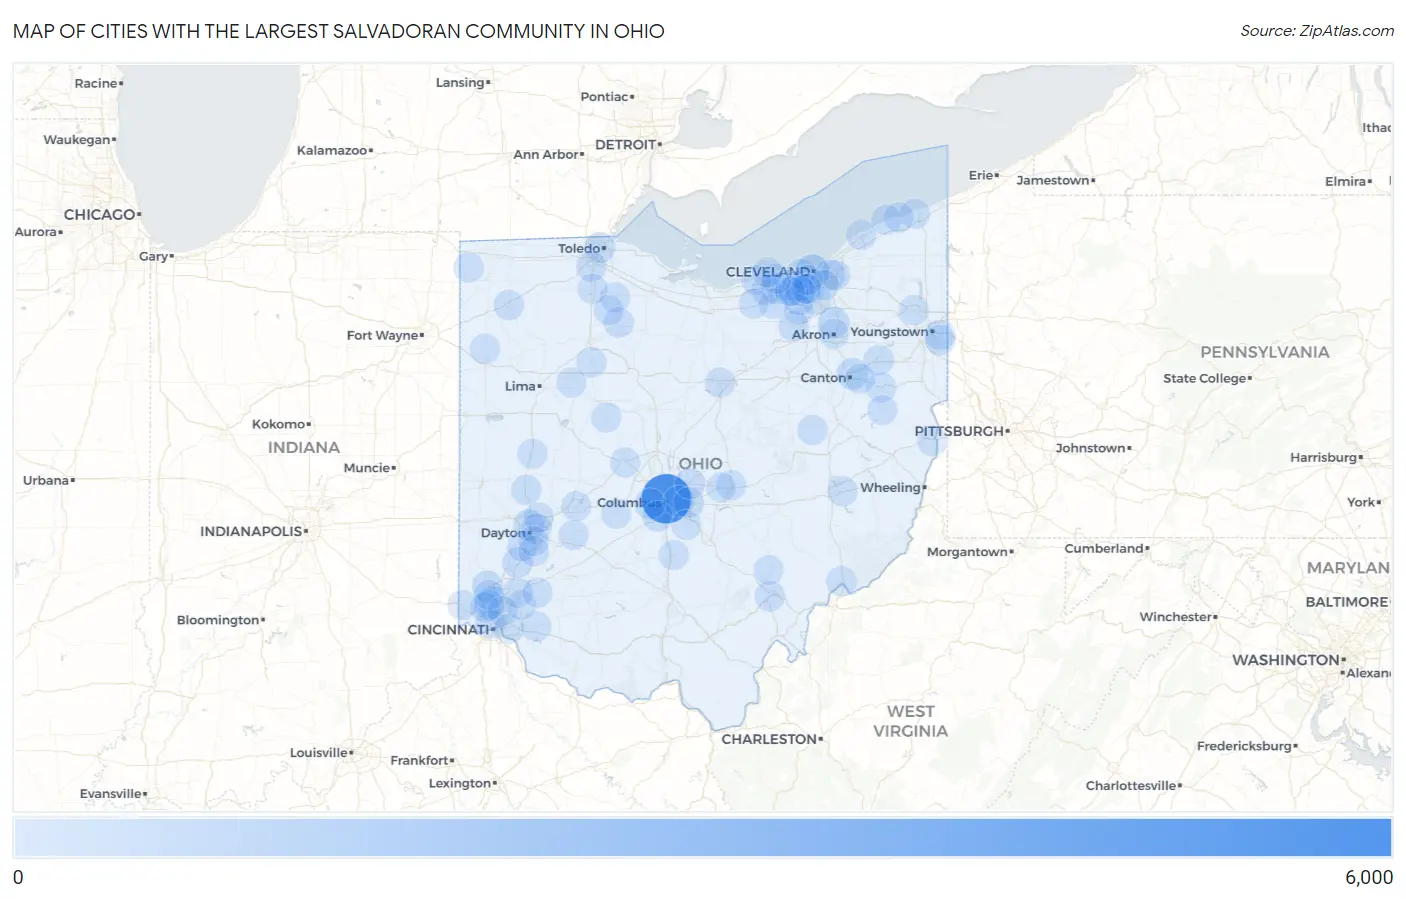
Map of Cities with the Largest Salvadoran Community in Ohio
0
6,000
Cities with the Largest Salvadoran Community in Ohio
| City | Salvadoran | vs State | vs National | |
| 1. | Columbus | 5,260 | 13,925(37.77%)#1 | 2,389,469(0.22%)#61 |
| 2. | Cleveland | 845 | 13,925(6.07%)#2 | 2,389,469(0.04%)#422 |
| 3. | Canton | 388 | 13,925(2.79%)#3 | 2,389,469(0.02%)#802 |
| 4. | Forest Park | 345 | 13,925(2.48%)#4 | 2,389,469(0.01%)#866 |
| 5. | Cuyahoga Falls | 325 | 13,925(2.33%)#5 | 2,389,469(0.01%)#894 |
| 6. | Hamilton | 304 | 13,925(2.18%)#6 | 2,389,469(0.01%)#941 |
| 7. | Dayton | 274 | 13,925(1.97%)#7 | 2,389,469(0.01%)#1,013 |
| 8. | Whitehall | 226 | 13,925(1.62%)#8 | 2,389,469(0.01%)#1,177 |
| 9. | Lincoln Village | 195 | 13,925(1.40%)#9 | 2,389,469(0.01%)#1,276 |
| 10. | Franklin | 190 | 13,925(1.36%)#10 | 2,389,469(0.01%)#1,293 |
| 11. | North Ridgeville | 188 | 13,925(1.35%)#11 | 2,389,469(0.01%)#1,298 |
| 12. | Reynoldsburg | 164 | 13,925(1.18%)#12 | 2,389,469(0.01%)#1,402 |
| 13. | Grove City | 142 | 13,925(1.02%)#13 | 2,389,469(0.01%)#1,512 |
| 14. | Toledo | 139 | 13,925(1.00%)#14 | 2,389,469(0.01%)#1,521 |
| 15. | Medina | 102 | 13,925(0.73%)#15 | 2,389,469(0.00%)#1,776 |
| 16. | Riverside | 92 | 13,925(0.66%)#16 | 2,389,469(0.00%)#1,863 |
| 17. | North Olmsted | 91 | 13,925(0.65%)#17 | 2,389,469(0.00%)#1,873 |
| 18. | Campbell | 91 | 13,925(0.65%)#18 | 2,389,469(0.00%)#1,875 |
| 19. | Centerville | 87 | 13,925(0.62%)#19 | 2,389,469(0.00%)#1,914 |
| 20. | Strongsville | 85 | 13,925(0.61%)#20 | 2,389,469(0.00%)#1,932 |
| 21. | Defiance | 85 | 13,925(0.61%)#21 | 2,389,469(0.00%)#1,943 |
| 22. | Brook Park | 82 | 13,925(0.59%)#22 | 2,389,469(0.00%)#1,972 |
| 23. | Parma | 78 | 13,925(0.56%)#23 | 2,389,469(0.00%)#2,006 |
| 24. | Elyria | 75 | 13,925(0.54%)#24 | 2,389,469(0.00%)#2,064 |
| 25. | Perrysburg | 74 | 13,925(0.53%)#25 | 2,389,469(0.00%)#2,085 |
| 26. | Athens | 71 | 13,925(0.51%)#26 | 2,389,469(0.00%)#2,127 |
| 27. | Shaker Heights | 70 | 13,925(0.50%)#27 | 2,389,469(0.00%)#2,145 |
| 28. | Beachwood | 68 | 13,925(0.49%)#28 | 2,389,469(0.00%)#2,171 |
| 29. | Cincinnati | 66 | 13,925(0.47%)#29 | 2,389,469(0.00%)#2,201 |
| 30. | West Carrollton | 63 | 13,925(0.45%)#30 | 2,389,469(0.00%)#2,260 |
| 31. | Fostoria | 57 | 13,925(0.41%)#31 | 2,389,469(0.00%)#2,365 |
| 32. | Alliance | 52 | 13,925(0.37%)#32 | 2,389,469(0.00%)#2,447 |
| 33. | New Albany | 48 | 13,925(0.34%)#33 | 2,389,469(0.00%)#2,540 |
| 34. | Troy | 47 | 13,925(0.34%)#34 | 2,389,469(0.00%)#2,555 |
| 35. | Mason | 44 | 13,925(0.32%)#35 | 2,389,469(0.00%)#2,620 |
| 36. | Lorain | 43 | 13,925(0.31%)#36 | 2,389,469(0.00%)#2,638 |
| 37. | Marietta | 43 | 13,925(0.31%)#37 | 2,389,469(0.00%)#2,644 |
| 38. | Bradner | 39 | 13,925(0.28%)#38 | 2,389,469(0.00%)#2,770 |
| 39. | Turpin Hills | 38 | 13,925(0.27%)#39 | 2,389,469(0.00%)#2,794 |
| 40. | Broadview Heights | 37 | 13,925(0.27%)#40 | 2,389,469(0.00%)#2,813 |
| 41. | Struthers | 36 | 13,925(0.26%)#41 | 2,389,469(0.00%)#2,846 |
| 42. | Arlington | 36 | 13,925(0.26%)#42 | 2,389,469(0.00%)#2,855 |
| 43. | North Madison | 32 | 13,925(0.23%)#43 | 2,389,469(0.00%)#2,964 |
| 44. | Grafton | 32 | 13,925(0.23%)#44 | 2,389,469(0.00%)#2,968 |
| 45. | Avon | 31 | 13,925(0.22%)#45 | 2,389,469(0.00%)#2,983 |
| 46. | Huber Heights | 30 | 13,925(0.22%)#46 | 2,389,469(0.00%)#3,022 |
| 47. | Marysville | 30 | 13,925(0.22%)#47 | 2,389,469(0.00%)#3,027 |
| 48. | Lakewood | 28 | 13,925(0.20%)#48 | 2,389,469(0.00%)#3,079 |
| 49. | New Burlington | 27 | 13,925(0.19%)#49 | 2,389,469(0.00%)#3,149 |
| 50. | Northbrook | 26 | 13,925(0.19%)#50 | 2,389,469(0.00%)#3,178 |
| 51. | Fairfield | 25 | 13,925(0.18%)#51 | 2,389,469(0.00%)#3,215 |
| 52. | Brunswick | 23 | 13,925(0.17%)#52 | 2,389,469(0.00%)#3,281 |
| 53. | Bowling Green | 23 | 13,925(0.17%)#53 | 2,389,469(0.00%)#3,283 |
| 54. | Baltic | 23 | 13,925(0.17%)#54 | 2,389,469(0.00%)#3,323 |
| 55. | Newark | 19 | 13,925(0.14%)#55 | 2,389,469(0.00%)#3,459 |
| 56. | Warren | 19 | 13,925(0.14%)#56 | 2,389,469(0.00%)#3,460 |
| 57. | Sheffield Lake | 19 | 13,925(0.14%)#57 | 2,389,469(0.00%)#3,481 |
| 58. | Mansfield | 18 | 13,925(0.13%)#58 | 2,389,469(0.00%)#3,512 |
| 59. | Steubenville | 17 | 13,925(0.12%)#59 | 2,389,469(0.00%)#3,564 |
| 60. | Mount Victory | 17 | 13,925(0.12%)#60 | 2,389,469(0.00%)#3,610 |
| 61. | Berea | 16 | 13,925(0.11%)#61 | 2,389,469(0.00%)#3,627 |
| 62. | Ashtabula | 16 | 13,925(0.11%)#62 | 2,389,469(0.00%)#3,628 |
| 63. | Blakeslee | 15 | 13,925(0.11%)#63 | 2,389,469(0.00%)#3,734 |
| 64. | Garfield Heights | 14 | 13,925(0.10%)#64 | 2,389,469(0.00%)#3,741 |
| 65. | Granville | 14 | 13,925(0.10%)#65 | 2,389,469(0.00%)#3,766 |
| 66. | Akron | 13 | 13,925(0.09%)#66 | 2,389,469(0.00%)#3,799 |
| 67. | Harrison | 13 | 13,925(0.09%)#67 | 2,389,469(0.00%)#3,819 |
| 68. | Brooklyn | 13 | 13,925(0.09%)#68 | 2,389,469(0.00%)#3,823 |
| 69. | Springfield | 12 | 13,925(0.09%)#69 | 2,389,469(0.00%)#3,866 |
| 70. | Kettering | 12 | 13,925(0.09%)#70 | 2,389,469(0.00%)#3,867 |
| 71. | Reading | 12 | 13,925(0.09%)#71 | 2,389,469(0.00%)#3,898 |
| 72. | Middleburg Heights | 11 | 13,925(0.08%)#72 | 2,389,469(0.00%)#3,948 |
| 73. | Parma Heights | 9 | 13,925(0.06%)#73 | 2,389,469(0.00%)#4,066 |
| 74. | Sidney | 9 | 13,925(0.06%)#74 | 2,389,469(0.00%)#4,068 |
| 75. | Owensville | 9 | 13,925(0.06%)#75 | 2,389,469(0.00%)#4,131 |
| 76. | Olmsted Falls | 8 | 13,925(0.06%)#76 | 2,389,469(0.00%)#4,167 |
| 77. | Minerva | 8 | 13,925(0.06%)#77 | 2,389,469(0.00%)#4,191 |
| 78. | Scott | 7 | 13,925(0.05%)#78 | 2,389,469(0.00%)#4,302 |
| 79. | Loveland | 6 | 13,925(0.04%)#79 | 2,389,469(0.00%)#4,324 |
| 80. | London | 6 | 13,925(0.04%)#80 | 2,389,469(0.00%)#4,330 |
| 81. | Oberlin | 6 | 13,925(0.04%)#81 | 2,389,469(0.00%)#4,336 |
| 82. | Cedarville | 5 | 13,925(0.04%)#82 | 2,389,469(0.00%)#4,434 |
| 83. | Morrow | 5 | 13,925(0.04%)#83 | 2,389,469(0.00%)#4,444 |
| 84. | Ada | 4 | 13,925(0.03%)#84 | 2,389,469(0.00%)#4,509 |
| 85. | Lithopolis | 4 | 13,925(0.03%)#85 | 2,389,469(0.00%)#4,518 |
| 86. | Geneva On The Lake | 4 | 13,925(0.03%)#86 | 2,389,469(0.00%)#4,542 |
| 87. | West Millgrove | 4 | 13,925(0.03%)#87 | 2,389,469(0.00%)#4,566 |
| 88. | Circleville | 3 | 13,925(0.02%)#88 | 2,389,469(0.00%)#4,575 |
| 89. | Old Washington | 3 | 13,925(0.02%)#89 | 2,389,469(0.00%)#4,652 |
| 90. | East Canton | 2 | 13,925(0.01%)#90 | 2,389,469(0.00%)#4,697 |
| 91. | Carrollton | 1 | 13,925(0.01%)#91 | 2,389,469(0.00%)#4,760 |
| 92. | Glouster | 1 | 13,925(0.01%)#92 | 2,389,469(0.00%)#4,777 |
| 93. | Grand River | 1 | 13,925(0.01%)#93 | 2,389,469(0.00%)#4,794 |
Common Questions
What are the Top 10 Cities with the Largest Salvadoran Community in Ohio?
Top 10 Cities with the Largest Salvadoran Community in Ohio are:
#1
5,260
#2
845
#3
388
#4
345
#5
325
#6
304
#7
274
#8
226
#9
195
#10
190
What city has the Largest Salvadoran Community in Ohio?
Columbus has the Largest Salvadoran Community in Ohio with 5,260.
What is the Total Salvadoran Population in the State of Ohio?
Total Salvadoran Population in Ohio is 13,925.
What is the Total Salvadoran Population in the United States?
Total Salvadoran Population in the United States is 2,389,469.