Cities with the Largest Salvadoran Community in the United States
RELATED REPORTS & OPTIONS
Salvadoran
United States
Compare Cities
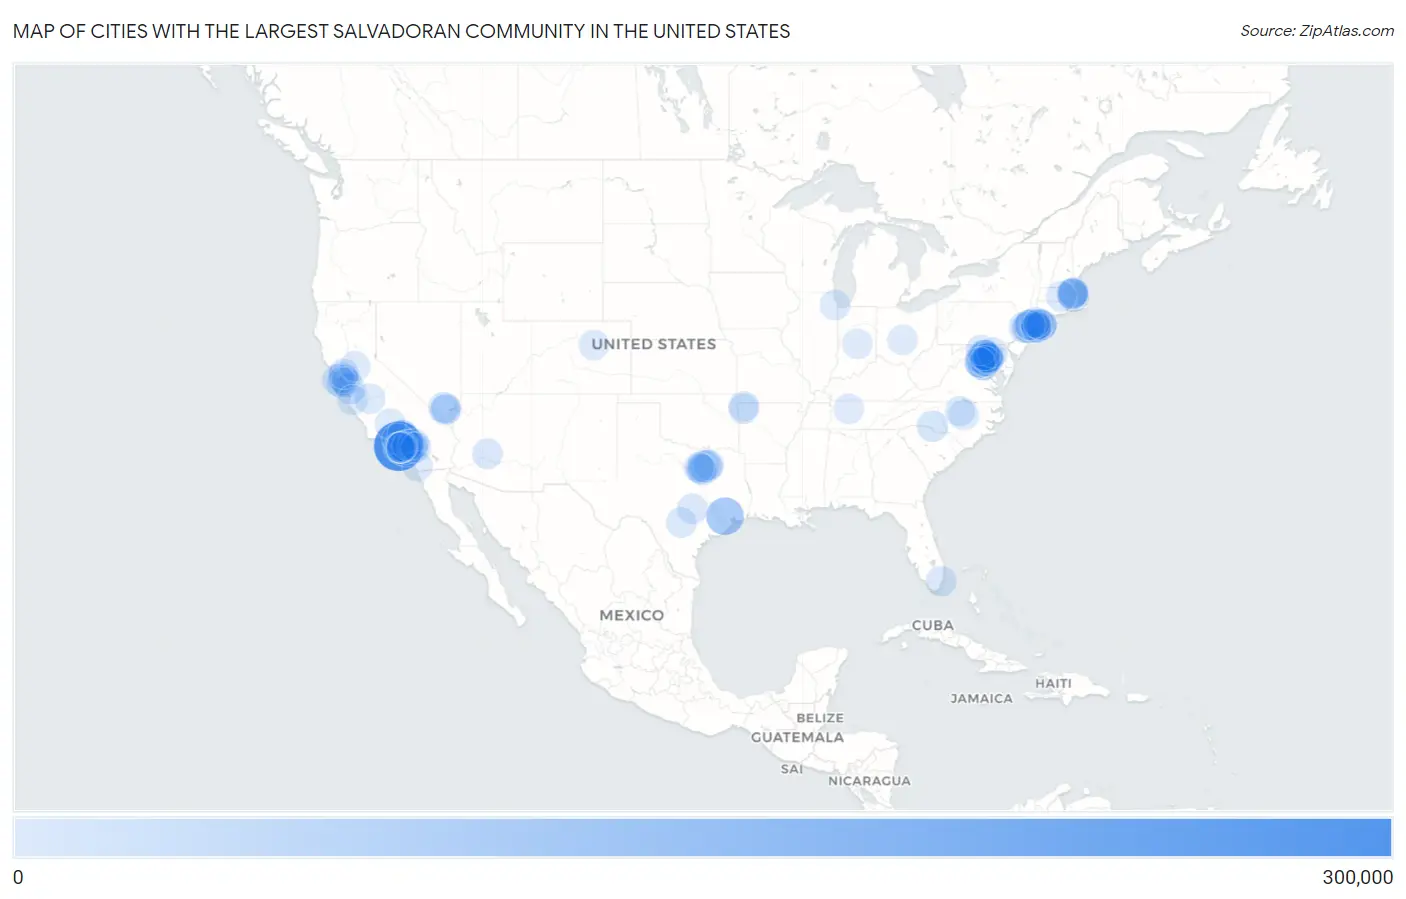
Map of Cities with the Largest Salvadoran Community in the United States
0
300,000
Cities with the Largest Salvadoran Community in the United States
| City | Salvadoran | vs State | vs National | |
| 1. | Los Angeles | 267,160 | 750,864(35.58%)#1 | 2,389,469(11.18%)#1 |
| 2. | Houston | 100,620 | 364,836(27.58%)#1 | 2,389,469(4.21%)#2 |
| 3. | New York | 49,579 | 187,222(26.48%)#1 | 2,389,469(2.07%)#3 |
| 4. | Dallas | 25,716 | 364,836(7.05%)#2 | 2,389,469(1.08%)#4 |
| 5. | Irving | 23,288 | 364,836(6.38%)#3 | 2,389,469(0.97%)#5 |
| 6. | Washington | 17,364 | 17,364(100.00%)#1 | 2,389,469(0.73%)#6 |
| 7. | Brentwood | 16,821 | 187,222(8.98%)#2 | 2,389,469(0.70%)#7 |
| 8. | San Francisco | 16,448 | 750,864(2.19%)#2 | 2,389,469(0.69%)#8 |
| 9. | Charlotte | 14,950 | 60,323(24.78%)#1 | 2,389,469(0.63%)#9 |
| 10. | Palmdale | 13,552 | 750,864(1.80%)#3 | 2,389,469(0.57%)#10 |
| 11. | Hempstead | 12,580 | 187,222(6.72%)#3 | 2,389,469(0.53%)#11 |
| 12. | Wheaton | 12,338 | 197,203(6.26%)#1 | 2,389,469(0.52%)#12 |
| 13. | Dale City | 12,020 | 173,894(6.91%)#1 | 2,389,469(0.50%)#13 |
| 14. | Boston | 12,018 | 72,815(16.50%)#1 | 2,389,469(0.50%)#14 |
| 15. | Elizabeth | 11,383 | 81,142(14.03%)#1 | 2,389,469(0.48%)#15 |
| 16. | Chillum | 11,148 | 197,203(5.65%)#2 | 2,389,469(0.47%)#16 |
| 17. | Las Vegas | 11,090 | 41,416(26.78%)#1 | 2,389,469(0.46%)#17 |
| 18. | Chelsea | 10,455 | 72,815(14.36%)#2 | 2,389,469(0.44%)#18 |
| 19. | San Jose | 10,205 | 750,864(1.36%)#4 | 2,389,469(0.43%)#19 |
| 20. | Central Islip | 9,506 | 187,222(5.08%)#4 | 2,389,469(0.40%)#20 |
| 21. | Richmond | 8,582 | 750,864(1.14%)#5 | 2,389,469(0.36%)#21 |
| 22. | Arlington | 8,450 | 173,894(4.86%)#2 | 2,389,469(0.35%)#22 |
| 23. | Long Beach | 8,008 | 750,864(1.07%)#6 | 2,389,469(0.34%)#23 |
| 24. | Oakland | 7,816 | 750,864(1.04%)#7 | 2,389,469(0.33%)#24 |
| 25. | Aspen Hill | 7,377 | 197,203(3.74%)#3 | 2,389,469(0.31%)#25 |
| 26. | Everett | 7,206 | 72,815(9.90%)#3 | 2,389,469(0.30%)#26 |
| 27. | Miami | 6,985 | 80,792(8.65%)#1 | 2,389,469(0.29%)#27 |
| 28. | Plainfield | 6,802 | 81,142(8.38%)#2 | 2,389,469(0.28%)#28 |
| 29. | Austin | 6,782 | 364,836(1.86%)#4 | 2,389,469(0.28%)#29 |
| 30. | Woodbridge | 6,716 | 173,894(3.86%)#3 | 2,389,469(0.28%)#30 |
| 31. | Revere | 6,693 | 72,815(9.19%)#4 | 2,389,469(0.28%)#31 |
| 32. | Alexandria | 6,594 | 173,894(3.79%)#4 | 2,389,469(0.28%)#32 |
| 33. | Lancaster | 6,592 | 750,864(0.88%)#8 | 2,389,469(0.28%)#33 |
| 34. | Uniondale | 6,540 | 187,222(3.49%)#5 | 2,389,469(0.27%)#34 |
| 35. | Phoenix | 6,379 | 21,320(29.92%)#1 | 2,389,469(0.27%)#35 |
| 36. | Santa Ana | 6,346 | 750,864(0.85%)#9 | 2,389,469(0.27%)#36 |
| 37. | Woodlawn Cdp Fairfax County | 6,309 | 173,894(3.63%)#5 | 2,389,469(0.26%)#37 |
| 38. | Grand Prairie | 6,299 | 364,836(1.73%)#5 | 2,389,469(0.26%)#38 |
| 39. | Garland | 6,279 | 364,836(1.72%)#6 | 2,389,469(0.26%)#39 |
| 40. | Sterling | 6,187 | 173,894(3.56%)#6 | 2,389,469(0.26%)#40 |
| 41. | Bakersfield | 6,164 | 750,864(0.82%)#10 | 2,389,469(0.26%)#41 |
| 42. | Arlington | 6,124 | 364,836(1.68%)#7 | 2,389,469(0.26%)#42 |
| 43. | San Antonio | 6,109 | 364,836(1.67%)#8 | 2,389,469(0.26%)#43 |
| 44. | Germantown | 6,078 | 197,203(3.08%)#4 | 2,389,469(0.25%)#44 |
| 45. | Manassas | 6,000 | 173,894(3.45%)#7 | 2,389,469(0.25%)#45 |
| 46. | Chicago | 5,950 | 20,235(29.40%)#1 | 2,389,469(0.25%)#46 |
| 47. | Union City | 5,924 | 81,142(7.30%)#3 | 2,389,469(0.25%)#47 |
| 48. | Daly City | 5,910 | 750,864(0.79%)#11 | 2,389,469(0.25%)#48 |
| 49. | Gaithersburg | 5,790 | 197,203(2.94%)#5 | 2,389,469(0.24%)#49 |
| 50. | Anaheim | 5,739 | 750,864(0.76%)#12 | 2,389,469(0.24%)#50 |
| 51. | Florence Graham | 5,711 | 750,864(0.76%)#13 | 2,389,469(0.24%)#51 |
| 52. | Fontana | 5,614 | 750,864(0.75%)#14 | 2,389,469(0.23%)#52 |
| 53. | Silver Spring | 5,595 | 197,203(2.84%)#6 | 2,389,469(0.23%)#53 |
| 54. | South Gate | 5,573 | 750,864(0.74%)#15 | 2,389,469(0.23%)#54 |
| 55. | Langley Park | 5,564 | 197,203(2.82%)#7 | 2,389,469(0.23%)#55 |
| 56. | Springdale | 5,512 | 26,050(21.16%)#1 | 2,389,469(0.23%)#56 |
| 57. | Lynn | 5,490 | 72,815(7.54%)#5 | 2,389,469(0.23%)#57 |
| 58. | Freeport | 5,393 | 187,222(2.88%)#6 | 2,389,469(0.23%)#58 |
| 59. | Nashville | 5,335 | 16,080(33.18%)#1 | 2,389,469(0.22%)#59 |
| 60. | Paradise | 5,281 | 41,416(12.75%)#2 | 2,389,469(0.22%)#60 |
| 61. | Columbus | 5,260 | 13,925(37.77%)#1 | 2,389,469(0.22%)#61 |
| 62. | Santa Clarita | 5,181 | 750,864(0.69%)#16 | 2,389,469(0.22%)#62 |
| 63. | Fort Worth | 5,087 | 364,836(1.39%)#9 | 2,389,469(0.21%)#63 |
| 64. | Raleigh | 5,059 | 60,323(8.39%)#2 | 2,389,469(0.21%)#64 |
| 65. | Hayward | 4,981 | 750,864(0.66%)#17 | 2,389,469(0.21%)#65 |
| 66. | Inglewood | 4,969 | 750,864(0.66%)#18 | 2,389,469(0.21%)#66 |
| 67. | San Bernardino | 4,968 | 750,864(0.66%)#19 | 2,389,469(0.21%)#67 |
| 68. | Sunrise Manor | 4,960 | 41,416(11.98%)#3 | 2,389,469(0.21%)#68 |
| 69. | East Riverdale | 4,914 | 197,203(2.49%)#8 | 2,389,469(0.21%)#69 |
| 70. | Herndon | 4,873 | 173,894(2.80%)#8 | 2,389,469(0.20%)#70 |
| 71. | Riverside | 4,866 | 750,864(0.65%)#20 | 2,389,469(0.20%)#71 |
| 72. | Mendota | 4,717 | 750,864(0.63%)#21 | 2,389,469(0.20%)#72 |
| 73. | North Bay Shore | 4,712 | 187,222(2.52%)#7 | 2,389,469(0.20%)#73 |
| 74. | New Cassel | 4,688 | 187,222(2.50%)#8 | 2,389,469(0.20%)#74 |
| 75. | Beltsville | 4,651 | 197,203(2.36%)#9 | 2,389,469(0.19%)#75 |
| 76. | Rogers | 4,601 | 26,050(17.66%)#2 | 2,389,469(0.19%)#76 |
| 77. | Roosevelt | 4,565 | 187,222(2.44%)#9 | 2,389,469(0.19%)#77 |
| 78. | Worcester | 4,502 | 72,815(6.18%)#6 | 2,389,469(0.19%)#78 |
| 79. | Huntington Park | 4,375 | 750,864(0.58%)#22 | 2,389,469(0.18%)#79 |
| 80. | Lynwood | 4,362 | 750,864(0.58%)#23 | 2,389,469(0.18%)#80 |
| 81. | Adelphi | 4,347 | 197,203(2.20%)#10 | 2,389,469(0.18%)#81 |
| 82. | Frederick | 4,346 | 197,203(2.20%)#11 | 2,389,469(0.18%)#82 |
| 83. | Baltimore | 4,318 | 197,203(2.19%)#12 | 2,389,469(0.18%)#83 |
| 84. | Sacramento | 4,290 | 750,864(0.57%)#24 | 2,389,469(0.18%)#84 |
| 85. | Aurora | 4,243 | 19,672(21.57%)#1 | 2,389,469(0.18%)#85 |
| 86. | San Diego | 4,242 | 750,864(0.56%)#25 | 2,389,469(0.18%)#86 |
| 87. | Vallejo | 4,242 | 750,864(0.56%)#26 | 2,389,469(0.18%)#87 |
| 88. | Durham | 4,222 | 60,323(7.00%)#3 | 2,389,469(0.18%)#88 |
| 89. | Indianapolis | 4,210 | 13,457(31.28%)#1 | 2,389,469(0.18%)#89 |
| 90. | West New York | 4,201 | 81,142(5.18%)#4 | 2,389,469(0.18%)#90 |
| 91. | Montgomery Village | 4,190 | 197,203(2.12%)#13 | 2,389,469(0.18%)#91 |
| 92. | Pomona | 4,159 | 750,864(0.55%)#27 | 2,389,469(0.17%)#92 |
| 93. | Sudley | 4,159 | 173,894(2.39%)#9 | 2,389,469(0.17%)#93 |
| 94. | Moreno Valley | 4,109 | 750,864(0.55%)#28 | 2,389,469(0.17%)#94 |
| 95. | Westmont | 4,003 | 750,864(0.53%)#29 | 2,389,469(0.17%)#95 |
| 96. | Glen Cove | 3,990 | 187,222(2.13%)#10 | 2,389,469(0.17%)#96 |
| 97. | Huntington Station | 3,986 | 187,222(2.13%)#11 | 2,389,469(0.17%)#97 |
| 98. | Salinas | 3,983 | 750,864(0.53%)#30 | 2,389,469(0.17%)#98 |
| 99. | East Los Angeles | 3,982 | 750,864(0.53%)#31 | 2,389,469(0.17%)#99 |
| 100. | Annandale | 3,981 | 173,894(2.29%)#10 | 2,389,469(0.17%)#100 |
Common Questions
What are the Top 10 Cities with the Largest Salvadoran Community in the United States?
Top 10 Cities with the Largest Salvadoran Community in the United States are:
What city has the Largest Salvadoran Community in the United States?
Los Angeles has the Largest Salvadoran Community in the United States with 267,160.
What is the Total Salvadoran Population in the United States?
Total Salvadoran Population in the United States is 2,389,469.