Cities with the Largest Peruvian Community in Massachusetts
RELATED REPORTS & OPTIONS
Peruvian
Massachusetts
Compare Cities
Map of Cities with the Largest Peruvian Community in Massachusetts
0
1,500
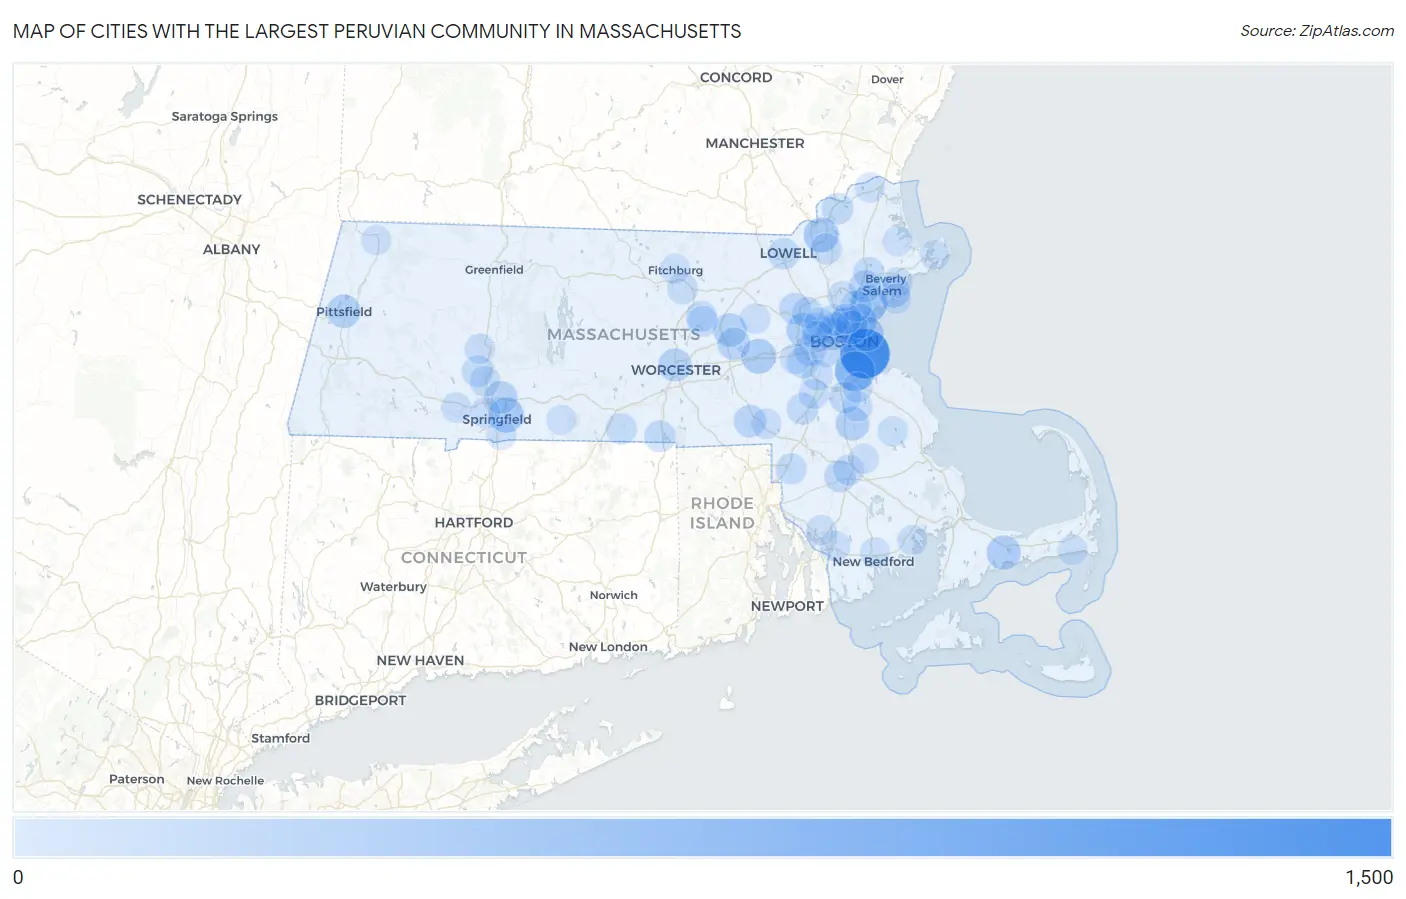
Cities with the Largest Peruvian Community in Massachusetts
| City | Peruvian | vs State | vs National | |
| 1. | Boston | 1,396 | 11,682(11.95%)#1 | 712,740(0.20%)#59 |
| 2. | Quincy | 704 | 11,682(6.03%)#2 | 712,740(0.10%)#151 |
| 3. | Lynn | 486 | 11,682(4.16%)#3 | 712,740(0.07%)#247 |
| 4. | Everett | 370 | 11,682(3.17%)#4 | 712,740(0.05%)#335 |
| 5. | Springfield | 354 | 11,682(3.03%)#5 | 712,740(0.05%)#350 |
| 6. | Lawrence | 343 | 11,682(2.94%)#6 | 712,740(0.05%)#368 |
| 7. | Winthrop Town | 328 | 11,682(2.81%)#7 | 712,740(0.05%)#390 |
| 8. | Framingham | 312 | 11,682(2.67%)#8 | 712,740(0.04%)#406 |
| 9. | Waltham | 292 | 11,682(2.50%)#9 | 712,740(0.04%)#435 |
| 10. | Barnstable Town | 277 | 11,682(2.37%)#10 | 712,740(0.04%)#455 |
| 11. | Revere | 274 | 11,682(2.35%)#11 | 712,740(0.04%)#461 |
| 12. | Brockton | 237 | 11,682(2.03%)#12 | 712,740(0.03%)#541 |
| 13. | Hudson | 235 | 11,682(2.01%)#13 | 712,740(0.03%)#549 |
| 14. | Pittsfield | 231 | 11,682(1.98%)#14 | 712,740(0.03%)#556 |
| 15. | Chelsea | 230 | 11,682(1.97%)#15 | 712,740(0.03%)#558 |
| 16. | Worcester | 215 | 11,682(1.84%)#16 | 712,740(0.03%)#599 |
| 17. | Cambridge | 191 | 11,682(1.63%)#17 | 712,740(0.03%)#670 |
| 18. | Salem | 178 | 11,682(1.52%)#18 | 712,740(0.02%)#719 |
| 19. | Chicopee | 176 | 11,682(1.51%)#19 | 712,740(0.02%)#727 |
| 20. | Marlborough | 172 | 11,682(1.47%)#20 | 712,740(0.02%)#750 |
| 21. | Bellingham | 158 | 11,682(1.35%)#21 | 712,740(0.02%)#796 |
| 22. | Somerville | 147 | 11,682(1.26%)#22 | 712,740(0.02%)#844 |
| 23. | Peabody | 140 | 11,682(1.20%)#23 | 712,740(0.02%)#888 |
| 24. | Newton | 129 | 11,682(1.10%)#24 | 712,740(0.02%)#954 |
| 25. | Taunton | 122 | 11,682(1.04%)#25 | 712,740(0.02%)#1,000 |
| 26. | Hanscom Afb | 122 | 11,682(1.04%)#26 | 712,740(0.02%)#1,006 |
| 27. | Randolph Town | 121 | 11,682(1.04%)#27 | 712,740(0.02%)#1,009 |
| 28. | Belmont | 118 | 11,682(1.01%)#28 | 712,740(0.02%)#1,026 |
| 29. | Brookline | 107 | 11,682(0.92%)#29 | 712,740(0.02%)#1,088 |
| 30. | Haverhill | 103 | 11,682(0.88%)#30 | 712,740(0.01%)#1,111 |
| 31. | Lowell | 99 | 11,682(0.85%)#31 | 712,740(0.01%)#1,138 |
| 32. | Webster | 99 | 11,682(0.85%)#32 | 712,740(0.01%)#1,147 |
| 33. | Walpole | 98 | 11,682(0.84%)#33 | 712,740(0.01%)#1,156 |
| 34. | Easthampton Town | 96 | 11,682(0.82%)#34 | 712,740(0.01%)#1,168 |
| 35. | Needham | 91 | 11,682(0.78%)#35 | 712,740(0.01%)#1,205 |
| 36. | Medford | 89 | 11,682(0.76%)#36 | 712,740(0.01%)#1,225 |
| 37. | Lexington | 85 | 11,682(0.73%)#37 | 712,740(0.01%)#1,272 |
| 38. | Southbridge Town | 81 | 11,682(0.69%)#38 | 712,740(0.01%)#1,321 |
| 39. | Andover | 80 | 11,682(0.68%)#39 | 712,740(0.01%)#1,334 |
| 40. | Amherst | 79 | 11,682(0.68%)#40 | 712,740(0.01%)#1,339 |
| 41. | Saugus | 75 | 11,682(0.64%)#41 | 712,740(0.01%)#1,383 |
| 42. | Danvers | 67 | 11,682(0.57%)#42 | 712,740(0.01%)#1,482 |
| 43. | Attleboro | 60 | 11,682(0.51%)#43 | 712,740(0.01%)#1,570 |
| 44. | South Lancaster | 60 | 11,682(0.51%)#44 | 712,740(0.01%)#1,585 |
| 45. | Clinton | 58 | 11,682(0.50%)#45 | 712,740(0.01%)#1,614 |
| 46. | Leominster | 54 | 11,682(0.46%)#46 | 712,740(0.01%)#1,669 |
| 47. | Raynham Center | 50 | 11,682(0.43%)#47 | 712,740(0.01%)#1,738 |
| 48. | Watertown Town | 49 | 11,682(0.42%)#48 | 712,740(0.01%)#1,745 |
| 49. | Holyoke | 46 | 11,682(0.39%)#49 | 712,740(0.01%)#1,801 |
| 50. | Dedham | 37 | 11,682(0.32%)#50 | 712,740(0.01%)#2,000 |
| 51. | Fall River | 35 | 11,682(0.30%)#51 | 712,740(0.00%)#2,043 |
| 52. | Beverly | 35 | 11,682(0.30%)#52 | 712,740(0.00%)#2,047 |
| 53. | North Attleborough | 35 | 11,682(0.30%)#53 | 712,740(0.00%)#2,050 |
| 54. | Holbrook | 30 | 11,682(0.26%)#54 | 712,740(0.00%)#2,181 |
| 55. | Wellesley | 29 | 11,682(0.25%)#55 | 712,740(0.00%)#2,201 |
| 56. | Norwood | 28 | 11,682(0.24%)#56 | 712,740(0.00%)#2,234 |
| 57. | Wakefield | 26 | 11,682(0.22%)#57 | 712,740(0.00%)#2,296 |
| 58. | Braintree Town | 25 | 11,682(0.21%)#58 | 712,740(0.00%)#2,327 |
| 59. | Franklin Town | 25 | 11,682(0.21%)#59 | 712,740(0.00%)#2,329 |
| 60. | Westfield | 17 | 11,682(0.15%)#60 | 712,740(0.00%)#2,671 |
| 61. | West Springfield Town | 16 | 11,682(0.14%)#61 | 712,740(0.00%)#2,737 |
| 62. | Northampton | 16 | 11,682(0.14%)#62 | 712,740(0.00%)#2,738 |
| 63. | Marblehead | 16 | 11,682(0.14%)#63 | 712,740(0.00%)#2,741 |
| 64. | Maynard | 15 | 11,682(0.13%)#64 | 712,740(0.00%)#2,795 |
| 65. | Hanson | 14 | 11,682(0.12%)#65 | 712,740(0.00%)#2,863 |
| 66. | Marion Center | 13 | 11,682(0.11%)#66 | 712,740(0.00%)#2,913 |
| 67. | Malden | 11 | 11,682(0.09%)#67 | 712,740(0.00%)#2,979 |
| 68. | Arlington | 11 | 11,682(0.09%)#68 | 712,740(0.00%)#2,982 |
| 69. | Gloucester | 11 | 11,682(0.09%)#69 | 712,740(0.00%)#2,985 |
| 70. | Amesbury Town | 11 | 11,682(0.09%)#70 | 712,740(0.00%)#2,994 |
| 71. | Fitchburg | 10 | 11,682(0.09%)#71 | 712,740(0.00%)#3,038 |
| 72. | Harwich Port | 10 | 11,682(0.09%)#72 | 712,740(0.00%)#3,089 |
| 73. | Bridgewater Town | 9 | 11,682(0.08%)#73 | 712,740(0.00%)#3,116 |
| 74. | New Bedford | 8 | 11,682(0.07%)#74 | 712,740(0.00%)#3,191 |
| 75. | Ipswich | 8 | 11,682(0.07%)#75 | 712,740(0.00%)#3,232 |
| 76. | North Adams | 6 | 11,682(0.05%)#76 | 712,740(0.00%)#3,351 |
| 77. | Somerset | 4 | 11,682(0.03%)#77 | 712,740(0.00%)#3,483 |
| 78. | Longmeadow | 4 | 11,682(0.03%)#78 | 712,740(0.00%)#3,487 |
| 79. | Monson Center | 1 | 11,682(0.01%)#79 | 712,740(0.00%)#3,689 |
Common Questions
What are the Top 10 Cities with the Largest Peruvian Community in Massachusetts?
Top 10 Cities with the Largest Peruvian Community in Massachusetts are:
#1
1,396
#2
704
#3
486
#4
370
#5
354
#6
343
#7
328
#8
312
#9
292
#10
277
What city has the Largest Peruvian Community in Massachusetts?
Boston has the Largest Peruvian Community in Massachusetts with 1,396.
What is the Total Peruvian Population in the State of Massachusetts?
Total Peruvian Population in Massachusetts is 11,682.
What is the Total Peruvian Population in the United States?
Total Peruvian Population in the United States is 712,740.