Cities with the Largest Peruvian Community in Illinois
RELATED REPORTS & OPTIONS
Peruvian
Illinois
Compare Cities
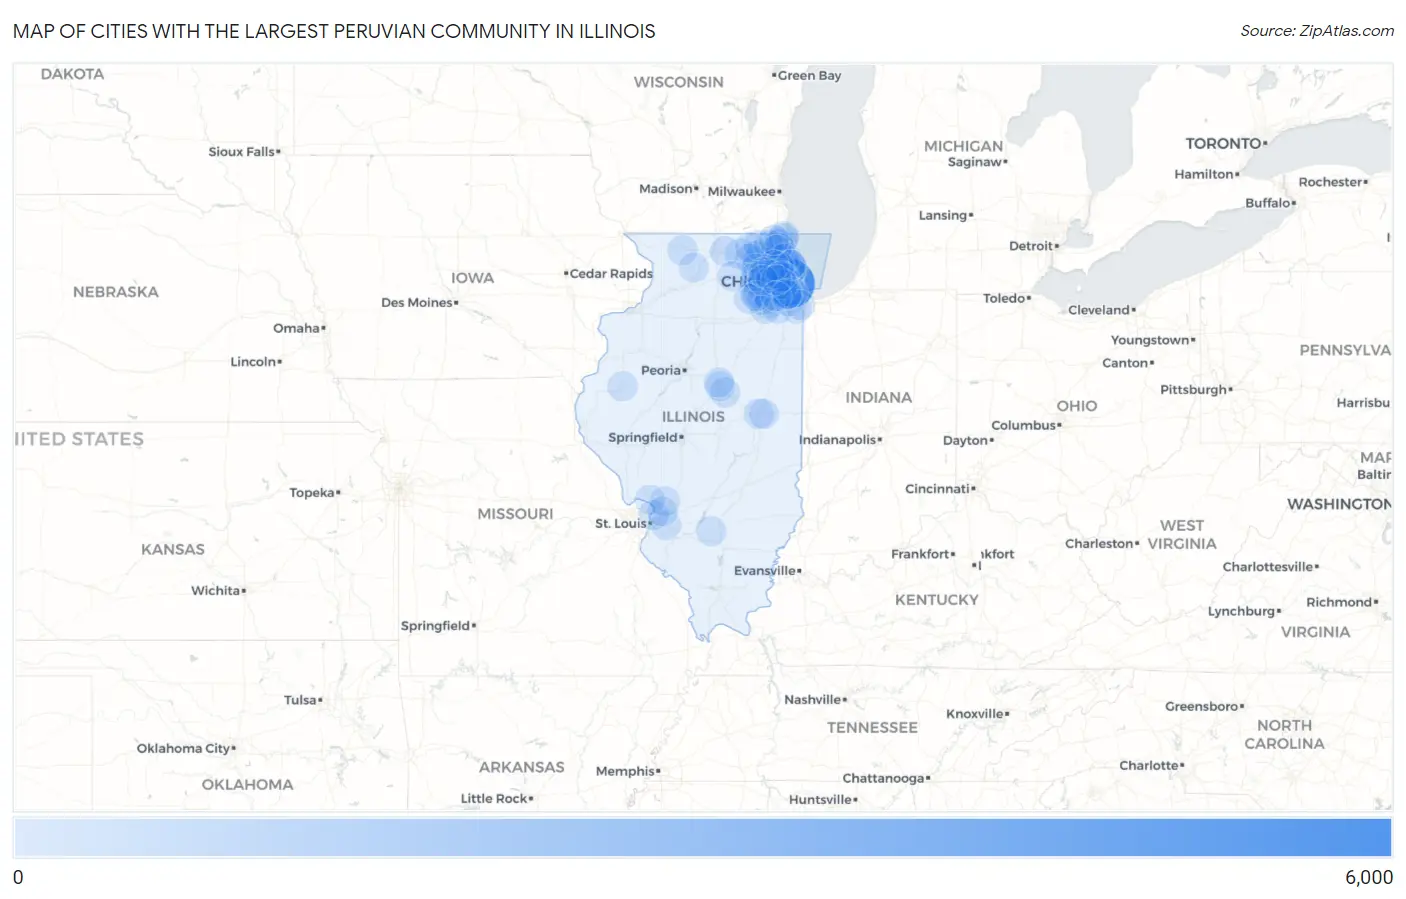
Map of Cities with the Largest Peruvian Community in Illinois
0
6,000
Cities with the Largest Peruvian Community in Illinois
| City | Peruvian | vs State | vs National | |
| 1. | Chicago | 5,536 | 13,798(40.12%)#1 | 712,740(0.78%)#4 |
| 2. | Skokie | 257 | 13,798(1.86%)#2 | 712,740(0.04%)#498 |
| 3. | Carol Stream | 245 | 13,798(1.78%)#3 | 712,740(0.03%)#523 |
| 4. | Berwyn | 239 | 13,798(1.73%)#4 | 712,740(0.03%)#538 |
| 5. | Waukegan | 219 | 13,798(1.59%)#5 | 712,740(0.03%)#589 |
| 6. | Hoffman Estates | 218 | 13,798(1.58%)#6 | 712,740(0.03%)#593 |
| 7. | Naperville | 209 | 13,798(1.51%)#7 | 712,740(0.03%)#611 |
| 8. | Aurora | 203 | 13,798(1.47%)#8 | 712,740(0.03%)#635 |
| 9. | Cary | 201 | 13,798(1.46%)#9 | 712,740(0.03%)#639 |
| 10. | Wheeling | 200 | 13,798(1.45%)#10 | 712,740(0.03%)#640 |
| 11. | Lake In The Hills | 190 | 13,798(1.38%)#11 | 712,740(0.03%)#681 |
| 12. | Palatine | 181 | 13,798(1.31%)#12 | 712,740(0.03%)#712 |
| 13. | Schaumburg | 170 | 13,798(1.23%)#13 | 712,740(0.02%)#755 |
| 14. | Cicero | 168 | 13,798(1.22%)#14 | 712,740(0.02%)#763 |
| 15. | Lyons | 161 | 13,798(1.17%)#15 | 712,740(0.02%)#788 |
| 16. | Champaign | 135 | 13,798(0.98%)#16 | 712,740(0.02%)#924 |
| 17. | Montgomery | 132 | 13,798(0.96%)#17 | 712,740(0.02%)#939 |
| 18. | Oak Park | 126 | 13,798(0.91%)#18 | 712,740(0.02%)#975 |
| 19. | Buffalo Grove | 126 | 13,798(0.91%)#19 | 712,740(0.02%)#976 |
| 20. | Bolingbrook | 120 | 13,798(0.87%)#20 | 712,740(0.02%)#1,015 |
| 21. | Arlington Heights | 118 | 13,798(0.86%)#21 | 712,740(0.02%)#1,023 |
| 22. | Lincolnwood | 115 | 13,798(0.83%)#22 | 712,740(0.02%)#1,046 |
| 23. | Forest Park | 114 | 13,798(0.83%)#23 | 712,740(0.02%)#1,050 |
| 24. | Lombard | 105 | 13,798(0.76%)#24 | 712,740(0.01%)#1,102 |
| 25. | Streamwood | 105 | 13,798(0.76%)#25 | 712,740(0.01%)#1,104 |
| 26. | Melrose Park | 103 | 13,798(0.75%)#26 | 712,740(0.01%)#1,113 |
| 27. | Des Plaines | 90 | 13,798(0.65%)#27 | 712,740(0.01%)#1,211 |
| 28. | Marengo | 90 | 13,798(0.65%)#28 | 712,740(0.01%)#1,219 |
| 29. | Elmhurst | 89 | 13,798(0.65%)#29 | 712,740(0.01%)#1,226 |
| 30. | Freeport | 89 | 13,798(0.65%)#30 | 712,740(0.01%)#1,228 |
| 31. | Evanston | 86 | 13,798(0.62%)#31 | 712,740(0.01%)#1,257 |
| 32. | Beach Park | 82 | 13,798(0.59%)#32 | 712,740(0.01%)#1,312 |
| 33. | Carpentersville | 79 | 13,798(0.57%)#33 | 712,740(0.01%)#1,338 |
| 34. | Zion | 79 | 13,798(0.57%)#34 | 712,740(0.01%)#1,341 |
| 35. | Wilmette | 74 | 13,798(0.54%)#35 | 712,740(0.01%)#1,395 |
| 36. | Geneva | 74 | 13,798(0.54%)#36 | 712,740(0.01%)#1,396 |
| 37. | Huntley | 73 | 13,798(0.53%)#37 | 712,740(0.01%)#1,409 |
| 38. | Batavia | 73 | 13,798(0.53%)#38 | 712,740(0.01%)#1,410 |
| 39. | Green Oaks | 72 | 13,798(0.52%)#39 | 712,740(0.01%)#1,424 |
| 40. | Belvidere | 68 | 13,798(0.49%)#40 | 712,740(0.01%)#1,463 |
| 41. | Downs | 66 | 13,798(0.48%)#41 | 712,740(0.01%)#1,497 |
| 42. | Centralia | 64 | 13,798(0.46%)#42 | 712,740(0.01%)#1,523 |
| 43. | Burbank | 62 | 13,798(0.45%)#43 | 712,740(0.01%)#1,548 |
| 44. | Bensenville | 62 | 13,798(0.45%)#44 | 712,740(0.01%)#1,550 |
| 45. | Highland Park | 60 | 13,798(0.43%)#45 | 712,740(0.01%)#1,572 |
| 46. | Bridgeview | 60 | 13,798(0.43%)#46 | 712,740(0.01%)#1,577 |
| 47. | Elk Grove Village | 56 | 13,798(0.41%)#47 | 712,740(0.01%)#1,639 |
| 48. | Hometown | 56 | 13,798(0.41%)#48 | 712,740(0.01%)#1,650 |
| 49. | Hanover Park | 51 | 13,798(0.37%)#49 | 712,740(0.01%)#1,721 |
| 50. | Wheaton | 50 | 13,798(0.36%)#50 | 712,740(0.01%)#1,726 |
| 51. | Crest Hill | 50 | 13,798(0.36%)#51 | 712,740(0.01%)#1,729 |
| 52. | Plainfield | 47 | 13,798(0.34%)#52 | 712,740(0.01%)#1,783 |
| 53. | Glendale Heights | 47 | 13,798(0.34%)#53 | 712,740(0.01%)#1,786 |
| 54. | Indian Head Park | 45 | 13,798(0.33%)#54 | 712,740(0.01%)#1,835 |
| 55. | St Charles | 44 | 13,798(0.32%)#55 | 712,740(0.01%)#1,843 |
| 56. | Wood Dale | 43 | 13,798(0.31%)#56 | 712,740(0.01%)#1,866 |
| 57. | Gurnee | 42 | 13,798(0.30%)#57 | 712,740(0.01%)#1,879 |
| 58. | Deerfield | 41 | 13,798(0.30%)#58 | 712,740(0.01%)#1,901 |
| 59. | Mchenry | 39 | 13,798(0.28%)#59 | 712,740(0.01%)#1,945 |
| 60. | O Fallon | 38 | 13,798(0.28%)#60 | 712,740(0.01%)#1,968 |
| 61. | Romeoville | 37 | 13,798(0.27%)#61 | 712,740(0.01%)#1,994 |
| 62. | Joliet | 36 | 13,798(0.26%)#62 | 712,740(0.01%)#2,018 |
| 63. | Holiday Shores | 35 | 13,798(0.25%)#63 | 712,740(0.00%)#2,061 |
| 64. | Yorkville | 34 | 13,798(0.25%)#64 | 712,740(0.00%)#2,075 |
| 65. | Round Lake | 34 | 13,798(0.25%)#65 | 712,740(0.00%)#2,077 |
| 66. | Chicago Heights | 33 | 13,798(0.24%)#66 | 712,740(0.00%)#2,094 |
| 67. | Mount Morris | 33 | 13,798(0.24%)#67 | 712,740(0.00%)#2,112 |
| 68. | Elgin | 31 | 13,798(0.22%)#68 | 712,740(0.00%)#2,141 |
| 69. | New Lenox | 31 | 13,798(0.22%)#69 | 712,740(0.00%)#2,142 |
| 70. | Granite City | 31 | 13,798(0.22%)#70 | 712,740(0.00%)#2,143 |
| 71. | River Grove | 31 | 13,798(0.22%)#71 | 712,740(0.00%)#2,152 |
| 72. | Glen Ellyn | 30 | 13,798(0.22%)#72 | 712,740(0.00%)#2,172 |
| 73. | Brookfield | 30 | 13,798(0.22%)#73 | 712,740(0.00%)#2,176 |
| 74. | Bloomington | 29 | 13,798(0.21%)#74 | 712,740(0.00%)#2,195 |
| 75. | Oak Forest | 29 | 13,798(0.21%)#75 | 712,740(0.00%)#2,202 |
| 76. | Godfrey | 29 | 13,798(0.21%)#76 | 712,740(0.00%)#2,207 |
| 77. | Libertyville | 28 | 13,798(0.20%)#77 | 712,740(0.00%)#2,238 |
| 78. | Lansing | 27 | 13,798(0.20%)#78 | 712,740(0.00%)#2,262 |
| 79. | Evergreen Park | 27 | 13,798(0.20%)#79 | 712,740(0.00%)#2,267 |
| 80. | Northlake | 27 | 13,798(0.20%)#80 | 712,740(0.00%)#2,275 |
| 81. | Woodstock | 26 | 13,798(0.19%)#81 | 712,740(0.00%)#2,298 |
| 82. | La Grange Park | 25 | 13,798(0.18%)#82 | 712,740(0.00%)#2,335 |
| 83. | Worth | 25 | 13,798(0.18%)#83 | 712,740(0.00%)#2,339 |
| 84. | Oswego | 24 | 13,798(0.17%)#84 | 712,740(0.00%)#2,366 |
| 85. | Mount Prospect | 23 | 13,798(0.17%)#85 | 712,740(0.00%)#2,400 |
| 86. | Kenilworth | 23 | 13,798(0.17%)#86 | 712,740(0.00%)#2,428 |
| 87. | Dekalb | 22 | 13,798(0.16%)#87 | 712,740(0.00%)#2,443 |
| 88. | Urbana | 22 | 13,798(0.16%)#88 | 712,740(0.00%)#2,445 |
| 89. | Bloomingdale | 22 | 13,798(0.16%)#89 | 712,740(0.00%)#2,454 |
| 90. | Macomb | 22 | 13,798(0.16%)#90 | 712,740(0.00%)#2,460 |
| 91. | Bartlett | 21 | 13,798(0.15%)#91 | 712,740(0.00%)#2,493 |
| 92. | Edwardsville | 21 | 13,798(0.15%)#92 | 712,740(0.00%)#2,502 |
| 93. | Rolling Meadows | 21 | 13,798(0.15%)#93 | 712,740(0.00%)#2,505 |
| 94. | Lindenhurst | 21 | 13,798(0.15%)#94 | 712,740(0.00%)#2,510 |
| 95. | Normal | 20 | 13,798(0.14%)#95 | 712,740(0.00%)#2,543 |
| 96. | West Chicago | 19 | 13,798(0.14%)#96 | 712,740(0.00%)#2,588 |
| 97. | Franklin Park | 19 | 13,798(0.14%)#97 | 712,740(0.00%)#2,594 |
| 98. | Chicago Ridge | 19 | 13,798(0.14%)#98 | 712,740(0.00%)#2,595 |
| 99. | Villa Park | 18 | 13,798(0.13%)#99 | 712,740(0.00%)#2,633 |
| 100. | Lemont | 18 | 13,798(0.13%)#100 | 712,740(0.00%)#2,636 |
Common Questions
What are the Top 10 Cities with the Largest Peruvian Community in Illinois?
Top 10 Cities with the Largest Peruvian Community in Illinois are:
#1
5,536
#2
257
#3
245
#4
239
#5
219
#6
218
#7
209
#8
203
#9
201
#10
200
What city has the Largest Peruvian Community in Illinois?
Chicago has the Largest Peruvian Community in Illinois with 5,536.
What is the Total Peruvian Population in the State of Illinois?
Total Peruvian Population in Illinois is 13,798.
What is the Total Peruvian Population in the United States?
Total Peruvian Population in the United States is 712,740.