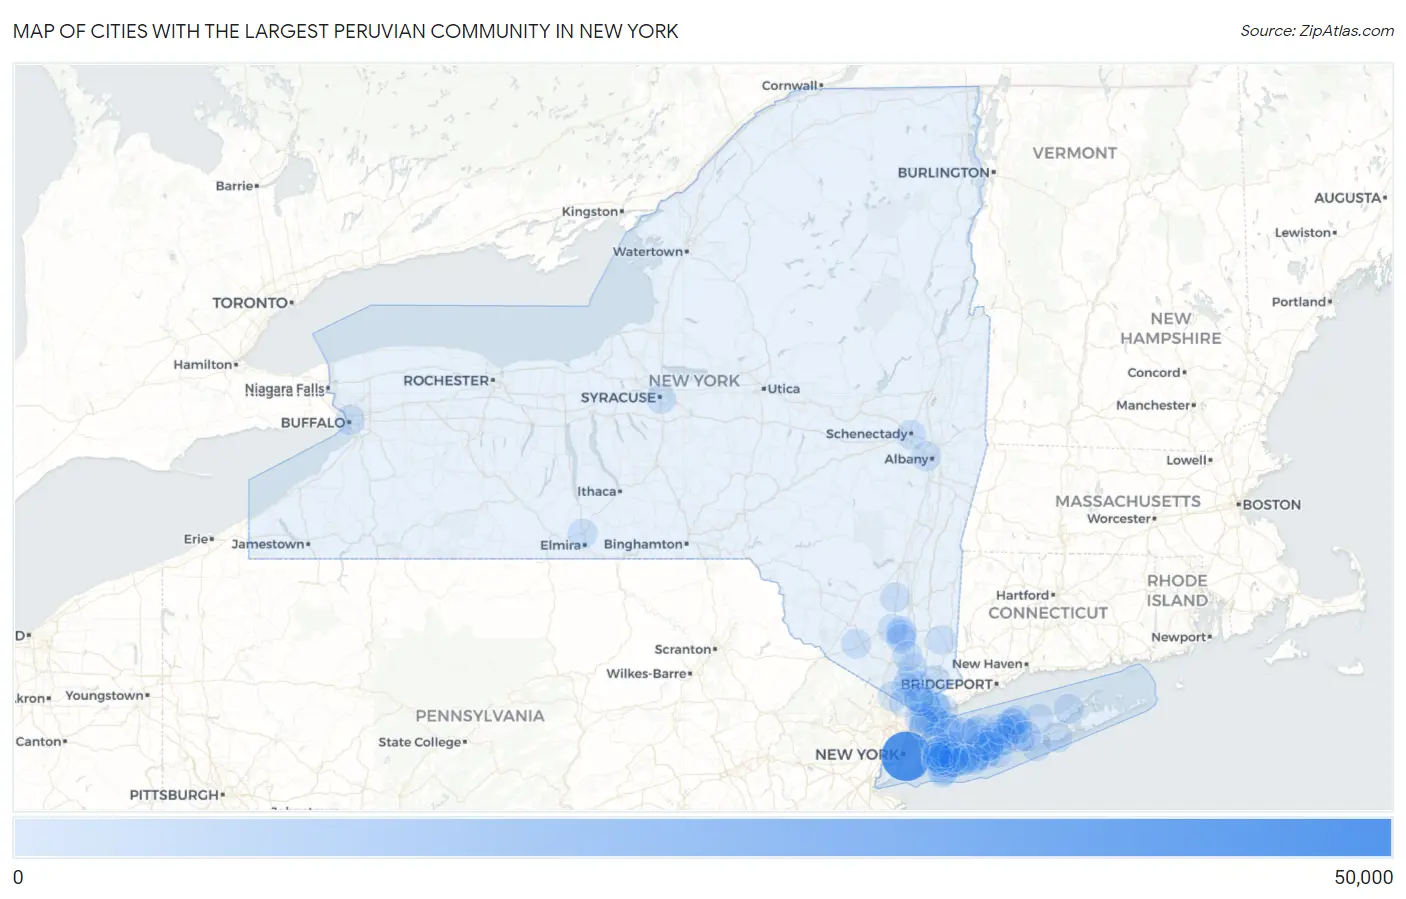
Cities with the Largest Peruvian Community in New York
RELATED REPORTS & OPTIONS
Peruvian
New York
Compare Cities
Map of Cities with the Largest Peruvian Community in New York
0
50,000
Cities with the Largest Peruvian Community in New York
| City | Peruvian | vs State | vs National | |
| 1. | New York | 42,420 | 82,961(51.13%)#1 | 712,740(5.95%)#1 |
| 2. | Brentwood | 2,904 | 82,961(3.50%)#2 | 712,740(0.41%)#15 |
| 3. | White Plains | 2,822 | 82,961(3.40%)#3 | 712,740(0.40%)#16 |
| 4. | Port Chester | 1,960 | 82,961(2.36%)#4 | 712,740(0.27%)#32 |
| 5. | Franklin Square | 1,030 | 82,961(1.24%)#5 | 712,740(0.14%)#93 |
| 6. | New Rochelle | 898 | 82,961(1.08%)#6 | 712,740(0.13%)#109 |
| 7. | Yonkers | 846 | 82,961(1.02%)#7 | 712,740(0.12%)#123 |
| 8. | Newburgh | 743 | 82,961(0.90%)#8 | 712,740(0.10%)#141 |
| 9. | Elmont | 675 | 82,961(0.81%)#9 | 712,740(0.09%)#168 |
| 10. | Valley Stream | 613 | 82,961(0.74%)#10 | 712,740(0.09%)#188 |
| 11. | Island Park | 600 | 82,961(0.72%)#11 | 712,740(0.08%)#192 |
| 12. | Glen Cove | 596 | 82,961(0.72%)#12 | 712,740(0.08%)#197 |
| 13. | Bay Shore | 583 | 82,961(0.70%)#13 | 712,740(0.08%)#201 |
| 14. | New Hyde Park | 563 | 82,961(0.68%)#14 | 712,740(0.08%)#211 |
| 15. | Oceanside | 531 | 82,961(0.64%)#15 | 712,740(0.07%)#224 |
| 16. | Baywood | 510 | 82,961(0.61%)#16 | 712,740(0.07%)#239 |
| 17. | Central Islip | 434 | 82,961(0.52%)#17 | 712,740(0.06%)#287 |
| 18. | Manorhaven | 388 | 82,961(0.47%)#18 | 712,740(0.05%)#315 |
| 19. | East Meadow | 376 | 82,961(0.45%)#19 | 712,740(0.05%)#330 |
| 20. | Levittown | 347 | 82,961(0.42%)#20 | 712,740(0.05%)#360 |
| 21. | Farmingville | 344 | 82,961(0.41%)#21 | 712,740(0.05%)#367 |
| 22. | Orange Lake | 336 | 82,961(0.41%)#22 | 712,740(0.05%)#378 |
| 23. | Baldwin | 331 | 82,961(0.40%)#23 | 712,740(0.05%)#386 |
| 24. | Westbury | 331 | 82,961(0.40%)#24 | 712,740(0.05%)#388 |
| 25. | Mamaroneck | 324 | 82,961(0.39%)#25 | 712,740(0.05%)#396 |
| 26. | Lynbrook | 321 | 82,961(0.39%)#26 | 712,740(0.05%)#400 |
| 27. | Mattituck | 309 | 82,961(0.37%)#27 | 712,740(0.04%)#412 |
| 28. | Ossining | 305 | 82,961(0.37%)#28 | 712,740(0.04%)#419 |
| 29. | Uniondale | 284 | 82,961(0.34%)#29 | 712,740(0.04%)#448 |
| 30. | Elmsford | 282 | 82,961(0.34%)#30 | 712,740(0.04%)#450 |
| 31. | Hempstead | 271 | 82,961(0.33%)#31 | 712,740(0.04%)#469 |
| 32. | Selden | 268 | 82,961(0.32%)#32 | 712,740(0.04%)#474 |
| 33. | Balmville | 264 | 82,961(0.32%)#33 | 712,740(0.04%)#482 |
| 34. | Mount Kisco | 261 | 82,961(0.31%)#34 | 712,740(0.04%)#489 |
| 35. | Peekskill | 245 | 82,961(0.30%)#35 | 712,740(0.03%)#524 |
| 36. | Terryville | 240 | 82,961(0.29%)#36 | 712,740(0.03%)#537 |
| 37. | New City | 227 | 82,961(0.27%)#37 | 712,740(0.03%)#570 |
| 38. | West Babylon | 223 | 82,961(0.27%)#38 | 712,740(0.03%)#581 |
| 39. | Tuckahoe | 210 | 82,961(0.25%)#39 | 712,740(0.03%)#610 |
| 40. | Centereach | 208 | 82,961(0.25%)#40 | 712,740(0.03%)#619 |
| 41. | Tarrytown | 203 | 82,961(0.24%)#41 | 712,740(0.03%)#637 |
| 42. | North Massapequa | 199 | 82,961(0.24%)#42 | 712,740(0.03%)#643 |
| 43. | Hicksville | 197 | 82,961(0.24%)#43 | 712,740(0.03%)#650 |
| 44. | Locust Valley | 195 | 82,961(0.24%)#44 | 712,740(0.03%)#659 |
| 45. | West Islip | 191 | 82,961(0.23%)#45 | 712,740(0.03%)#673 |
| 46. | East Northport | 191 | 82,961(0.23%)#46 | 712,740(0.03%)#674 |
| 47. | Airmont | 186 | 82,961(0.22%)#47 | 712,740(0.03%)#697 |
| 48. | Mount Vernon | 176 | 82,961(0.21%)#48 | 712,740(0.02%)#726 |
| 49. | Glen Head | 176 | 82,961(0.21%)#49 | 712,740(0.02%)#730 |
| 50. | Nesconset | 175 | 82,961(0.21%)#50 | 712,740(0.02%)#734 |
| 51. | Huntington Station | 174 | 82,961(0.21%)#51 | 712,740(0.02%)#737 |
| 52. | Schenectady | 173 | 82,961(0.21%)#52 | 712,740(0.02%)#744 |
| 53. | Harrison | 170 | 82,961(0.20%)#53 | 712,740(0.02%)#757 |
| 54. | Deer Park | 158 | 82,961(0.19%)#54 | 712,740(0.02%)#795 |
| 55. | Freeport | 156 | 82,961(0.19%)#55 | 712,740(0.02%)#802 |
| 56. | Great Neck Plaza | 156 | 82,961(0.19%)#56 | 712,740(0.02%)#805 |
| 57. | Seaford | 155 | 82,961(0.19%)#57 | 712,740(0.02%)#806 |
| 58. | Lindenhurst | 152 | 82,961(0.18%)#58 | 712,740(0.02%)#822 |
| 59. | Port Jefferson Station | 149 | 82,961(0.18%)#59 | 712,740(0.02%)#838 |
| 60. | Long Beach | 147 | 82,961(0.18%)#60 | 712,740(0.02%)#845 |
| 61. | Lake Carmel | 145 | 82,961(0.17%)#61 | 712,740(0.02%)#859 |
| 62. | Westhampton | 144 | 82,961(0.17%)#62 | 712,740(0.02%)#865 |
| 63. | Syracuse | 143 | 82,961(0.17%)#63 | 712,740(0.02%)#868 |
| 64. | New Windsor | 143 | 82,961(0.17%)#64 | 712,740(0.02%)#873 |
| 65. | Horseheads | 143 | 82,961(0.17%)#65 | 712,740(0.02%)#874 |
| 66. | Medford | 140 | 82,961(0.17%)#66 | 712,740(0.02%)#889 |
| 67. | Mineola | 140 | 82,961(0.17%)#67 | 712,740(0.02%)#890 |
| 68. | Buffalo | 136 | 82,961(0.16%)#68 | 712,740(0.02%)#913 |
| 69. | West Hempstead | 132 | 82,961(0.16%)#69 | 712,740(0.02%)#940 |
| 70. | Haverstraw | 132 | 82,961(0.16%)#70 | 712,740(0.02%)#941 |
| 71. | Pearl River | 130 | 82,961(0.16%)#71 | 712,740(0.02%)#951 |
| 72. | Hauppauge | 129 | 82,961(0.16%)#72 | 712,740(0.02%)#956 |
| 73. | Dix Hills | 125 | 82,961(0.15%)#73 | 712,740(0.02%)#983 |
| 74. | New Paltz | 124 | 82,961(0.15%)#74 | 712,740(0.02%)#992 |
| 75. | Laurel Hollow | 123 | 82,961(0.15%)#75 | 712,740(0.02%)#999 |
| 76. | Merrick | 122 | 82,961(0.15%)#76 | 712,740(0.02%)#1,003 |
| 77. | Mastic Beach | 121 | 82,961(0.15%)#77 | 712,740(0.02%)#1,010 |
| 78. | Mount Sinai | 118 | 82,961(0.14%)#78 | 712,740(0.02%)#1,027 |
| 79. | Malverne | 116 | 82,961(0.14%)#79 | 712,740(0.02%)#1,041 |
| 80. | Garden City | 113 | 82,961(0.14%)#80 | 712,740(0.02%)#1,056 |
| 81. | Albany | 112 | 82,961(0.14%)#81 | 712,740(0.02%)#1,060 |
| 82. | Floral Park | 112 | 82,961(0.14%)#82 | 712,740(0.02%)#1,063 |
| 83. | East Islip | 105 | 82,961(0.13%)#83 | 712,740(0.01%)#1,106 |
| 84. | Wading River | 101 | 82,961(0.12%)#84 | 712,740(0.01%)#1,127 |
| 85. | Copiague | 99 | 82,961(0.12%)#85 | 712,740(0.01%)#1,143 |
| 86. | Greenlawn | 99 | 82,961(0.12%)#86 | 712,740(0.01%)#1,146 |
| 87. | Sleepy Hollow | 98 | 82,961(0.12%)#87 | 712,740(0.01%)#1,155 |
| 88. | Coram | 95 | 82,961(0.11%)#88 | 712,740(0.01%)#1,178 |
| 89. | Carmel | 95 | 82,961(0.11%)#89 | 712,740(0.01%)#1,182 |
| 90. | North Merrick | 94 | 82,961(0.11%)#90 | 712,740(0.01%)#1,187 |
| 91. | East Setauket | 94 | 82,961(0.11%)#91 | 712,740(0.01%)#1,188 |
| 92. | North Valley Stream | 93 | 82,961(0.11%)#92 | 712,740(0.01%)#1,191 |
| 93. | Ronkonkoma | 93 | 82,961(0.11%)#93 | 712,740(0.01%)#1,192 |
| 94. | North Bay Shore | 93 | 82,961(0.11%)#94 | 712,740(0.01%)#1,193 |
| 95. | St James | 93 | 82,961(0.11%)#95 | 712,740(0.01%)#1,195 |
| 96. | Middletown | 91 | 82,961(0.11%)#96 | 712,740(0.01%)#1,206 |
| 97. | Yaphank | 90 | 82,961(0.11%)#97 | 712,740(0.01%)#1,220 |
| 98. | Highland Falls | 85 | 82,961(0.10%)#98 | 712,740(0.01%)#1,285 |
| 99. | Massapequa | 83 | 82,961(0.10%)#99 | 712,740(0.01%)#1,299 |
| 100. | Fairview Cdp Westchester County | 82 | 82,961(0.10%)#100 | 712,740(0.01%)#1,316 |
Common Questions
What are the Top 10 Cities with the Largest Peruvian Community in New York?
Top 10 Cities with the Largest Peruvian Community in New York are:
#1
42,420
#2
2,904
#3
2,822
#4
1,960
#5
1,030
#6
898
#7
846
#8
743
#9
675
#10
613
What city has the Largest Peruvian Community in New York?
New York has the Largest Peruvian Community in New York with 42,420.
What is the Total Peruvian Population in the State of New York?
Total Peruvian Population in New York is 82,961.
What is the Total Peruvian Population in the United States?
Total Peruvian Population in the United States is 712,740.