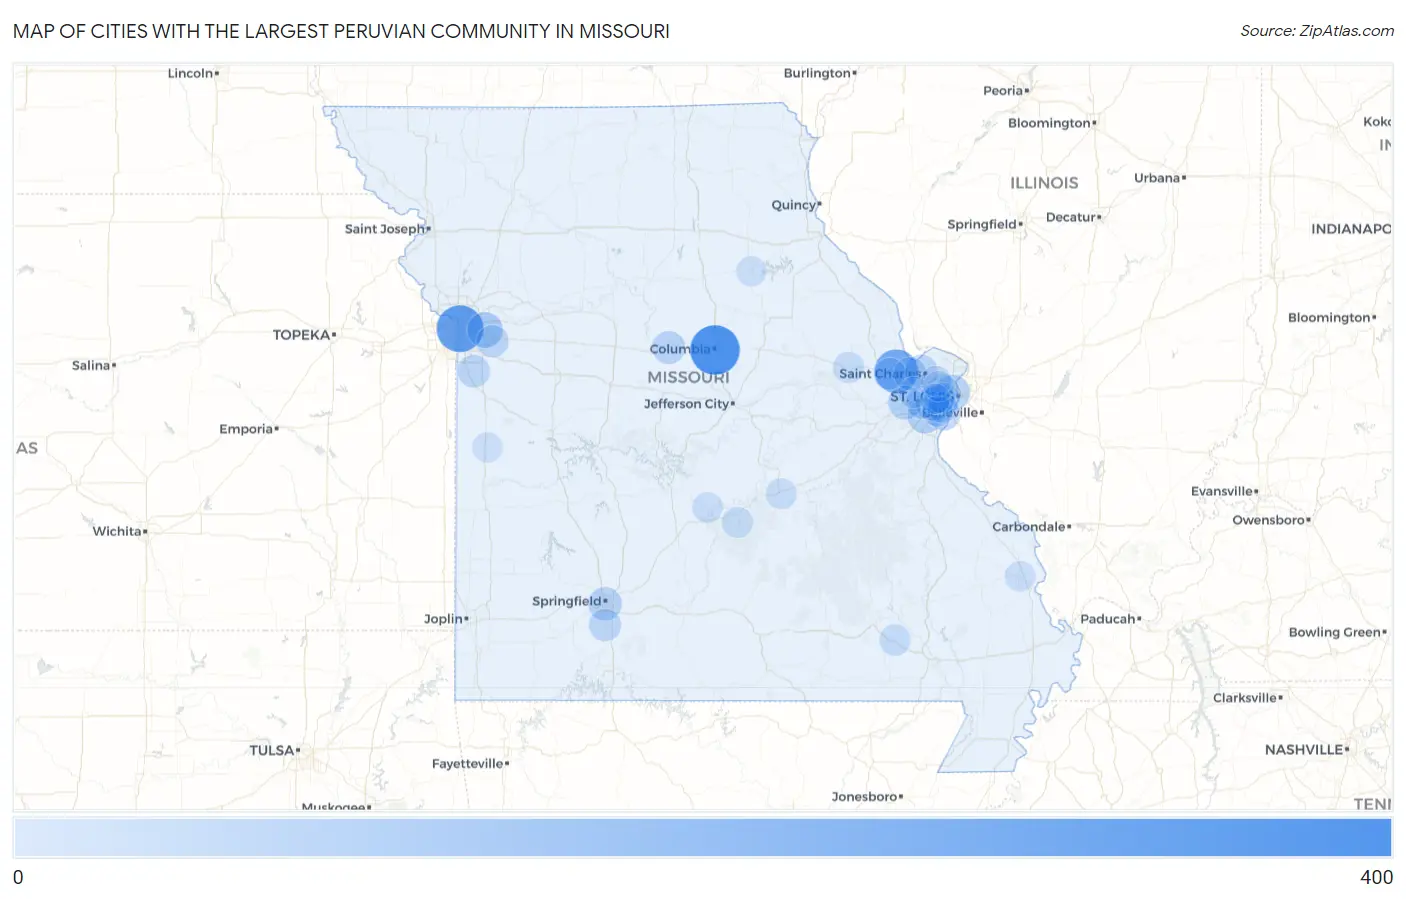
Cities with the Largest Peruvian Community in Missouri
RELATED REPORTS & OPTIONS
Peruvian
Missouri
Compare Cities
Map of Cities with the Largest Peruvian Community in Missouri
0
400
Cities with the Largest Peruvian Community in Missouri
| City | Peruvian | vs State | vs National | |
| 1. | Columbia | 332 | 2,293(14.48%)#1 | 712,740(0.05%)#380 |
| 2. | Kansas City | 285 | 2,293(12.43%)#2 | 712,740(0.04%)#443 |
| 3. | O Fallon | 228 | 2,293(9.94%)#3 | 712,740(0.03%)#564 |
| 4. | Independence | 89 | 2,293(3.88%)#4 | 712,740(0.01%)#1,222 |
| 5. | St Louis | 81 | 2,293(3.53%)#5 | 712,740(0.01%)#1,317 |
| 6. | Murphy | 68 | 2,293(2.97%)#6 | 712,740(0.01%)#1,472 |
| 7. | Wildwood | 61 | 2,293(2.66%)#7 | 712,740(0.01%)#1,559 |
| 8. | Kirkwood | 61 | 2,293(2.66%)#8 | 712,740(0.01%)#1,562 |
| 9. | Springfield | 54 | 2,293(2.35%)#9 | 712,740(0.01%)#1,666 |
| 10. | Mehlville | 54 | 2,293(2.35%)#10 | 712,740(0.01%)#1,671 |
| 11. | St Charles | 48 | 2,293(2.09%)#11 | 712,740(0.01%)#1,764 |
| 12. | St Peters | 47 | 2,293(2.05%)#12 | 712,740(0.01%)#1,781 |
| 13. | Manchester | 44 | 2,293(1.92%)#13 | 712,740(0.01%)#1,849 |
| 14. | Boonville | 44 | 2,293(1.92%)#14 | 712,740(0.01%)#1,853 |
| 15. | Raymore | 38 | 2,293(1.66%)#15 | 712,740(0.01%)#1,970 |
| 16. | Nixa | 35 | 2,293(1.53%)#16 | 712,740(0.00%)#2,052 |
| 17. | Blue Springs | 33 | 2,293(1.44%)#17 | 712,740(0.00%)#2,090 |
| 18. | Lake St Louis | 27 | 2,293(1.18%)#18 | 712,740(0.00%)#2,271 |
| 19. | University City | 25 | 2,293(1.09%)#19 | 712,740(0.00%)#2,328 |
| 20. | Crestwood | 21 | 2,293(0.92%)#20 | 712,740(0.00%)#2,514 |
| 21. | Maplewood | 21 | 2,293(0.92%)#21 | 712,740(0.00%)#2,518 |
| 22. | Warrenton | 18 | 2,293(0.78%)#22 | 712,740(0.00%)#2,644 |
| 23. | Ellsinore | 18 | 2,293(0.78%)#23 | 712,740(0.00%)#2,664 |
| 24. | Chesterfield | 17 | 2,293(0.74%)#24 | 712,740(0.00%)#2,668 |
| 25. | Rock Hill | 17 | 2,293(0.74%)#25 | 712,740(0.00%)#2,708 |
| 26. | Fort Leonard Wood | 14 | 2,293(0.61%)#26 | 712,740(0.00%)#2,832 |
| 27. | Rolla | 11 | 2,293(0.48%)#27 | 712,740(0.00%)#2,989 |
| 28. | Affton | 10 | 2,293(0.44%)#28 | 712,740(0.00%)#3,053 |
| 29. | Brentwood | 9 | 2,293(0.39%)#29 | 712,740(0.00%)#3,144 |
| 30. | St Ann | 7 | 2,293(0.31%)#30 | 712,740(0.00%)#3,288 |
| 31. | Sappington | 7 | 2,293(0.31%)#31 | 712,740(0.00%)#3,295 |
| 32. | Overland | 6 | 2,293(0.26%)#32 | 712,740(0.00%)#3,346 |
| 33. | Jackson | 5 | 2,293(0.22%)#33 | 712,740(0.00%)#3,412 |
| 34. | Richland | 5 | 2,293(0.22%)#34 | 712,740(0.00%)#3,449 |
| 35. | Butler | 3 | 2,293(0.13%)#35 | 712,740(0.00%)#3,563 |
| 36. | Warson Woods | 3 | 2,293(0.13%)#36 | 712,740(0.00%)#3,576 |
| 37. | Paris | 2 | 2,293(0.09%)#37 | 712,740(0.00%)#3,642 |
Common Questions
What are the Top 10 Cities with the Largest Peruvian Community in Missouri?
Top 10 Cities with the Largest Peruvian Community in Missouri are:
#1
332
#2
285
#3
228
#4
89
#5
81
#6
68
#7
61
#8
61
#9
54
#10
54
What city has the Largest Peruvian Community in Missouri?
Columbia has the Largest Peruvian Community in Missouri with 332.
What is the Total Peruvian Population in the State of Missouri?
Total Peruvian Population in Missouri is 2,293.
What is the Total Peruvian Population in the United States?
Total Peruvian Population in the United States is 712,740.