Cities with the Highest Child Poverty Level Among Boys Under the Age of 16 in Oregon
RELATED REPORTS & OPTIONS
Highest Poverty | Boys 0-16
Oregon
Compare Cities
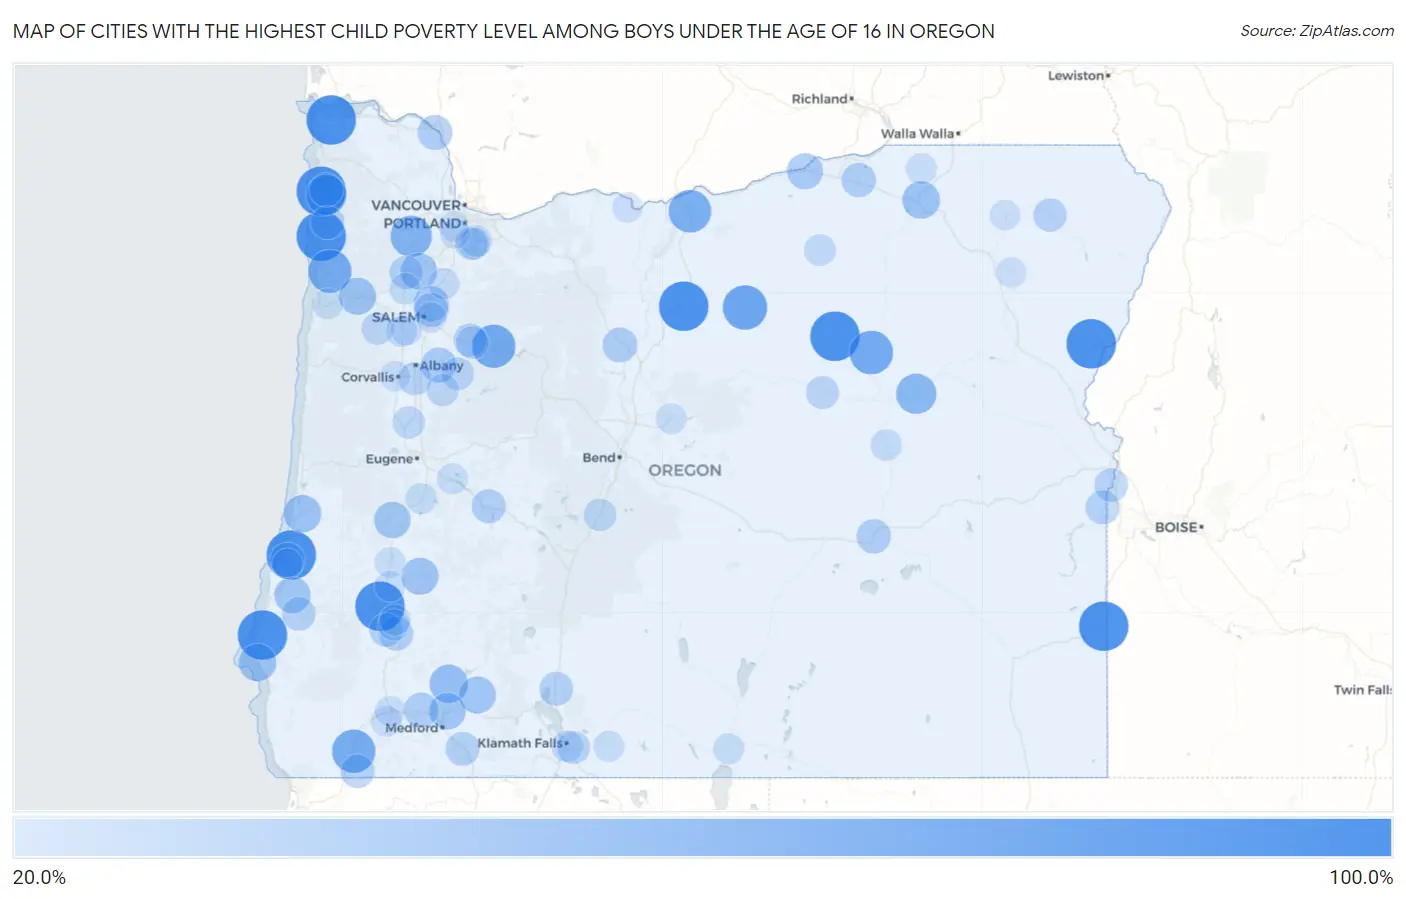
Map of Cities with the Highest Child Poverty Level Among Boys Under the Age of 16 in Oregon
0.0%
100.0%
Cities with the Highest Child Poverty Level Among Boys Under the Age of 16 in Oregon
| City | Child Poverty (Boys) | vs State | vs National | |
| 1. | Glasgow | 100.0% | 14.0%(+86.0)#1 | 16.9%(+83.1)#80 |
| 2. | Netarts | 100.0% | 14.0%(+86.0)#2 | 16.9%(+83.1)#126 |
| 3. | Manzanita | 100.0% | 14.0%(+86.0)#3 | 16.9%(+83.1)#149 |
| 4. | Dillard | 100.0% | 14.0%(+86.0)#4 | 16.9%(+83.1)#235 |
| 5. | Rocky Point | 100.0% | 14.0%(+86.0)#5 | 16.9%(+83.1)#241 |
| 6. | Langlois | 100.0% | 14.0%(+86.0)#6 | 16.9%(+83.1)#252 |
| 7. | Richland | 100.0% | 14.0%(+86.0)#7 | 16.9%(+83.1)#347 |
| 8. | Jordan Valley | 100.0% | 14.0%(+86.0)#8 | 16.9%(+83.1)#389 |
| 9. | Monument | 100.0% | 14.0%(+86.0)#9 | 16.9%(+83.1)#405 |
| 10. | Jeffers Gardens | 100.0% | 14.0%(+86.0)#10 | 16.9%(+83.1)#467 |
| 11. | Beaver Marsh | 100.0% | 14.0%(+86.0)#11 | 16.9%(+83.1)#468 |
| 12. | Shaniko | 100.0% | 14.0%(+86.0)#12 | 16.9%(+83.1)#652 |
| 13. | Fossil | 78.6% | 14.0%(+64.6)#13 | 16.9%(+61.7)#1,065 |
| 14. | Long Creek | 75.0% | 14.0%(+61.0)#14 | 16.9%(+58.1)#1,191 |
| 15. | Gates | 74.1% | 14.0%(+60.1)#15 | 16.9%(+57.2)#1,234 |
| 16. | Cave Junction | 73.8% | 14.0%(+59.8)#16 | 16.9%(+56.9)#1,243 |
| 17. | Hebo | 73.0% | 14.0%(+59.0)#17 | 16.9%(+56.1)#1,282 |
| 18. | Wasco | 70.8% | 14.0%(+56.8)#18 | 16.9%(+53.9)#1,382 |
| 19. | Dexter | 70.8% | 14.0%(+56.8)#19 | 16.9%(+53.9)#1,386 |
| 20. | Gaston | 65.7% | 14.0%(+51.7)#20 | 16.9%(+48.8)#1,655 |
| 21. | Heceta Beach | 63.2% | 14.0%(+49.2)#21 | 16.9%(+46.3)#1,790 |
| 22. | Wheeler | 61.3% | 14.0%(+47.3)#22 | 16.9%(+44.4)#1,914 |
| 23. | Prairie City | 60.9% | 14.0%(+46.9)#23 | 16.9%(+44.0)#1,940 |
| 24. | Mapleton | 60.0% | 14.0%(+46.0)#24 | 16.9%(+43.1)#1,989 |
| 25. | Shady Cove | 52.9% | 14.0%(+38.9)#25 | 16.9%(+36.0)#2,603 |
| 26. | Port Orford | 50.0% | 14.0%(+36.0)#26 | 16.9%(+33.1)#2,869 |
| 27. | Mission | 49.6% | 14.0%(+35.6)#27 | 16.9%(+32.7)#3,001 |
| 28. | Reedsport | 49.4% | 14.0%(+35.4)#28 | 16.9%(+32.5)#3,018 |
| 29. | Glide | 47.7% | 14.0%(+33.7)#29 | 16.9%(+30.8)#3,209 |
| 30. | Grand Ronde | 47.6% | 14.0%(+33.6)#30 | 16.9%(+30.7)#3,218 |
| 31. | Butte Falls | 47.4% | 14.0%(+33.4)#31 | 16.9%(+30.5)#3,248 |
| 32. | Dayton | 45.7% | 14.0%(+31.7)#32 | 16.9%(+28.8)#3,455 |
| 33. | Drain | 45.5% | 14.0%(+31.5)#33 | 16.9%(+28.6)#3,479 |
| 34. | White City | 45.5% | 14.0%(+31.5)#34 | 16.9%(+28.6)#3,483 |
| 35. | Coquille | 44.9% | 14.0%(+30.9)#35 | 16.9%(+28.0)#3,574 |
| 36. | Boardman | 43.4% | 14.0%(+29.4)#36 | 16.9%(+26.5)#3,792 |
| 37. | Labish Village | 41.7% | 14.0%(+27.7)#37 | 16.9%(+24.8)#4,045 |
| 38. | Crabtree | 39.8% | 14.0%(+25.8)#38 | 16.9%(+22.9)#4,370 |
| 39. | Warm Springs | 38.9% | 14.0%(+24.9)#39 | 16.9%(+22.0)#4,507 |
| 40. | Rainier | 38.8% | 14.0%(+24.8)#40 | 16.9%(+21.9)#4,538 |
| 41. | Gold Hill | 38.3% | 14.0%(+24.3)#41 | 16.9%(+21.4)#4,620 |
| 42. | North Bend | 37.7% | 14.0%(+23.7)#42 | 16.9%(+20.8)#4,721 |
| 43. | Hines | 37.3% | 14.0%(+23.3)#43 | 16.9%(+20.4)#4,806 |
| 44. | Stanfield | 37.0% | 14.0%(+23.0)#44 | 16.9%(+20.1)#4,866 |
| 45. | Hayesville | 37.0% | 14.0%(+23.0)#45 | 16.9%(+20.1)#4,868 |
| 46. | Oakridge | 36.0% | 14.0%(+22.0)#46 | 16.9%(+19.1)#5,069 |
| 47. | Canyonville | 35.7% | 14.0%(+21.7)#47 | 16.9%(+18.8)#5,138 |
| 48. | Ashland | 35.4% | 14.0%(+21.4)#48 | 16.9%(+18.5)#5,214 |
| 49. | Keno | 35.2% | 14.0%(+21.2)#49 | 16.9%(+18.3)#5,241 |
| 50. | Adrian | 35.0% | 14.0%(+21.0)#50 | 16.9%(+18.1)#5,292 |
| 51. | Riddle | 34.3% | 14.0%(+20.3)#51 | 16.9%(+17.4)#5,441 |
| 52. | Chiloquin | 34.3% | 14.0%(+20.3)#52 | 16.9%(+17.4)#5,442 |
| 53. | Takilma | 34.1% | 14.0%(+20.1)#53 | 16.9%(+17.2)#5,481 |
| 54. | Myrtle Point | 34.0% | 14.0%(+20.0)#54 | 16.9%(+17.1)#5,500 |
| 55. | Nyssa | 33.6% | 14.0%(+19.6)#55 | 16.9%(+16.7)#5,574 |
| 56. | Bay City | 33.5% | 14.0%(+19.5)#56 | 16.9%(+16.6)#5,598 |
| 57. | Nehalem | 33.3% | 14.0%(+19.3)#57 | 16.9%(+16.4)#5,695 |
| 58. | Wallowa | 32.9% | 14.0%(+18.9)#58 | 16.9%(+16.0)#5,822 |
| 59. | Mcminnville | 32.8% | 14.0%(+18.8)#59 | 16.9%(+15.9)#5,854 |
| 60. | Mehama | 32.5% | 14.0%(+18.5)#60 | 16.9%(+15.6)#5,920 |
| 61. | Tangent | 32.1% | 14.0%(+18.1)#61 | 16.9%(+15.2)#6,023 |
| 62. | Altamont | 31.3% | 14.0%(+17.3)#62 | 16.9%(+14.4)#6,207 |
| 63. | Dayville | 30.8% | 14.0%(+16.8)#63 | 16.9%(+13.9)#6,366 |
| 64. | Lyons | 30.7% | 14.0%(+16.7)#64 | 16.9%(+13.8)#6,393 |
| 65. | Lacomb | 30.2% | 14.0%(+16.2)#65 | 16.9%(+13.3)#6,520 |
| 66. | Jennings Lodge | 29.2% | 14.0%(+15.2)#66 | 16.9%(+12.3)#6,772 |
| 67. | Harrisburg | 29.0% | 14.0%(+15.0)#67 | 16.9%(+12.1)#6,815 |
| 68. | La Pine | 28.9% | 14.0%(+14.9)#68 | 16.9%(+12.0)#6,847 |
| 69. | Sodaville | 28.6% | 14.0%(+14.6)#69 | 16.9%(+11.7)#6,931 |
| 70. | Falls City | 27.7% | 14.0%(+13.7)#70 | 16.9%(+10.8)#7,203 |
| 71. | Klamath Falls | 26.3% | 14.0%(+12.3)#71 | 16.9%(+9.39)#7,660 |
| 72. | Heppner | 26.2% | 14.0%(+12.2)#72 | 16.9%(+9.34)#7,673 |
| 73. | Gladstone | 26.2% | 14.0%(+12.2)#73 | 16.9%(+9.30)#7,682 |
| 74. | Tri City | 25.9% | 14.0%(+11.9)#74 | 16.9%(+9.00)#7,781 |
| 75. | Amity | 25.2% | 14.0%(+11.2)#75 | 16.9%(+8.27)#7,989 |
| 76. | Woodburn | 25.0% | 14.0%(+11.0)#76 | 16.9%(+8.12)#8,021 |
| 77. | Johnson City | 25.0% | 14.0%(+11.0)#77 | 16.9%(+8.10)#8,073 |
| 78. | Seneca | 25.0% | 14.0%(+11.0)#78 | 16.9%(+8.10)#8,112 |
| 79. | Monmouth | 24.3% | 14.0%(+10.3)#79 | 16.9%(+7.35)#8,352 |
| 80. | Myrtle Creek | 23.9% | 14.0%(+9.90)#80 | 16.9%(+6.99)#8,462 |
| 81. | Independence | 23.7% | 14.0%(+9.70)#81 | 16.9%(+6.79)#8,529 |
| 82. | Lakeview | 23.5% | 14.0%(+9.51)#82 | 16.9%(+6.60)#8,615 |
| 83. | Cottage Grove | 23.5% | 14.0%(+9.47)#83 | 16.9%(+6.56)#8,623 |
| 84. | Bonanza | 23.4% | 14.0%(+9.44)#84 | 16.9%(+6.53)#8,632 |
| 85. | Lowell | 23.4% | 14.0%(+9.41)#85 | 16.9%(+6.50)#8,639 |
| 86. | Helix | 23.1% | 14.0%(+9.08)#86 | 16.9%(+6.17)#8,746 |
| 87. | Prineville | 23.1% | 14.0%(+9.06)#87 | 16.9%(+6.16)#8,765 |
| 88. | Sutherlin | 22.9% | 14.0%(+8.93)#88 | 16.9%(+6.03)#8,799 |
| 89. | Roseburg | 22.9% | 14.0%(+8.88)#89 | 16.9%(+5.97)#8,815 |
| 90. | Rose Lodge | 22.5% | 14.0%(+8.52)#90 | 16.9%(+5.61)#8,925 |
| 91. | New Hope | 22.5% | 14.0%(+8.47)#91 | 16.9%(+5.57)#8,939 |
| 92. | Corvallis | 22.0% | 14.0%(+8.03)#92 | 16.9%(+5.12)#9,115 |
| 93. | Union | 21.8% | 14.0%(+7.78)#93 | 16.9%(+4.87)#9,190 |
| 94. | Elgin | 21.7% | 14.0%(+7.70)#94 | 16.9%(+4.80)#9,226 |
| 95. | Four Corners | 21.5% | 14.0%(+7.47)#95 | 16.9%(+4.56)#9,287 |
| 96. | Coos Bay | 21.1% | 14.0%(+7.11)#96 | 16.9%(+4.21)#9,421 |
| 97. | West Slope | 21.1% | 14.0%(+7.05)#97 | 16.9%(+4.15)#9,436 |
| 98. | Grants Pass | 20.9% | 14.0%(+6.94)#98 | 16.9%(+4.03)#9,475 |
| 99. | Chenoweth | 20.9% | 14.0%(+6.86)#99 | 16.9%(+3.96)#9,503 |
| 100. | Metzger | 20.1% | 14.0%(+6.12)#100 | 16.9%(+3.21)#9,777 |
Common Questions
What are the Top 10 Cities with the Highest Child Poverty Level Among Boys Under the Age of 16 in Oregon?
Top 10 Cities with the Highest Child Poverty Level Among Boys Under the Age of 16 in Oregon are:
#1
100.0%
#2
100.0%
#3
100.0%
#4
100.0%
#5
100.0%
#6
100.0%
#7
100.0%
#8
100.0%
#9
100.0%
#10
100.0%
What city has the Highest Child Poverty Level Among Boys Under the Age of 16 in Oregon?
Glasgow has the Highest Child Poverty Level Among Boys Under the Age of 16 in Oregon with 100.0%.
What is the Poverty Level Among Boys Under the Age of 16 in the State of Oregon?
Poverty Level Among Boys Under the Age of 16 in Oregon is 14.0%.
What is the Poverty Level Among Boys Under the Age of 16 in the United States?
Poverty Level Among Boys Under the Age of 16 in the United States is 16.9%.