Cities with the Highest Child Poverty Level Among Boys Under the Age of 16 in Illinois
RELATED REPORTS & OPTIONS
Highest Poverty | Boys 0-16
Illinois
Compare Cities
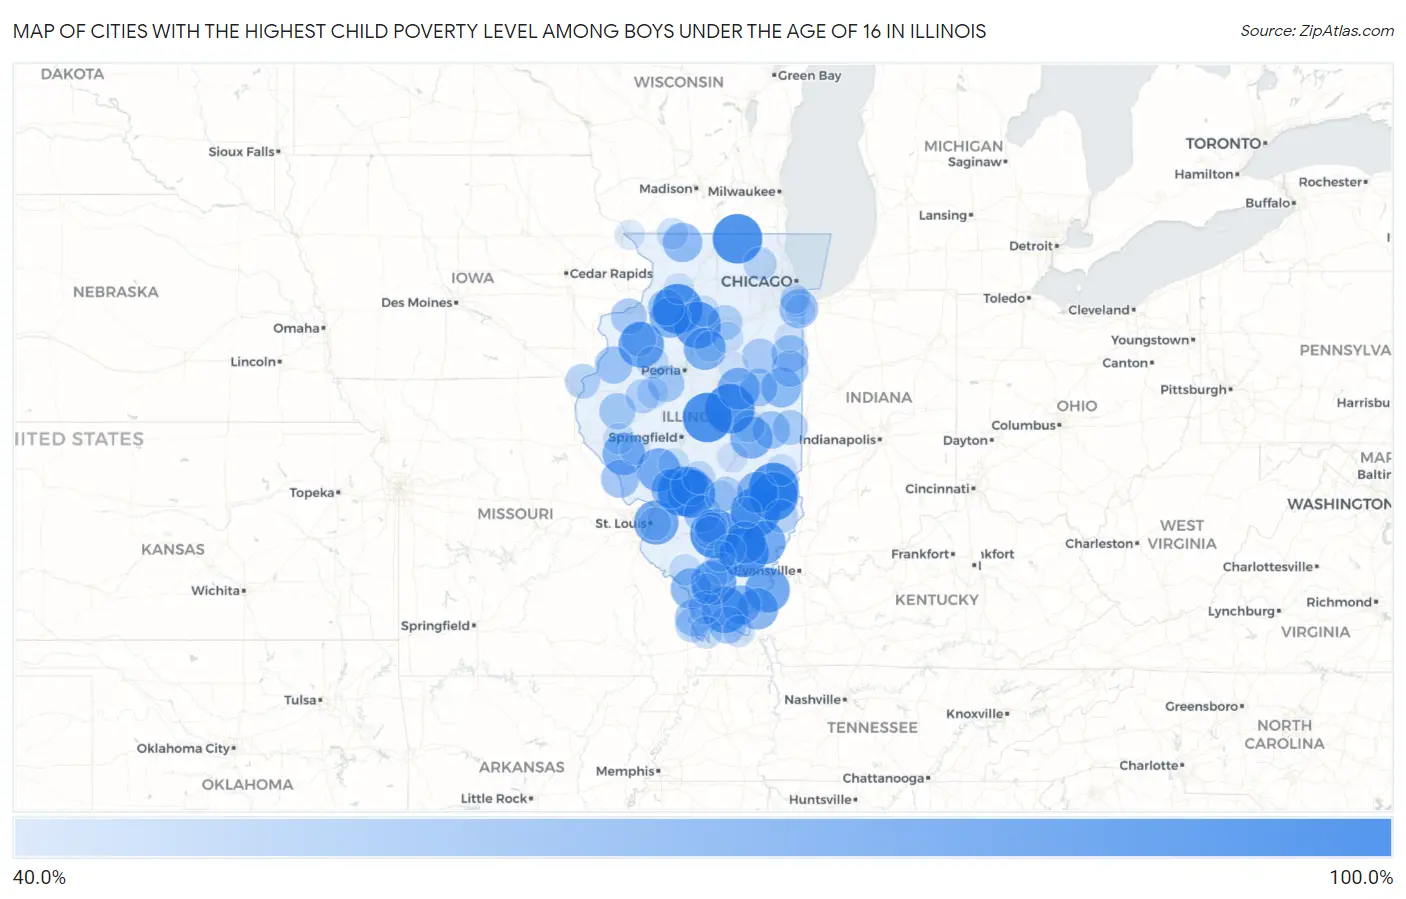
Map of Cities with the Highest Child Poverty Level Among Boys Under the Age of 16 in Illinois
0.0%
100.0%
Cities with the Highest Child Poverty Level Among Boys Under the Age of 16 in Illinois
| City | Child Poverty (Boys) | vs State | vs National | |
| 1. | Chemung | 100.0% | 15.8%(+84.2)#1 | 16.9%(+83.1)#204 |
| 2. | Ophiem | 100.0% | 15.8%(+84.2)#2 | 16.9%(+83.1)#362 |
| 3. | De Witt | 100.0% | 15.8%(+84.2)#3 | 16.9%(+83.1)#367 |
| 4. | Chestnut | 100.0% | 15.8%(+84.2)#4 | 16.9%(+83.1)#380 |
| 5. | Walshville | 100.0% | 15.8%(+84.2)#5 | 16.9%(+83.1)#408 |
| 6. | Dewey | 100.0% | 15.8%(+84.2)#6 | 16.9%(+83.1)#449 |
| 7. | Walnut Hill | 100.0% | 15.8%(+84.2)#7 | 16.9%(+83.1)#463 |
| 8. | Harding | 100.0% | 15.8%(+84.2)#8 | 16.9%(+83.1)#479 |
| 9. | Sailor Springs | 100.0% | 15.8%(+84.2)#9 | 16.9%(+83.1)#495 |
| 10. | Yale | 100.0% | 15.8%(+84.2)#10 | 16.9%(+83.1)#532 |
| 11. | Fowler | 100.0% | 15.8%(+84.2)#11 | 16.9%(+83.1)#536 |
| 12. | Belle Prairie City | 100.0% | 15.8%(+84.2)#12 | 16.9%(+83.1)#590 |
| 13. | New Bedford | 100.0% | 15.8%(+84.2)#13 | 16.9%(+83.1)#610 |
| 14. | Willow Hill | 97.1% | 15.8%(+81.3)#14 | 16.9%(+80.2)#664 |
| 15. | Donnellson | 95.5% | 15.8%(+79.6)#15 | 16.9%(+78.6)#672 |
| 16. | Bureau Junction | 92.3% | 15.8%(+76.5)#16 | 16.9%(+75.4)#697 |
| 17. | Vienna | 90.5% | 15.8%(+74.7)#17 | 16.9%(+73.6)#726 |
| 18. | Henderson | 88.9% | 15.8%(+73.1)#18 | 16.9%(+72.0)#753 |
| 19. | Colp | 87.9% | 15.8%(+72.1)#19 | 16.9%(+71.0)#771 |
| 20. | Old Shawneetown | 86.7% | 15.8%(+70.8)#20 | 16.9%(+69.8)#797 |
| 21. | Washington Park | 86.0% | 15.8%(+70.2)#21 | 16.9%(+69.1)#816 |
| 22. | Hettick | 83.3% | 15.8%(+67.5)#22 | 16.9%(+66.4)#901 |
| 23. | Golden Gate | 83.3% | 15.8%(+67.5)#23 | 16.9%(+66.4)#903 |
| 24. | Milton | 80.0% | 15.8%(+64.2)#24 | 16.9%(+63.1)#1,000 |
| 25. | Sims | 80.0% | 15.8%(+64.2)#25 | 16.9%(+63.1)#1,004 |
| 26. | La Rose | 80.0% | 15.8%(+64.2)#26 | 16.9%(+63.1)#1,015 |
| 27. | Garrett | 80.0% | 15.8%(+64.2)#27 | 16.9%(+63.1)#1,018 |
| 28. | Arrowsmith | 79.2% | 15.8%(+63.3)#28 | 16.9%(+62.3)#1,040 |
| 29. | Elizabethtown | 77.8% | 15.8%(+62.0)#29 | 16.9%(+60.9)#1,088 |
| 30. | Wheeler | 77.3% | 15.8%(+61.5)#30 | 16.9%(+60.4)#1,112 |
| 31. | Gorham | 76.5% | 15.8%(+60.7)#31 | 16.9%(+59.6)#1,132 |
| 32. | Mineral | 75.0% | 15.8%(+59.2)#32 | 16.9%(+58.1)#1,194 |
| 33. | Rankin | 73.4% | 15.8%(+57.6)#33 | 16.9%(+56.5)#1,259 |
| 34. | Mount Clare | 73.3% | 15.8%(+57.5)#34 | 16.9%(+56.4)#1,265 |
| 35. | Cedarville | 71.7% | 15.8%(+55.9)#35 | 16.9%(+54.8)#1,334 |
| 36. | Eddyville | 71.4% | 15.8%(+55.6)#36 | 16.9%(+54.5)#1,359 |
| 37. | Taylor Springs | 70.4% | 15.8%(+54.6)#37 | 16.9%(+53.5)#1,402 |
| 38. | Ford Heights | 69.7% | 15.8%(+53.9)#38 | 16.9%(+52.8)#1,437 |
| 39. | Serena | 69.4% | 15.8%(+53.6)#39 | 16.9%(+52.5)#1,449 |
| 40. | Hamburg | 68.0% | 15.8%(+52.2)#40 | 16.9%(+51.1)#1,512 |
| 41. | Elliott | 66.7% | 15.8%(+50.8)#41 | 16.9%(+49.8)#1,578 |
| 42. | Mcclure | 66.7% | 15.8%(+50.8)#42 | 16.9%(+49.8)#1,582 |
| 43. | Media | 66.7% | 15.8%(+50.8)#43 | 16.9%(+49.8)#1,599 |
| 44. | Longview | 66.7% | 15.8%(+50.8)#44 | 16.9%(+49.8)#1,607 |
| 45. | Joppa | 65.6% | 15.8%(+49.8)#45 | 16.9%(+48.7)#1,658 |
| 46. | Martinton | 65.2% | 15.8%(+49.4)#46 | 16.9%(+48.3)#1,678 |
| 47. | Keyesport | 65.0% | 15.8%(+49.2)#47 | 16.9%(+48.1)#1,688 |
| 48. | Woodland | 64.3% | 15.8%(+48.5)#48 | 16.9%(+47.4)#1,731 |
| 49. | Hooppole | 64.0% | 15.8%(+48.2)#49 | 16.9%(+47.1)#1,745 |
| 50. | Banner | 63.6% | 15.8%(+47.8)#50 | 16.9%(+46.7)#1,765 |
| 51. | Camden | 63.6% | 15.8%(+47.8)#51 | 16.9%(+46.7)#1,768 |
| 52. | Oak Grove | 61.9% | 15.8%(+46.1)#52 | 16.9%(+45.0)#1,872 |
| 53. | Cullom | 61.0% | 15.8%(+45.2)#53 | 16.9%(+44.1)#1,935 |
| 54. | Indianola | 60.0% | 15.8%(+44.2)#54 | 16.9%(+43.1)#2,000 |
| 55. | Rio | 60.0% | 15.8%(+44.2)#55 | 16.9%(+43.1)#2,001 |
| 56. | Nauvoo | 59.4% | 15.8%(+43.6)#56 | 16.9%(+42.5)#2,049 |
| 57. | Naplate | 59.0% | 15.8%(+43.2)#57 | 16.9%(+42.1)#2,076 |
| 58. | Thebes | 58.8% | 15.8%(+43.0)#58 | 16.9%(+41.9)#2,088 |
| 59. | Cahokia Heights | 58.8% | 15.8%(+42.9)#59 | 16.9%(+41.9)#2,094 |
| 60. | St Elmo | 57.4% | 15.8%(+41.5)#60 | 16.9%(+40.5)#2,200 |
| 61. | Ipava | 57.4% | 15.8%(+41.5)#61 | 16.9%(+40.4)#2,202 |
| 62. | Anna | 56.0% | 15.8%(+40.2)#62 | 16.9%(+39.1)#2,320 |
| 63. | Sumner | 56.0% | 15.8%(+40.1)#63 | 16.9%(+39.1)#2,324 |
| 64. | East Dundee | 55.7% | 15.8%(+39.9)#64 | 16.9%(+38.8)#2,338 |
| 65. | Junction City | 54.8% | 15.8%(+39.0)#65 | 16.9%(+37.9)#2,414 |
| 66. | East St Louis | 54.7% | 15.8%(+38.8)#66 | 16.9%(+37.8)#2,425 |
| 67. | Witt | 54.2% | 15.8%(+38.4)#67 | 16.9%(+37.3)#2,481 |
| 68. | Central City | 54.2% | 15.8%(+38.4)#68 | 16.9%(+37.3)#2,482 |
| 69. | Wamac | 53.9% | 15.8%(+38.1)#69 | 16.9%(+37.0)#2,498 |
| 70. | Mounds | 53.2% | 15.8%(+37.4)#70 | 16.9%(+36.3)#2,564 |
| 71. | West City | 53.0% | 15.8%(+37.2)#71 | 16.9%(+36.1)#2,579 |
| 72. | Royalton | 52.9% | 15.8%(+37.1)#72 | 16.9%(+36.0)#2,583 |
| 73. | Maquon | 52.9% | 15.8%(+37.1)#73 | 16.9%(+36.0)#2,590 |
| 74. | Ivesdale | 52.4% | 15.8%(+36.6)#74 | 16.9%(+35.5)#2,653 |
| 75. | Brookport | 51.4% | 15.8%(+35.5)#75 | 16.9%(+34.4)#2,756 |
| 76. | Lewistown | 51.2% | 15.8%(+35.3)#76 | 16.9%(+34.3)#2,772 |
| 77. | Brownstown | 51.2% | 15.8%(+35.3)#77 | 16.9%(+34.3)#2,775 |
| 78. | Winslow | 51.1% | 15.8%(+35.3)#78 | 16.9%(+34.2)#2,780 |
| 79. | Willisville | 50.9% | 15.8%(+35.1)#79 | 16.9%(+34.0)#2,795 |
| 80. | Ridgewood | 50.9% | 15.8%(+35.1)#80 | 16.9%(+34.0)#2,800 |
| 81. | Martinsville | 50.8% | 15.8%(+34.9)#81 | 16.9%(+33.9)#2,805 |
| 82. | Streator | 50.6% | 15.8%(+34.8)#82 | 16.9%(+33.7)#2,820 |
| 83. | Phoenix | 50.0% | 15.8%(+34.2)#83 | 16.9%(+33.1)#2,861 |
| 84. | Perry | 50.0% | 15.8%(+34.2)#84 | 16.9%(+33.1)#2,914 |
| 85. | Opdyke | 50.0% | 15.8%(+34.2)#85 | 16.9%(+33.1)#2,923 |
| 86. | Nason | 50.0% | 15.8%(+34.2)#86 | 16.9%(+33.1)#2,925 |
| 87. | Arlington | 50.0% | 15.8%(+34.2)#87 | 16.9%(+33.1)#2,932 |
| 88. | Girard | 49.2% | 15.8%(+33.4)#88 | 16.9%(+32.3)#3,034 |
| 89. | Louisville | 49.0% | 15.8%(+33.2)#89 | 16.9%(+32.1)#3,056 |
| 90. | Campbell's Island | 48.9% | 15.8%(+33.1)#90 | 16.9%(+32.0)#3,065 |
| 91. | Rock Falls | 48.8% | 15.8%(+32.9)#91 | 16.9%(+31.9)#3,083 |
| 92. | Toluca | 48.7% | 15.8%(+32.9)#92 | 16.9%(+31.8)#3,085 |
| 93. | Sauk Village | 47.9% | 15.8%(+32.0)#93 | 16.9%(+30.9)#3,197 |
| 94. | Carbondale | 47.6% | 15.8%(+31.7)#94 | 16.9%(+30.6)#3,229 |
| 95. | Findlay | 47.5% | 15.8%(+31.6)#95 | 16.9%(+30.6)#3,235 |
| 96. | Winchester | 47.4% | 15.8%(+31.6)#96 | 16.9%(+30.5)#3,241 |
| 97. | Chenoa | 47.1% | 15.8%(+31.3)#97 | 16.9%(+30.2)#3,278 |
| 98. | Riverdale | 47.0% | 15.8%(+31.2)#98 | 16.9%(+30.1)#3,300 |
| 99. | Sun River Terrace | 47.0% | 15.8%(+31.2)#99 | 16.9%(+30.1)#3,307 |
| 100. | Menominee | 46.9% | 15.8%(+31.1)#100 | 16.9%(+30.0)#3,326 |
Common Questions
What are the Top 10 Cities with the Highest Child Poverty Level Among Boys Under the Age of 16 in Illinois?
Top 10 Cities with the Highest Child Poverty Level Among Boys Under the Age of 16 in Illinois are:
#1
100.0%
#2
100.0%
#3
100.0%
#4
100.0%
#5
100.0%
#6
100.0%
#7
100.0%
#8
100.0%
#9
100.0%
#10
97.1%
What city has the Highest Child Poverty Level Among Boys Under the Age of 16 in Illinois?
Chemung has the Highest Child Poverty Level Among Boys Under the Age of 16 in Illinois with 100.0%.
What is the Poverty Level Among Boys Under the Age of 16 in the State of Illinois?
Poverty Level Among Boys Under the Age of 16 in Illinois is 15.8%.
What is the Poverty Level Among Boys Under the Age of 16 in the United States?
Poverty Level Among Boys Under the Age of 16 in the United States is 16.9%.