Cities with the Highest Child Poverty Level Among Boys Under the Age of 16 in Ohio
RELATED REPORTS & OPTIONS
Highest Poverty | Boys 0-16
Ohio
Compare Cities
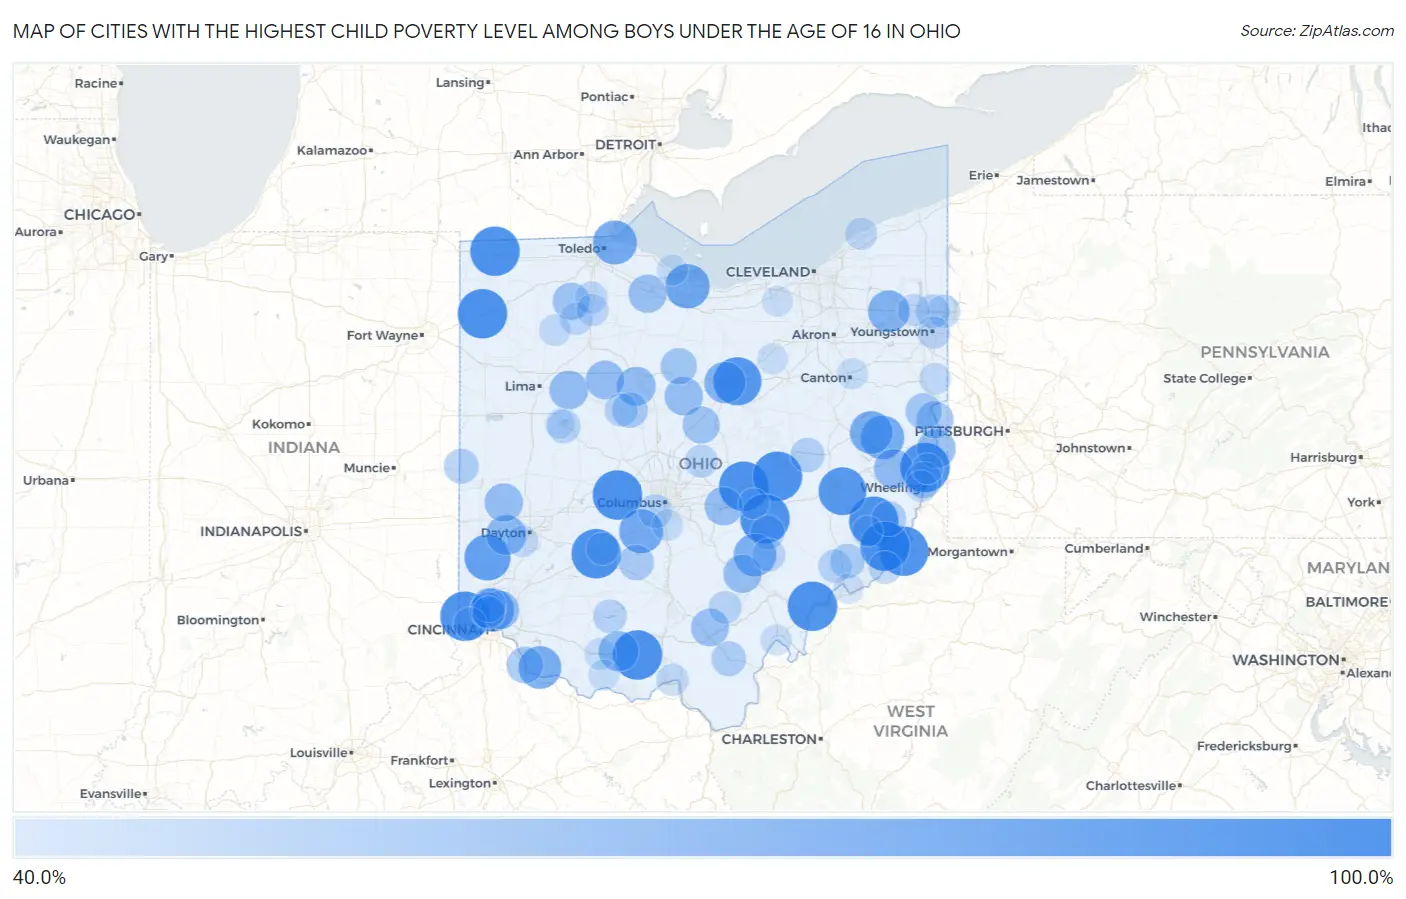
Map of Cities with the Highest Child Poverty Level Among Boys Under the Age of 16 in Ohio
0.0%
100.0%
Cities with the Highest Child Poverty Level Among Boys Under the Age of 16 in Ohio
| City | Child Poverty (Boys) | vs State | vs National | |
| 1. | Little Hocking | 100.0% | 18.8%(+81.2)#1 | 16.9%(+83.1)#125 |
| 2. | Hooven | 100.0% | 18.8%(+81.2)#2 | 16.9%(+83.1)#135 |
| 3. | Madison Place | 100.0% | 18.8%(+81.2)#3 | 16.9%(+83.1)#152 |
| 4. | Sardis | 100.0% | 18.8%(+81.2)#4 | 16.9%(+83.1)#203 |
| 5. | Marne | 100.0% | 18.8%(+81.2)#5 | 16.9%(+83.1)#219 |
| 6. | Plumwood | 100.0% | 18.8%(+81.2)#6 | 16.9%(+83.1)#271 |
| 7. | Kunkle | 100.0% | 18.8%(+81.2)#7 | 16.9%(+83.1)#324 |
| 8. | Trinway | 100.0% | 18.8%(+81.2)#8 | 16.9%(+83.1)#325 |
| 9. | Rarden | 100.0% | 18.8%(+81.2)#9 | 16.9%(+83.1)#406 |
| 10. | East Fultonham | 100.0% | 18.8%(+81.2)#10 | 16.9%(+83.1)#421 |
| 11. | Cecil | 100.0% | 18.8%(+81.2)#11 | 16.9%(+83.1)#437 |
| 12. | Connorville | 100.0% | 18.8%(+81.2)#12 | 16.9%(+83.1)#486 |
| 13. | Miltonsburg | 100.0% | 18.8%(+81.2)#13 | 16.9%(+83.1)#577 |
| 14. | Octa | 100.0% | 18.8%(+81.2)#14 | 16.9%(+83.1)#601 |
| 15. | Antioch | 100.0% | 18.8%(+81.2)#15 | 16.9%(+83.1)#609 |
| 16. | Mifflin | 95.8% | 18.8%(+77.0)#16 | 16.9%(+78.9)#671 |
| 17. | Old Washington | 95.3% | 18.8%(+76.5)#17 | 16.9%(+78.4)#673 |
| 18. | West Elkton | 90.7% | 18.8%(+71.9)#18 | 16.9%(+73.8)#722 |
| 19. | Castalia | 85.9% | 18.8%(+67.1)#19 | 16.9%(+69.0)#819 |
| 20. | Derby | 84.6% | 18.8%(+65.8)#20 | 16.9%(+67.7)#850 |
| 21. | Harbor View | 84.6% | 18.8%(+65.8)#21 | 16.9%(+67.7)#853 |
| 22. | Scio | 83.6% | 18.8%(+64.8)#22 | 16.9%(+66.7)#881 |
| 23. | Pleasant Hills | 82.7% | 18.8%(+63.9)#23 | 16.9%(+65.8)#918 |
| 24. | Bowerston | 81.8% | 18.8%(+63.0)#24 | 16.9%(+64.9)#941 |
| 25. | Felicity | 81.6% | 18.8%(+62.8)#25 | 16.9%(+64.7)#956 |
| 26. | Shawnee | 81.1% | 18.8%(+62.3)#26 | 16.9%(+64.2)#973 |
| 27. | Windham | 78.7% | 18.8%(+59.9)#27 | 16.9%(+61.8)#1,060 |
| 28. | Lincoln Heights | 77.9% | 18.8%(+59.1)#28 | 16.9%(+61.0)#1,084 |
| 29. | New Lebanon | 74.6% | 18.8%(+55.8)#29 | 16.9%(+57.7)#1,215 |
| 30. | Peebles | 74.4% | 18.8%(+55.6)#30 | 16.9%(+57.5)#1,219 |
| 31. | New Athens | 72.7% | 18.8%(+53.9)#31 | 16.9%(+55.8)#1,294 |
| 32. | Harpster | 71.4% | 18.8%(+52.6)#32 | 16.9%(+54.5)#1,345 |
| 33. | Mingo Junction | 71.2% | 18.8%(+52.4)#33 | 16.9%(+54.3)#1,366 |
| 34. | Alger | 71.0% | 18.8%(+52.1)#34 | 16.9%(+54.1)#1,372 |
| 35. | Patterson | 70.4% | 18.8%(+51.6)#35 | 16.9%(+53.5)#1,404 |
| 36. | Iberia | 70.0% | 18.8%(+51.2)#36 | 16.9%(+53.1)#1,419 |
| 37. | Potsdam | 70.0% | 18.8%(+51.2)#37 | 16.9%(+53.1)#1,420 |
| 38. | Lockland | 69.8% | 18.8%(+51.0)#38 | 16.9%(+52.9)#1,432 |
| 39. | Buckeye Lake | 69.8% | 18.8%(+51.0)#39 | 16.9%(+52.9)#1,433 |
| 40. | Haydenville | 69.4% | 18.8%(+50.6)#40 | 16.9%(+52.5)#1,447 |
| 41. | Stony Prairie | 69.3% | 18.8%(+50.5)#41 | 16.9%(+52.4)#1,451 |
| 42. | Coalton | 68.4% | 18.8%(+49.6)#42 | 16.9%(+51.5)#1,492 |
| 43. | Empire | 66.7% | 18.8%(+47.8)#43 | 16.9%(+49.8)#1,584 |
| 44. | Chesterville | 66.7% | 18.8%(+47.8)#44 | 16.9%(+49.8)#1,588 |
| 45. | Milton Center | 66.7% | 18.8%(+47.8)#45 | 16.9%(+49.8)#1,589 |
| 46. | Moscow | 64.7% | 18.8%(+45.9)#46 | 16.9%(+47.8)#1,700 |
| 47. | Sulphur Springs | 64.5% | 18.8%(+45.7)#47 | 16.9%(+47.6)#1,708 |
| 48. | Martins Ferry | 64.5% | 18.8%(+45.6)#48 | 16.9%(+47.6)#1,711 |
| 49. | Irondale | 64.3% | 18.8%(+45.5)#49 | 16.9%(+47.4)#1,732 |
| 50. | New Bloomington | 62.5% | 18.8%(+43.7)#50 | 16.9%(+45.6)#1,833 |
| 51. | Skyline Acres | 62.4% | 18.8%(+43.6)#51 | 16.9%(+45.5)#1,849 |
| 52. | New Holland | 62.1% | 18.8%(+43.2)#52 | 16.9%(+45.2)#1,865 |
| 53. | Union City | 60.4% | 18.8%(+41.6)#53 | 16.9%(+43.5)#1,973 |
| 54. | Beallsville | 60.0% | 18.8%(+41.2)#54 | 16.9%(+43.1)#1,992 |
| 55. | Lower Salem | 60.0% | 18.8%(+41.2)#55 | 16.9%(+43.1)#2,007 |
| 56. | Centerville Thurman | 60.0% | 18.8%(+41.2)#56 | 16.9%(+43.1)#2,018 |
| 57. | Bidwell | 59.9% | 18.8%(+41.1)#57 | 16.9%(+43.0)#2,023 |
| 58. | New Burlington | 59.0% | 18.8%(+40.1)#58 | 16.9%(+42.1)#2,077 |
| 59. | West Lafayette | 58.9% | 18.8%(+40.1)#59 | 16.9%(+42.0)#2,078 |
| 60. | Crooksville | 58.6% | 18.8%(+39.8)#60 | 16.9%(+41.7)#2,106 |
| 61. | Urbancrest | 58.0% | 18.8%(+39.2)#61 | 16.9%(+41.1)#2,158 |
| 62. | Russells Point | 57.5% | 18.8%(+38.7)#62 | 16.9%(+40.6)#2,191 |
| 63. | Rocky Fork Point | 57.1% | 18.8%(+38.3)#63 | 16.9%(+40.2)#2,220 |
| 64. | Vienna Center | 57.1% | 18.8%(+38.3)#64 | 16.9%(+40.2)#2,221 |
| 65. | Lowell | 56.9% | 18.8%(+38.0)#65 | 16.9%(+40.0)#2,253 |
| 66. | La Rue | 56.4% | 18.8%(+37.5)#66 | 16.9%(+39.5)#2,296 |
| 67. | Hartford Croton | 56.1% | 18.8%(+37.3)#67 | 16.9%(+39.2)#2,314 |
| 68. | Corning | 55.8% | 18.8%(+37.0)#68 | 16.9%(+38.9)#2,332 |
| 69. | Mcarthur | 55.6% | 18.8%(+36.7)#69 | 16.9%(+38.7)#2,347 |
| 70. | Brookfield Center | 55.6% | 18.8%(+36.7)#70 | 16.9%(+38.7)#2,348 |
| 71. | Addyston | 55.3% | 18.8%(+36.5)#71 | 16.9%(+38.4)#2,374 |
| 72. | Matamoras | 55.3% | 18.8%(+36.5)#72 | 16.9%(+38.4)#2,375 |
| 73. | Youngstown | 55.0% | 18.8%(+36.2)#73 | 16.9%(+38.1)#2,391 |
| 74. | Hoytville | 54.5% | 18.8%(+35.7)#74 | 16.9%(+37.6)#2,443 |
| 75. | North College Hill | 54.5% | 18.8%(+35.7)#75 | 16.9%(+37.6)#2,452 |
| 76. | Jeffersonville | 54.3% | 18.8%(+35.4)#76 | 16.9%(+37.4)#2,476 |
| 77. | Warren | 53.4% | 18.8%(+34.6)#77 | 16.9%(+36.5)#2,545 |
| 78. | Portage | 53.3% | 18.8%(+34.5)#78 | 16.9%(+36.4)#2,554 |
| 79. | Portsmouth | 53.3% | 18.8%(+34.4)#79 | 16.9%(+36.3)#2,563 |
| 80. | Fairport Harbor | 53.2% | 18.8%(+34.4)#80 | 16.9%(+36.3)#2,565 |
| 81. | Cygnet | 53.2% | 18.8%(+34.4)#81 | 16.9%(+36.3)#2,569 |
| 82. | Bridgeport | 52.7% | 18.8%(+33.9)#82 | 16.9%(+35.8)#2,619 |
| 83. | Moraine | 52.4% | 18.8%(+33.6)#83 | 16.9%(+35.5)#2,646 |
| 84. | Rogers | 52.2% | 18.8%(+33.4)#84 | 16.9%(+35.3)#2,675 |
| 85. | Leipsic | 52.1% | 18.8%(+33.3)#85 | 16.9%(+35.2)#2,678 |
| 86. | Seaman | 51.8% | 18.8%(+33.0)#86 | 16.9%(+34.9)#2,711 |
| 87. | Lockbourne | 51.1% | 18.8%(+32.3)#87 | 16.9%(+34.2)#2,781 |
| 88. | Pomeroy | 50.6% | 18.8%(+31.8)#88 | 16.9%(+33.7)#2,810 |
| 89. | Port Clinton | 50.6% | 18.8%(+31.8)#89 | 16.9%(+33.7)#2,812 |
| 90. | West Union | 50.6% | 18.8%(+31.8)#90 | 16.9%(+33.7)#2,819 |
| 91. | Canton | 50.6% | 18.8%(+31.8)#91 | 16.9%(+33.7)#2,823 |
| 92. | Eaton Estates | 50.0% | 18.8%(+31.2)#92 | 16.9%(+33.1)#2,863 |
| 93. | Rayland | 50.0% | 18.8%(+31.2)#93 | 16.9%(+33.1)#2,891 |
| 94. | Gratiot | 50.0% | 18.8%(+31.2)#94 | 16.9%(+33.1)#2,928 |
| 95. | Lewisville | 50.0% | 18.8%(+31.2)#95 | 16.9%(+33.1)#2,938 |
| 96. | Congress | 50.0% | 18.8%(+31.2)#96 | 16.9%(+33.1)#2,957 |
| 97. | Reno | 49.1% | 18.8%(+30.3)#97 | 16.9%(+32.2)#3,045 |
| 98. | Fort Mckinley | 48.5% | 18.8%(+29.7)#98 | 16.9%(+31.6)#3,111 |
| 99. | Oakwood Village Cuyahoga County | 48.5% | 18.8%(+29.6)#99 | 16.9%(+31.6)#3,116 |
| 100. | Lakeview | 48.1% | 18.8%(+29.3)#100 | 16.9%(+31.2)#3,164 |
Common Questions
What are the Top 10 Cities with the Highest Child Poverty Level Among Boys Under the Age of 16 in Ohio?
Top 10 Cities with the Highest Child Poverty Level Among Boys Under the Age of 16 in Ohio are:
#1
100.0%
#2
100.0%
#3
100.0%
#4
100.0%
#5
100.0%
#6
100.0%
#7
100.0%
#8
100.0%
#9
100.0%
#10
100.0%
What city has the Highest Child Poverty Level Among Boys Under the Age of 16 in Ohio?
Little Hocking has the Highest Child Poverty Level Among Boys Under the Age of 16 in Ohio with 100.0%.
What is the Poverty Level Among Boys Under the Age of 16 in the State of Ohio?
Poverty Level Among Boys Under the Age of 16 in Ohio is 18.8%.
What is the Poverty Level Among Boys Under the Age of 16 in the United States?
Poverty Level Among Boys Under the Age of 16 in the United States is 16.9%.