Cities with the Highest Child Poverty Level Among Boys Under the Age of 16 in Florida
RELATED REPORTS & OPTIONS
Highest Poverty | Boys 0-16
Florida
Compare Cities
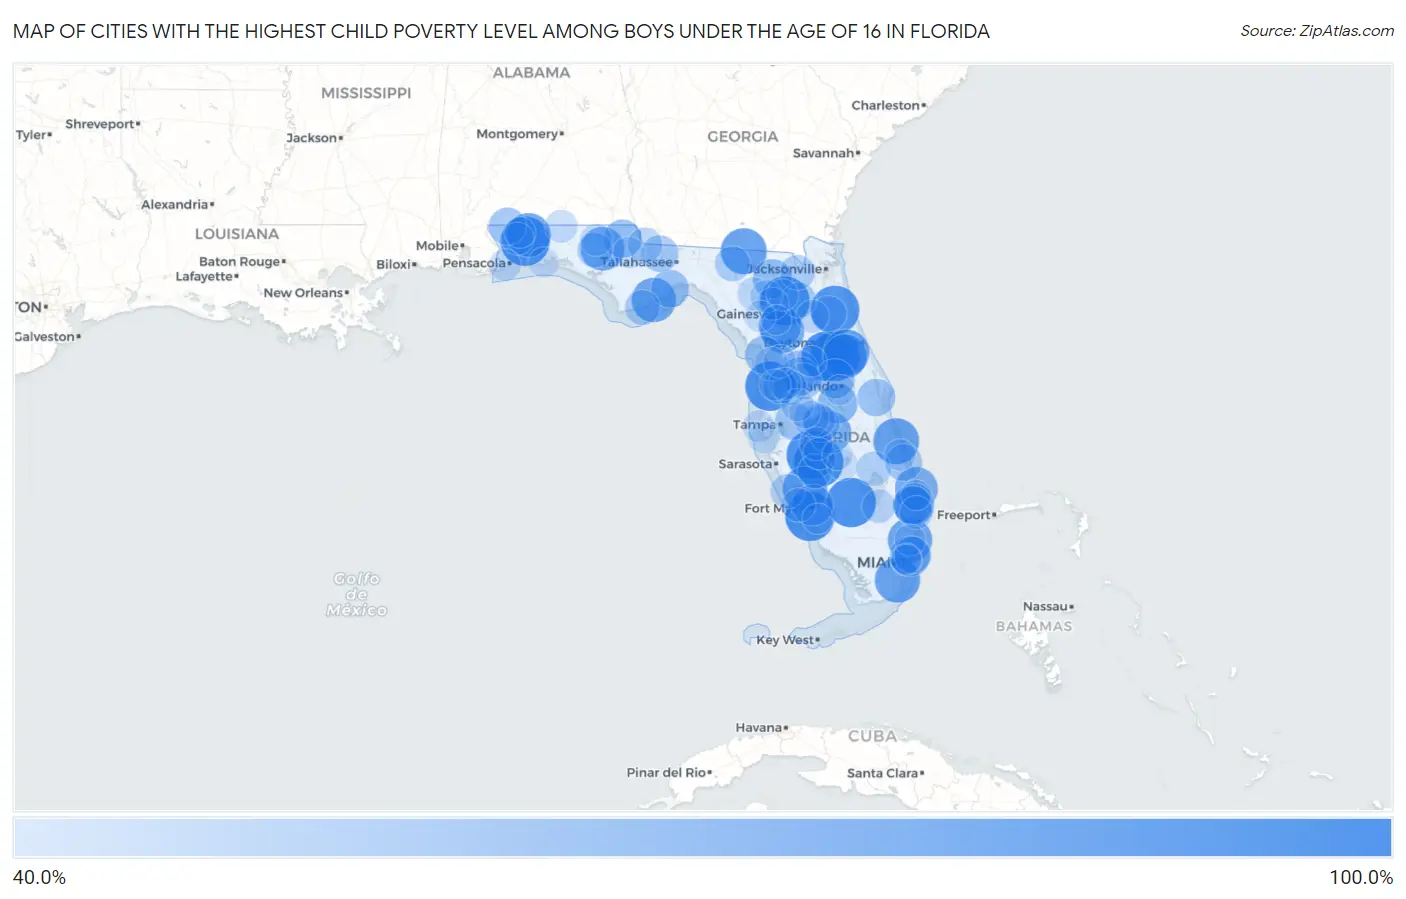
Map of Cities with the Highest Child Poverty Level Among Boys Under the Age of 16 in Florida
0.0%
100.0%
Cities with the Highest Child Poverty Level Among Boys Under the Age of 16 in Florida
| City | Child Poverty (Boys) | vs State | vs National | |
| 1. | Harlem Heights | 100.0% | 18.0%(+82.0)#1 | 16.9%(+83.1)#28 |
| 2. | Lake Kathryn | 100.0% | 18.0%(+82.0)#2 | 16.9%(+83.1)#72 |
| 3. | Gardner | 100.0% | 18.0%(+82.0)#3 | 16.9%(+83.1)#164 |
| 4. | Ona | 100.0% | 18.0%(+82.0)#4 | 16.9%(+83.1)#182 |
| 5. | Pioneer | 100.0% | 18.0%(+82.0)#5 | 16.9%(+83.1)#194 |
| 6. | Pittman | 100.0% | 18.0%(+82.0)#6 | 16.9%(+83.1)#329 |
| 7. | La Crosse | 100.0% | 18.0%(+82.0)#7 | 16.9%(+83.1)#392 |
| 8. | Bayport | 100.0% | 18.0%(+82.0)#8 | 16.9%(+83.1)#485 |
| 9. | Springhill | 100.0% | 18.0%(+82.0)#9 | 16.9%(+83.1)#544 |
| 10. | Hastings | 97.7% | 18.0%(+79.7)#10 | 16.9%(+80.8)#662 |
| 11. | North Deland | 90.3% | 18.0%(+72.3)#11 | 16.9%(+73.4)#728 |
| 12. | Jennings | 89.6% | 18.0%(+71.6)#12 | 16.9%(+72.7)#743 |
| 13. | Gifford | 89.3% | 18.0%(+71.3)#13 | 16.9%(+72.4)#747 |
| 14. | Homestead Base | 87.9% | 18.0%(+69.9)#14 | 16.9%(+71.0)#769 |
| 15. | Solana | 86.0% | 18.0%(+68.0)#15 | 16.9%(+69.1)#818 |
| 16. | Carrabelle | 85.4% | 18.0%(+67.4)#16 | 16.9%(+68.5)#830 |
| 17. | Franklin Park | 85.2% | 18.0%(+67.2)#17 | 16.9%(+68.3)#838 |
| 18. | Deland Southwest | 84.6% | 18.0%(+66.6)#18 | 16.9%(+67.7)#855 |
| 19. | Munson | 84.1% | 18.0%(+66.1)#19 | 16.9%(+67.2)#866 |
| 20. | Wausau | 83.3% | 18.0%(+65.3)#20 | 16.9%(+66.4)#892 |
| 21. | East Williston | 82.6% | 18.0%(+64.6)#21 | 16.9%(+65.7)#922 |
| 22. | Jupiter Inlet Colony | 81.5% | 18.0%(+63.5)#22 | 16.9%(+64.6)#960 |
| 23. | Raleigh | 80.0% | 18.0%(+62.0)#23 | 16.9%(+63.1)#995 |
| 24. | Crooked Lake Park | 78.8% | 18.0%(+60.8)#24 | 16.9%(+61.9)#1,055 |
| 25. | Palmona Park | 76.1% | 18.0%(+58.1)#25 | 16.9%(+59.2)#1,148 |
| 26. | Schall Circle | 75.6% | 18.0%(+57.6)#26 | 16.9%(+58.7)#1,165 |
| 27. | Scottsmoor | 74.4% | 18.0%(+56.4)#27 | 16.9%(+57.5)#1,223 |
| 28. | Biscayne Park | 73.2% | 18.0%(+55.2)#28 | 16.9%(+56.3)#1,274 |
| 29. | Silver Springs | 72.8% | 18.0%(+54.8)#29 | 16.9%(+55.9)#1,286 |
| 30. | Campbell | 72.4% | 18.0%(+54.4)#30 | 16.9%(+55.5)#1,304 |
| 31. | South Apopka | 71.2% | 18.0%(+53.2)#31 | 16.9%(+54.3)#1,367 |
| 32. | Pine Air | 70.9% | 18.0%(+52.9)#32 | 16.9%(+54.0)#1,378 |
| 33. | Watertown | 70.1% | 18.0%(+52.1)#33 | 16.9%(+53.2)#1,414 |
| 34. | Royal Palm Estates | 69.1% | 18.0%(+51.1)#34 | 16.9%(+52.2)#1,459 |
| 35. | Lake Panasoffkee | 68.6% | 18.0%(+50.6)#35 | 16.9%(+51.7)#1,483 |
| 36. | Bushnell | 68.0% | 18.0%(+50.0)#36 | 16.9%(+51.1)#1,509 |
| 37. | Marianna | 67.8% | 18.0%(+49.8)#37 | 16.9%(+50.9)#1,524 |
| 38. | Panacea | 66.3% | 18.0%(+48.3)#38 | 16.9%(+49.4)#1,627 |
| 39. | Yankeetown | 66.1% | 18.0%(+48.1)#39 | 16.9%(+49.2)#1,635 |
| 40. | Cocoa West | 65.5% | 18.0%(+47.5)#40 | 16.9%(+48.6)#1,671 |
| 41. | Century | 65.1% | 18.0%(+47.1)#41 | 16.9%(+48.2)#1,683 |
| 42. | Dover | 64.6% | 18.0%(+46.6)#42 | 16.9%(+47.7)#1,702 |
| 43. | Bal Harbour | 63.9% | 18.0%(+45.8)#43 | 16.9%(+47.0)#1,750 |
| 44. | Indian River Estates | 63.7% | 18.0%(+45.7)#44 | 16.9%(+46.8)#1,757 |
| 45. | Quincy | 62.8% | 18.0%(+44.8)#45 | 16.9%(+45.9)#1,817 |
| 46. | Wahneta | 62.7% | 18.0%(+44.7)#46 | 16.9%(+45.8)#1,821 |
| 47. | Webster | 61.1% | 18.0%(+43.1)#47 | 16.9%(+44.2)#1,922 |
| 48. | East Palatka | 59.9% | 18.0%(+41.9)#48 | 16.9%(+43.0)#2,024 |
| 49. | Crystal Lake | 59.3% | 18.0%(+41.3)#49 | 16.9%(+42.4)#2,057 |
| 50. | Eastpoint | 58.9% | 18.0%(+40.9)#50 | 16.9%(+42.0)#2,084 |
| 51. | Lee | 58.8% | 18.0%(+40.7)#51 | 16.9%(+41.8)#2,095 |
| 52. | Vernon | 58.6% | 18.0%(+40.6)#52 | 16.9%(+41.7)#2,108 |
| 53. | Hampton | 58.6% | 18.0%(+40.6)#53 | 16.9%(+41.7)#2,109 |
| 54. | Ocala Estates | 58.5% | 18.0%(+40.5)#54 | 16.9%(+41.6)#2,122 |
| 55. | Glen St Mary | 58.4% | 18.0%(+40.4)#55 | 16.9%(+41.5)#2,127 |
| 56. | Chattahoochee | 57.8% | 18.0%(+39.8)#56 | 16.9%(+40.9)#2,172 |
| 57. | Cypress Quarters | 57.3% | 18.0%(+39.2)#57 | 16.9%(+40.4)#2,210 |
| 58. | Wiscon | 57.1% | 18.0%(+39.1)#58 | 16.9%(+40.2)#2,222 |
| 59. | Arcadia | 56.8% | 18.0%(+38.8)#59 | 16.9%(+39.9)#2,256 |
| 60. | Grove City | 56.5% | 18.0%(+38.5)#60 | 16.9%(+39.6)#2,280 |
| 61. | Hill N Dale | 56.5% | 18.0%(+38.5)#61 | 16.9%(+39.6)#2,288 |
| 62. | Bokeelia | 54.8% | 18.0%(+36.8)#62 | 16.9%(+37.9)#2,416 |
| 63. | Crystal River | 54.6% | 18.0%(+36.6)#63 | 16.9%(+37.7)#2,433 |
| 64. | South Bay | 54.3% | 18.0%(+36.2)#64 | 16.9%(+37.3)#2,478 |
| 65. | San Castle | 53.6% | 18.0%(+35.6)#65 | 16.9%(+36.7)#2,527 |
| 66. | Bowling Green | 53.3% | 18.0%(+35.2)#66 | 16.9%(+36.4)#2,562 |
| 67. | Jan Phyl Village | 53.2% | 18.0%(+35.2)#67 | 16.9%(+36.3)#2,568 |
| 68. | Tropical Park | 53.1% | 18.0%(+35.0)#68 | 16.9%(+36.2)#2,576 |
| 69. | Branford | 51.9% | 18.0%(+33.9)#69 | 16.9%(+35.0)#2,697 |
| 70. | Paxton | 51.9% | 18.0%(+33.8)#70 | 16.9%(+34.9)#2,700 |
| 71. | Interlachen | 51.8% | 18.0%(+33.8)#71 | 16.9%(+34.9)#2,710 |
| 72. | Beverly Hills | 51.6% | 18.0%(+33.6)#72 | 16.9%(+34.7)#2,728 |
| 73. | Zephyrhills North | 51.6% | 18.0%(+33.6)#73 | 16.9%(+34.7)#2,729 |
| 74. | Fort White | 51.0% | 18.0%(+33.0)#74 | 16.9%(+34.1)#2,789 |
| 75. | High Springs | 50.9% | 18.0%(+32.9)#75 | 16.9%(+34.0)#2,796 |
| 76. | Allentown | 50.6% | 18.0%(+32.6)#76 | 16.9%(+33.7)#2,816 |
| 77. | North Brooksville | 50.1% | 18.0%(+32.1)#77 | 16.9%(+33.2)#2,846 |
| 78. | Bonifay | 50.0% | 18.0%(+32.0)#78 | 16.9%(+33.1)#2,849 |
| 79. | Belleair Shore | 50.0% | 18.0%(+32.0)#79 | 16.9%(+33.1)#2,975 |
| 80. | Warrington | 49.6% | 18.0%(+31.6)#80 | 16.9%(+32.7)#2,998 |
| 81. | Worthington Springs | 48.9% | 18.0%(+30.9)#81 | 16.9%(+32.0)#3,066 |
| 82. | Kathleen | 48.9% | 18.0%(+30.9)#82 | 16.9%(+32.0)#3,067 |
| 83. | Zolfo Springs | 48.7% | 18.0%(+30.7)#83 | 16.9%(+31.8)#3,089 |
| 84. | South Pasadena | 48.5% | 18.0%(+30.5)#84 | 16.9%(+31.6)#3,109 |
| 85. | Altha | 48.2% | 18.0%(+30.2)#85 | 16.9%(+31.3)#3,151 |
| 86. | Trenton | 48.1% | 18.0%(+30.1)#86 | 16.9%(+31.2)#3,154 |
| 87. | Roosevelt Gardens | 48.0% | 18.0%(+30.0)#87 | 16.9%(+31.1)#3,187 |
| 88. | Fort Pierce North | 47.9% | 18.0%(+29.9)#88 | 16.9%(+31.0)#3,194 |
| 89. | North Weeki Wachee | 47.6% | 18.0%(+29.6)#89 | 16.9%(+30.7)#3,225 |
| 90. | Lake Placid | 47.1% | 18.0%(+29.1)#90 | 16.9%(+30.2)#3,279 |
| 91. | Berrydale | 46.7% | 18.0%(+28.7)#91 | 16.9%(+29.8)#3,344 |
| 92. | Lady Lake | 46.4% | 18.0%(+28.4)#92 | 16.9%(+29.5)#3,368 |
| 93. | Gladeview | 46.2% | 18.0%(+28.2)#93 | 16.9%(+29.3)#3,385 |
| 94. | Brownsville | 45.9% | 18.0%(+27.9)#94 | 16.9%(+29.0)#3,431 |
| 95. | Sebring | 45.9% | 18.0%(+27.9)#95 | 16.9%(+29.0)#3,436 |
| 96. | Cinco Bayou | 45.7% | 18.0%(+27.7)#96 | 16.9%(+28.8)#3,461 |
| 97. | Three Oaks | 45.6% | 18.0%(+27.6)#97 | 16.9%(+28.7)#3,473 |
| 98. | Oak Ridge | 45.6% | 18.0%(+27.6)#98 | 16.9%(+28.7)#3,474 |
| 99. | Archer | 45.2% | 18.0%(+27.2)#99 | 16.9%(+28.3)#3,529 |
| 100. | Juno Ridge | 45.1% | 18.0%(+27.1)#100 | 16.9%(+28.2)#3,553 |
Common Questions
What are the Top 10 Cities with the Highest Child Poverty Level Among Boys Under the Age of 16 in Florida?
Top 10 Cities with the Highest Child Poverty Level Among Boys Under the Age of 16 in Florida are:
#1
100.0%
#2
100.0%
#3
100.0%
#4
100.0%
#5
100.0%
#6
100.0%
#7
100.0%
#8
100.0%
#9
100.0%
#10
97.7%
What city has the Highest Child Poverty Level Among Boys Under the Age of 16 in Florida?
Harlem Heights has the Highest Child Poverty Level Among Boys Under the Age of 16 in Florida with 100.0%.
What is the Poverty Level Among Boys Under the Age of 16 in the State of Florida?
Poverty Level Among Boys Under the Age of 16 in Florida is 18.0%.
What is the Poverty Level Among Boys Under the Age of 16 in the United States?
Poverty Level Among Boys Under the Age of 16 in the United States is 16.9%.