Cities with the Highest Child Poverty Level Among Boys Under the Age of 16 in Pennsylvania
RELATED REPORTS & OPTIONS
Highest Poverty | Boys 0-16
Pennsylvania
Compare Cities
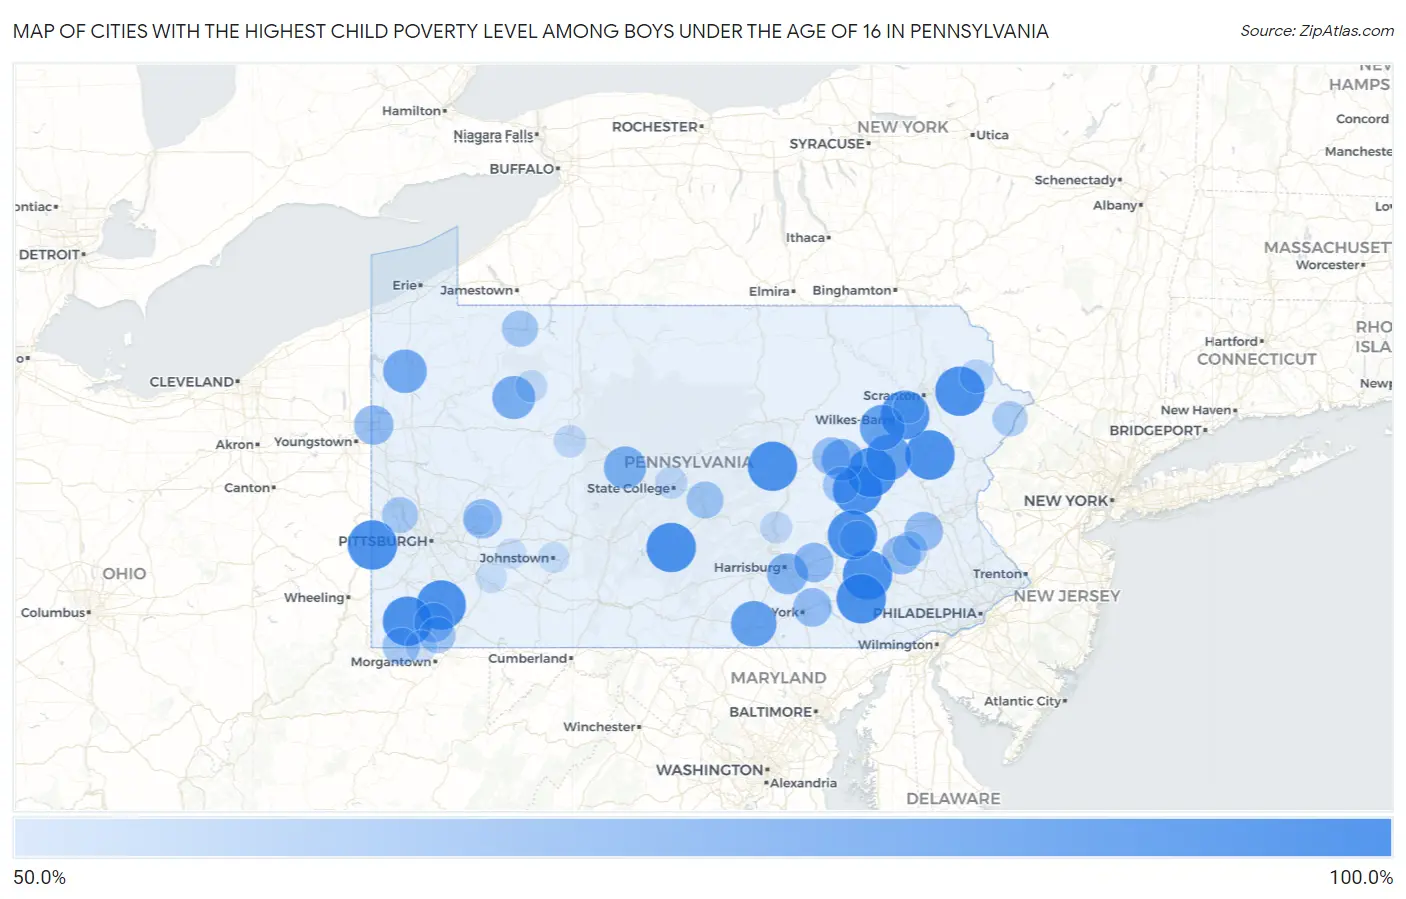
Map of Cities with the Highest Child Poverty Level Among Boys Under the Age of 16 in Pennsylvania
0.0%
100.0%
Cities with the Highest Child Poverty Level Among Boys Under the Age of 16 in Pennsylvania
| City | Child Poverty (Boys) | vs State | vs National | |
| 1. | The Hideout | 100.0% | 16.5%(+83.5)#1 | 16.9%(+83.1)#10 |
| 2. | Hiller | 100.0% | 16.5%(+83.5)#2 | 16.9%(+83.1)#42 |
| 3. | Englewood | 100.0% | 16.5%(+83.5)#3 | 16.9%(+83.1)#92 |
| 4. | Paris | 100.0% | 16.5%(+83.5)#4 | 16.9%(+83.1)#124 |
| 5. | Stevens | 100.0% | 16.5%(+83.5)#5 | 16.9%(+83.1)#150 |
| 6. | Sheppton | 100.0% | 16.5%(+83.5)#6 | 16.9%(+83.1)#169 |
| 7. | West Waynesburg | 100.0% | 16.5%(+83.5)#7 | 16.9%(+83.1)#177 |
| 8. | Bethel | 100.0% | 16.5%(+83.5)#8 | 16.9%(+83.1)#239 |
| 9. | East Altoona | 100.0% | 16.5%(+83.5)#9 | 16.9%(+83.1)#245 |
| 10. | Aaronsburg Cdp Washington County | 100.0% | 16.5%(+83.5)#10 | 16.9%(+83.1)#257 |
| 11. | Elco Borough | 100.0% | 16.5%(+83.5)#11 | 16.9%(+83.1)#275 |
| 12. | Mckee | 100.0% | 16.5%(+83.5)#12 | 16.9%(+83.1)#291 |
| 13. | Witmer | 100.0% | 16.5%(+83.5)#13 | 16.9%(+83.1)#293 |
| 14. | Albrightsville | 100.0% | 16.5%(+83.5)#14 | 16.9%(+83.1)#355 |
| 15. | Friendsville Borough | 100.0% | 16.5%(+83.5)#15 | 16.9%(+83.1)#388 |
| 16. | Vicksburg | 100.0% | 16.5%(+83.5)#16 | 16.9%(+83.1)#397 |
| 17. | Cedar Crest | 100.0% | 16.5%(+83.5)#17 | 16.9%(+83.1)#554 |
| 18. | Glasgow Borough | 100.0% | 16.5%(+83.5)#18 | 16.9%(+83.1)#558 |
| 19. | Beavertown | 100.0% | 16.5%(+83.5)#19 | 16.9%(+83.1)#648 |
| 20. | Hudson | 98.4% | 16.5%(+81.9)#20 | 16.9%(+81.5)#659 |
| 21. | Washingtonville Borough | 92.5% | 16.5%(+76.0)#21 | 16.9%(+75.6)#694 |
| 22. | Pardeesville | 90.7% | 16.5%(+74.2)#22 | 16.9%(+73.8)#724 |
| 23. | Hunterstown | 90.2% | 16.5%(+73.8)#23 | 16.9%(+73.3)#729 |
| 24. | Smithton Borough | 89.6% | 16.5%(+73.1)#24 | 16.9%(+72.6)#745 |
| 25. | Sheatown | 89.1% | 16.5%(+72.6)#25 | 16.9%(+72.2)#749 |
| 26. | Ashley Borough | 86.9% | 16.5%(+70.4)#26 | 16.9%(+70.0)#788 |
| 27. | Renovo Borough | 86.4% | 16.5%(+69.9)#27 | 16.9%(+69.5)#804 |
| 28. | Geneva | 85.0% | 16.5%(+68.5)#28 | 16.9%(+68.1)#841 |
| 29. | Crown | 83.3% | 16.5%(+66.9)#29 | 16.9%(+66.4)#897 |
| 30. | Braddock Borough | 82.7% | 16.5%(+66.2)#30 | 16.9%(+65.8)#917 |
| 31. | West Decatur | 81.7% | 16.5%(+65.2)#31 | 16.9%(+64.8)#952 |
| 32. | St. Clair | 81.2% | 16.5%(+64.8)#32 | 16.9%(+64.3)#971 |
| 33. | Mainville | 80.0% | 16.5%(+63.5)#33 | 16.9%(+63.1)#1,009 |
| 34. | Rainsburg Borough | 80.0% | 16.5%(+63.5)#34 | 16.9%(+63.1)#1,012 |
| 35. | New Market | 78.1% | 16.5%(+61.7)#35 | 16.9%(+61.2)#1,081 |
| 36. | Spring Drive Mobile Home Park | 75.0% | 16.5%(+58.5)#36 | 16.9%(+58.1)#1,189 |
| 37. | Palmdale | 74.9% | 16.5%(+58.4)#37 | 16.9%(+58.0)#1,204 |
| 38. | Fairdale | 74.7% | 16.5%(+58.3)#38 | 16.9%(+57.8)#1,208 |
| 39. | Farrell | 74.6% | 16.5%(+58.1)#39 | 16.9%(+57.7)#1,214 |
| 40. | Orchard Hills | 73.6% | 16.5%(+57.1)#40 | 16.9%(+56.7)#1,252 |
| 41. | Stony Creek Mills | 73.5% | 16.5%(+57.0)#41 | 16.9%(+56.6)#1,256 |
| 42. | Pringle Borough | 73.5% | 16.5%(+57.0)#42 | 16.9%(+56.6)#1,257 |
| 43. | Ernest Borough | 73.1% | 16.5%(+56.6)#43 | 16.9%(+56.2)#1,280 |
| 44. | Mertztown | 72.3% | 16.5%(+55.9)#44 | 16.9%(+55.4)#1,308 |
| 45. | Yorklyn | 72.2% | 16.5%(+55.7)#45 | 16.9%(+55.3)#1,313 |
| 46. | Wall Borough | 71.3% | 16.5%(+54.8)#46 | 16.9%(+54.3)#1,365 |
| 47. | Fernville | 70.6% | 16.5%(+54.1)#47 | 16.9%(+53.7)#1,393 |
| 48. | Donora Borough | 69.8% | 16.5%(+53.3)#48 | 16.9%(+52.9)#1,435 |
| 49. | Brave | 69.1% | 16.5%(+52.6)#49 | 16.9%(+52.2)#1,462 |
| 50. | Blawnox Borough | 68.6% | 16.5%(+52.1)#50 | 16.9%(+51.7)#1,485 |
| 51. | Milroy | 68.4% | 16.5%(+51.9)#51 | 16.9%(+51.5)#1,497 |
| 52. | Rankin Borough | 67.8% | 16.5%(+51.3)#52 | 16.9%(+50.9)#1,528 |
| 53. | Wilburton Number One | 67.4% | 16.5%(+51.0)#53 | 16.9%(+50.5)#1,539 |
| 54. | Starbrick | 66.7% | 16.5%(+50.2)#54 | 16.9%(+49.8)#1,567 |
| 55. | Laurel Run Borough | 66.7% | 16.5%(+50.2)#55 | 16.9%(+49.8)#1,570 |
| 56. | Franklin Borough | 66.7% | 16.5%(+50.2)#56 | 16.9%(+49.8)#1,577 |
| 57. | Thompson Borough | 66.7% | 16.5%(+50.2)#57 | 16.9%(+49.8)#1,580 |
| 58. | Mapletown | 66.7% | 16.5%(+50.2)#58 | 16.9%(+49.8)#1,601 |
| 59. | East Pittsburgh Borough | 66.5% | 16.5%(+50.0)#59 | 16.9%(+49.6)#1,618 |
| 60. | Aliquippa | 66.0% | 16.5%(+49.5)#60 | 16.9%(+49.1)#1,639 |
| 61. | Rehrersburg | 65.6% | 16.5%(+49.2)#61 | 16.9%(+48.7)#1,659 |
| 62. | Woodbury Borough | 65.3% | 16.5%(+48.8)#62 | 16.9%(+48.4)#1,676 |
| 63. | Birchwood Lakes | 63.6% | 16.5%(+47.2)#63 | 16.9%(+46.7)#1,758 |
| 64. | Oley | 63.3% | 16.5%(+46.9)#64 | 16.9%(+46.4)#1,784 |
| 65. | Burlington Borough | 63.2% | 16.5%(+46.7)#65 | 16.9%(+46.3)#1,795 |
| 66. | Fallston Borough | 62.5% | 16.5%(+46.0)#66 | 16.9%(+45.6)#1,838 |
| 67. | Fairchance Borough | 62.0% | 16.5%(+45.6)#67 | 16.9%(+45.1)#1,867 |
| 68. | Northern Cambria Borough | 61.2% | 16.5%(+44.7)#68 | 16.9%(+44.3)#1,920 |
| 69. | Turtle Creek Borough | 60.6% | 16.5%(+44.1)#69 | 16.9%(+43.7)#1,961 |
| 70. | White Mills | 60.4% | 16.5%(+43.9)#70 | 16.9%(+43.5)#1,968 |
| 71. | Big Run Borough | 60.0% | 16.5%(+43.5)#71 | 16.9%(+43.1)#1,987 |
| 72. | Halifax Borough | 58.9% | 16.5%(+42.4)#72 | 16.9%(+42.0)#2,080 |
| 73. | Rochester Borough | 58.8% | 16.5%(+42.3)#73 | 16.9%(+41.9)#2,091 |
| 74. | Whitaker Borough | 58.6% | 16.5%(+42.1)#74 | 16.9%(+41.7)#2,112 |
| 75. | Sandy | 57.3% | 16.5%(+40.8)#75 | 16.9%(+40.4)#2,206 |
| 76. | Shenandoah Borough | 57.1% | 16.5%(+40.7)#76 | 16.9%(+40.2)#2,214 |
| 77. | Toftrees | 56.9% | 16.5%(+40.4)#77 | 16.9%(+40.0)#2,252 |
| 78. | Atwood Borough | 56.5% | 16.5%(+40.1)#78 | 16.9%(+39.6)#2,284 |
| 79. | Marienville | 56.3% | 16.5%(+39.8)#79 | 16.9%(+39.4)#2,298 |
| 80. | Pittston | 56.2% | 16.5%(+39.7)#80 | 16.9%(+39.3)#2,309 |
| 81. | Mount Morris | 56.1% | 16.5%(+39.6)#81 | 16.9%(+39.2)#2,313 |
| 82. | Freedom Borough | 56.0% | 16.5%(+39.5)#82 | 16.9%(+39.1)#2,321 |
| 83. | Lenkerville | 56.0% | 16.5%(+39.5)#83 | 16.9%(+39.1)#2,322 |
| 84. | Enon Valley Borough | 55.6% | 16.5%(+39.1)#84 | 16.9%(+38.7)#2,356 |
| 85. | Mahanoy City Borough | 55.0% | 16.5%(+38.6)#85 | 16.9%(+38.1)#2,388 |
| 86. | Mahaffey Borough | 55.0% | 16.5%(+38.5)#86 | 16.9%(+38.1)#2,397 |
| 87. | Beavertown Borough | 54.5% | 16.5%(+38.1)#87 | 16.9%(+37.6)#2,436 |
| 88. | Lykens Borough | 54.4% | 16.5%(+37.9)#88 | 16.9%(+37.5)#2,464 |
| 89. | Johnstown | 54.1% | 16.5%(+37.6)#89 | 16.9%(+37.2)#2,489 |
| 90. | Dushore Borough | 53.8% | 16.5%(+37.4)#90 | 16.9%(+36.9)#2,502 |
| 91. | Mammoth | 53.8% | 16.5%(+37.4)#91 | 16.9%(+36.9)#2,506 |
| 92. | Marion Center Borough | 53.3% | 16.5%(+36.9)#92 | 16.9%(+36.4)#2,553 |
| 93. | Roseville Borough | 53.3% | 16.5%(+36.9)#93 | 16.9%(+36.4)#2,558 |
| 94. | Millwood | 52.9% | 16.5%(+36.5)#94 | 16.9%(+36.0)#2,585 |
| 95. | Colwyn Borough | 52.8% | 16.5%(+36.4)#95 | 16.9%(+35.9)#2,608 |
| 96. | Mansfield Borough | 52.7% | 16.5%(+36.2)#96 | 16.9%(+35.8)#2,618 |
| 97. | Mechanicsville Borough | 52.6% | 16.5%(+36.2)#97 | 16.9%(+35.7)#2,626 |
| 98. | Donegal Borough | 52.6% | 16.5%(+36.2)#98 | 16.9%(+35.7)#2,629 |
| 99. | Oklahoma | 51.5% | 16.5%(+35.0)#99 | 16.9%(+34.6)#2,739 |
| 100. | Galeton Borough | 51.4% | 16.5%(+35.0)#100 | 16.9%(+34.5)#2,747 |
Common Questions
What are the Top 10 Cities with the Highest Child Poverty Level Among Boys Under the Age of 16 in Pennsylvania?
Top 10 Cities with the Highest Child Poverty Level Among Boys Under the Age of 16 in Pennsylvania are:
#1
100.0%
#2
100.0%
#3
100.0%
#4
100.0%
#5
100.0%
#6
100.0%
#7
100.0%
#8
100.0%
#9
100.0%
#10
100.0%
What city has the Highest Child Poverty Level Among Boys Under the Age of 16 in Pennsylvania?
The Hideout has the Highest Child Poverty Level Among Boys Under the Age of 16 in Pennsylvania with 100.0%.
What is the Poverty Level Among Boys Under the Age of 16 in the State of Pennsylvania?
Poverty Level Among Boys Under the Age of 16 in Pennsylvania is 16.5%.
What is the Poverty Level Among Boys Under the Age of 16 in the United States?
Poverty Level Among Boys Under the Age of 16 in the United States is 16.9%.