Cities with the Highest Child Poverty Level Among Boys Under the Age of 16 in Indiana
RELATED REPORTS & OPTIONS
Highest Poverty | Boys 0-16
Indiana
Compare Cities
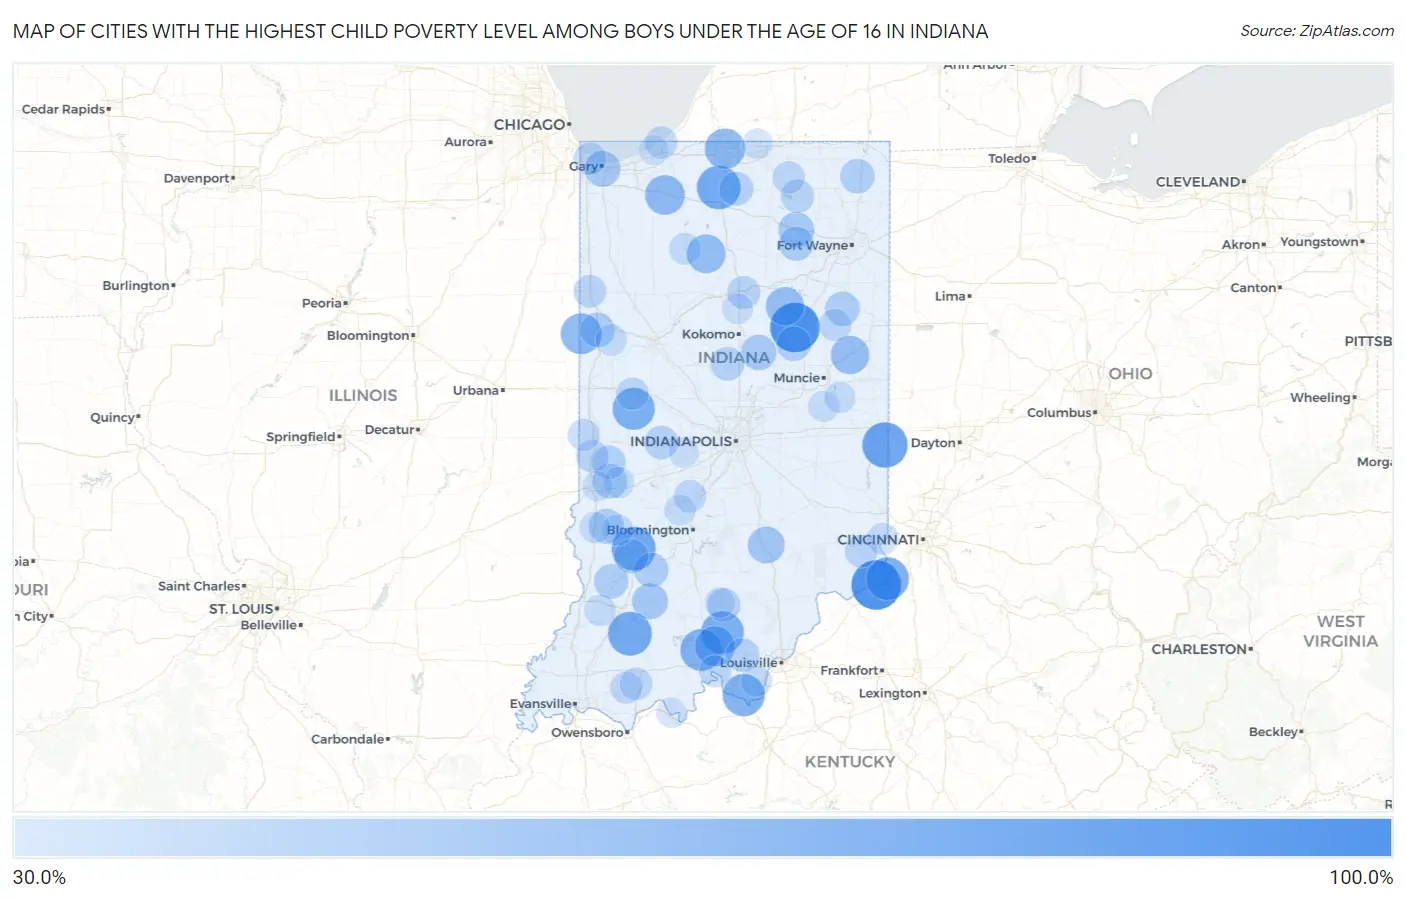
Map of Cities with the Highest Child Poverty Level Among Boys Under the Age of 16 in Indiana
0.0%
100.0%
Cities with the Highest Child Poverty Level Among Boys Under the Age of 16 in Indiana
| City | Child Poverty (Boys) | vs State | vs National | |
| 1. | Thayer | 100.0% | 16.3%(+83.7)#1 | 16.9%(+83.1)#120 |
| 2. | Lewis | 100.0% | 16.3%(+83.7)#2 | 16.9%(+83.1)#133 |
| 3. | Servia | 100.0% | 16.3%(+83.7)#3 | 16.9%(+83.1)#201 |
| 4. | Abington | 100.0% | 16.3%(+83.7)#4 | 16.9%(+83.1)#284 |
| 5. | Brimfield | 100.0% | 16.3%(+83.7)#5 | 16.9%(+83.1)#304 |
| 6. | Liberty Mills | 100.0% | 16.3%(+83.7)#6 | 16.9%(+83.1)#311 |
| 7. | Marion | 100.0% | 16.3%(+83.7)#7 | 16.9%(+83.1)#337 |
| 8. | Burnett | 100.0% | 16.3%(+83.7)#8 | 16.9%(+83.1)#346 |
| 9. | Arthur | 100.0% | 16.3%(+83.7)#9 | 16.9%(+83.1)#349 |
| 10. | Millville | 100.0% | 16.3%(+83.7)#10 | 16.9%(+83.1)#357 |
| 11. | Adams | 100.0% | 16.3%(+83.7)#11 | 16.9%(+83.1)#363 |
| 12. | Alford | 100.0% | 16.3%(+83.7)#12 | 16.9%(+83.1)#368 |
| 13. | Deer Creek | 100.0% | 16.3%(+83.7)#13 | 16.9%(+83.1)#387 |
| 14. | Pence | 100.0% | 16.3%(+83.7)#14 | 16.9%(+83.1)#391 |
| 15. | Eugene | 100.0% | 16.3%(+83.7)#15 | 16.9%(+83.1)#398 |
| 16. | Grayford | 100.0% | 16.3%(+83.7)#16 | 16.9%(+83.1)#455 |
| 17. | Linn Grove | 100.0% | 16.3%(+83.7)#17 | 16.9%(+83.1)#464 |
| 18. | Otisco | 100.0% | 16.3%(+83.7)#18 | 16.9%(+83.1)#476 |
| 19. | St. Omer | 100.0% | 16.3%(+83.7)#19 | 16.9%(+83.1)#510 |
| 20. | Hobbs | 100.0% | 16.3%(+83.7)#20 | 16.9%(+83.1)#514 |
| 21. | Cross Plains | 100.0% | 16.3%(+83.7)#21 | 16.9%(+83.1)#520 |
| 22. | Florence | 100.0% | 16.3%(+83.7)#22 | 16.9%(+83.1)#537 |
| 23. | Penntown | 100.0% | 16.3%(+83.7)#23 | 16.9%(+83.1)#545 |
| 24. | Pulaski | 100.0% | 16.3%(+83.7)#24 | 16.9%(+83.1)#618 |
| 25. | Hartz Lake | 92.0% | 16.3%(+75.6)#25 | 16.9%(+75.1)#701 |
| 26. | Leiters Ford | 86.0% | 16.3%(+69.7)#26 | 16.9%(+69.1)#817 |
| 27. | Boston | 85.7% | 16.3%(+69.4)#27 | 16.9%(+68.8)#822 |
| 28. | Switz City | 81.2% | 16.3%(+64.9)#28 | 16.9%(+64.3)#967 |
| 29. | Otwell | 80.4% | 16.3%(+64.0)#29 | 16.9%(+63.5)#991 |
| 30. | La Paz | 80.0% | 16.3%(+63.7)#30 | 16.9%(+63.1)#996 |
| 31. | Patriot | 77.3% | 16.3%(+60.9)#31 | 16.9%(+60.4)#1,110 |
| 32. | Hardinsburg | 76.5% | 16.3%(+60.1)#32 | 16.9%(+59.6)#1,136 |
| 33. | Laconia | 75.0% | 16.3%(+58.7)#33 | 16.9%(+58.1)#1,200 |
| 34. | Alamo | 75.0% | 16.3%(+58.7)#34 | 16.9%(+58.1)#1,202 |
| 35. | English | 73.8% | 16.3%(+57.5)#35 | 16.9%(+56.9)#1,241 |
| 36. | Ambia | 70.5% | 16.3%(+54.2)#36 | 16.9%(+53.6)#1,399 |
| 37. | Roseland | 69.2% | 16.3%(+52.9)#37 | 16.9%(+52.3)#1,452 |
| 38. | Marengo | 67.9% | 16.3%(+51.5)#38 | 16.9%(+51.0)#1,519 |
| 39. | Hanna | 66.7% | 16.3%(+50.3)#39 | 16.9%(+49.8)#1,568 |
| 40. | Coal | 66.7% | 16.3%(+50.3)#40 | 16.9%(+49.8)#1,610 |
| 41. | Kewanna | 63.8% | 16.3%(+47.4)#41 | 16.9%(+46.9)#1,755 |
| 42. | Redkey | 62.5% | 16.3%(+46.2)#42 | 16.9%(+45.6)#1,828 |
| 43. | La Fontaine | 62.3% | 16.3%(+46.0)#43 | 16.9%(+45.4)#1,854 |
| 44. | Amity | 57.7% | 16.3%(+41.4)#44 | 16.9%(+40.8)#2,181 |
| 45. | Jonesville | 57.1% | 16.3%(+40.8)#45 | 16.9%(+40.2)#2,227 |
| 46. | Loogootee | 54.5% | 16.3%(+38.2)#46 | 16.9%(+37.6)#2,451 |
| 47. | Gary | 54.3% | 16.3%(+37.9)#47 | 16.9%(+37.4)#2,474 |
| 48. | Larwill | 54.1% | 16.3%(+37.7)#48 | 16.9%(+37.2)#2,492 |
| 49. | Windfall City | 52.4% | 16.3%(+36.0)#49 | 16.9%(+35.5)#2,647 |
| 50. | Hymera | 51.2% | 16.3%(+34.9)#50 | 16.9%(+34.3)#2,767 |
| 51. | Fairmount | 50.0% | 16.3%(+33.7)#51 | 16.9%(+33.1)#2,851 |
| 52. | Seelyville | 50.0% | 16.3%(+33.7)#52 | 16.9%(+33.1)#2,868 |
| 53. | Boswell | 50.0% | 16.3%(+33.7)#53 | 16.9%(+33.1)#2,874 |
| 54. | Hudson | 50.0% | 16.3%(+33.7)#54 | 16.9%(+33.1)#2,884 |
| 55. | Edwardsport | 50.0% | 16.3%(+33.7)#55 | 16.9%(+33.1)#2,915 |
| 56. | Crane | 50.0% | 16.3%(+33.7)#56 | 16.9%(+33.1)#2,917 |
| 57. | Poneto | 50.0% | 16.3%(+33.7)#57 | 16.9%(+33.1)#2,940 |
| 58. | South Whitley | 49.2% | 16.3%(+32.8)#58 | 16.9%(+32.3)#3,036 |
| 59. | Lyons | 49.1% | 16.3%(+32.7)#59 | 16.9%(+32.2)#3,048 |
| 60. | Bremen | 48.0% | 16.3%(+31.7)#60 | 16.9%(+31.1)#3,177 |
| 61. | Kempton | 47.6% | 16.3%(+31.3)#61 | 16.9%(+30.7)#3,223 |
| 62. | Rosedale | 47.2% | 16.3%(+30.9)#62 | 16.9%(+30.3)#3,263 |
| 63. | New Salisbury | 46.9% | 16.3%(+30.6)#63 | 16.9%(+30.0)#3,318 |
| 64. | Campbellsburg | 46.9% | 16.3%(+30.5)#64 | 16.9%(+30.0)#3,323 |
| 65. | Bainbridge | 46.8% | 16.3%(+30.4)#65 | 16.9%(+29.8)#3,333 |
| 66. | Cromwell | 45.9% | 16.3%(+29.6)#66 | 16.9%(+29.0)#3,438 |
| 67. | Peru | 45.2% | 16.3%(+28.9)#67 | 16.9%(+28.3)#3,528 |
| 68. | Dillsboro | 44.2% | 16.3%(+27.8)#68 | 16.9%(+27.3)#3,668 |
| 69. | Kentland | 44.0% | 16.3%(+27.6)#69 | 16.9%(+27.1)#3,693 |
| 70. | Clinton | 43.9% | 16.3%(+27.5)#70 | 16.9%(+27.0)#3,706 |
| 71. | East Chicago | 43.5% | 16.3%(+27.2)#71 | 16.9%(+26.6)#3,760 |
| 72. | Paragon | 43.5% | 16.3%(+27.1)#72 | 16.9%(+26.6)#3,765 |
| 73. | Waynetown | 43.4% | 16.3%(+27.1)#73 | 16.9%(+26.5)#3,786 |
| 74. | Michiana Shores | 42.9% | 16.3%(+26.5)#74 | 16.9%(+26.0)#3,864 |
| 75. | Gentryville | 42.9% | 16.3%(+26.5)#75 | 16.9%(+26.0)#3,871 |
| 76. | Millersburg | 42.8% | 16.3%(+26.4)#76 | 16.9%(+25.8)#3,904 |
| 77. | Montpelier | 42.7% | 16.3%(+26.3)#77 | 16.9%(+25.8)#3,915 |
| 78. | Johnson | 42.6% | 16.3%(+26.3)#78 | 16.9%(+25.7)#3,926 |
| 79. | Tennyson | 42.1% | 16.3%(+25.8)#79 | 16.9%(+25.2)#3,988 |
| 80. | Dana | 41.9% | 16.3%(+25.6)#80 | 16.9%(+25.0)#4,010 |
| 81. | Leavenworth | 41.7% | 16.3%(+25.3)#81 | 16.9%(+24.8)#4,051 |
| 82. | Winamac | 41.3% | 16.3%(+25.0)#82 | 16.9%(+24.4)#4,111 |
| 83. | Jasonville | 40.8% | 16.3%(+24.5)#83 | 16.9%(+23.9)#4,176 |
| 84. | Monroe City | 40.4% | 16.3%(+24.1)#84 | 16.9%(+23.5)#4,234 |
| 85. | Lawrenceburg | 40.4% | 16.3%(+24.0)#85 | 16.9%(+23.5)#4,240 |
| 86. | Pine Village | 40.0% | 16.3%(+23.7)#86 | 16.9%(+23.1)#4,324 |
| 87. | Shelburn | 39.2% | 16.3%(+22.9)#87 | 16.9%(+22.3)#4,452 |
| 88. | Mount Summit | 38.9% | 16.3%(+22.6)#88 | 16.9%(+22.0)#4,511 |
| 89. | Staunton | 38.9% | 16.3%(+22.6)#89 | 16.9%(+22.0)#4,514 |
| 90. | Blountsville | 38.9% | 16.3%(+22.6)#90 | 16.9%(+22.0)#4,519 |
| 91. | Stinesville | 38.5% | 16.3%(+22.1)#91 | 16.9%(+21.6)#4,577 |
| 92. | Elizabeth | 38.5% | 16.3%(+22.1)#92 | 16.9%(+21.6)#4,587 |
| 93. | Grissom Afb | 38.3% | 16.3%(+22.0)#93 | 16.9%(+21.4)#4,623 |
| 94. | Pittsburg | 38.1% | 16.3%(+21.8)#94 | 16.9%(+21.2)#4,661 |
| 95. | Simonton Lake | 37.0% | 16.3%(+20.7)#95 | 16.9%(+20.1)#4,858 |
| 96. | Amo | 36.5% | 16.3%(+20.2)#96 | 16.9%(+19.6)#4,942 |
| 97. | Saltillo | 36.4% | 16.3%(+20.0)#97 | 16.9%(+19.5)#4,986 |
| 98. | Terre Haute | 36.3% | 16.3%(+20.0)#98 | 16.9%(+19.4)#4,995 |
| 99. | Cannelton | 36.3% | 16.3%(+20.0)#99 | 16.9%(+19.4)#4,997 |
| 100. | Michigan City | 35.8% | 16.3%(+19.4)#100 | 16.9%(+18.9)#5,100 |
Common Questions
What are the Top 10 Cities with the Highest Child Poverty Level Among Boys Under the Age of 16 in Indiana?
Top 10 Cities with the Highest Child Poverty Level Among Boys Under the Age of 16 in Indiana are:
#1
100.0%
#2
100.0%
#3
85.7%
#4
81.2%
#5
80.4%
#6
80.0%
#7
77.3%
#8
76.5%
#9
75.0%
#10
75.0%
What city has the Highest Child Poverty Level Among Boys Under the Age of 16 in Indiana?
Marion has the Highest Child Poverty Level Among Boys Under the Age of 16 in Indiana with 100.0%.
What is the Poverty Level Among Boys Under the Age of 16 in the State of Indiana?
Poverty Level Among Boys Under the Age of 16 in Indiana is 16.3%.
What is the Poverty Level Among Boys Under the Age of 16 in the United States?
Poverty Level Among Boys Under the Age of 16 in the United States is 16.9%.