Cities with the Highest Child Poverty Level Among Boys Under the Age of 16 in Montana
RELATED REPORTS & OPTIONS
Highest Poverty | Boys 0-16
Montana
Compare Cities
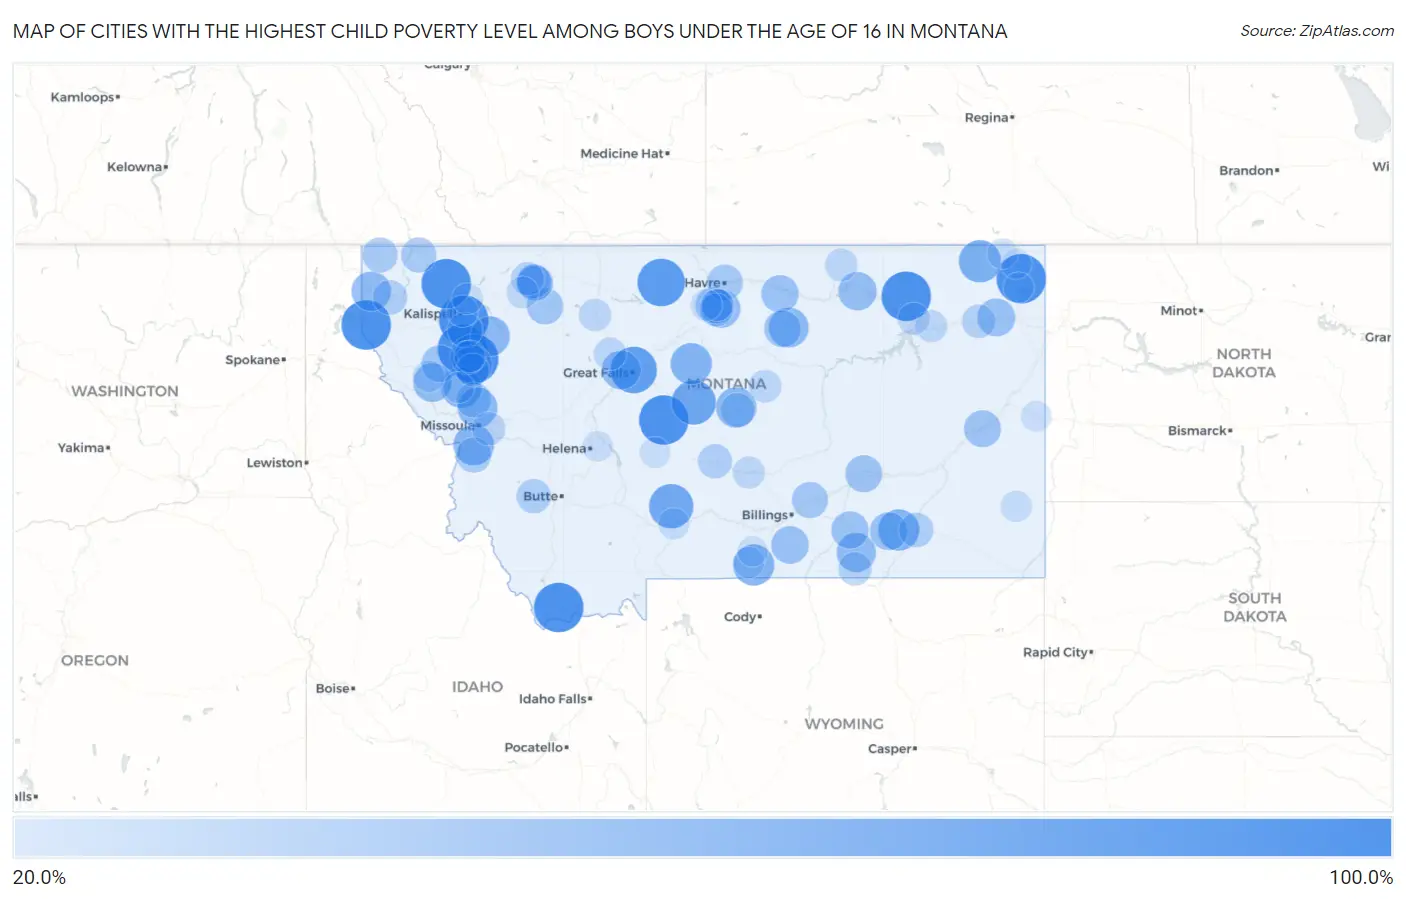
Map of Cities with the Highest Child Poverty Level Among Boys Under the Age of 16 in Montana
0.0%
100.0%
Cities with the Highest Child Poverty Level Among Boys Under the Age of 16 in Montana
| City | Child Poverty (Boys) | vs State | vs National | |
| 1. | St Marie | 100.0% | 15.4%(+84.6)#1 | 16.9%(+83.1)#189 |
| 2. | Heron | 100.0% | 15.4%(+84.6)#2 | 16.9%(+83.1)#253 |
| 3. | Riverview Colony | 100.0% | 15.4%(+84.6)#3 | 16.9%(+83.1)#278 |
| 4. | Forest Hill Village | 100.0% | 15.4%(+84.6)#4 | 16.9%(+83.1)#298 |
| 5. | Lima | 100.0% | 15.4%(+84.6)#5 | 16.9%(+83.1)#335 |
| 6. | Bull Lake | 100.0% | 15.4%(+84.6)#6 | 16.9%(+83.1)#339 |
| 7. | Big Arm | 100.0% | 15.4%(+84.6)#7 | 16.9%(+83.1)#382 |
| 8. | Turtle Lake | 100.0% | 15.4%(+84.6)#8 | 16.9%(+83.1)#442 |
| 9. | Olney | 100.0% | 15.4%(+84.6)#9 | 16.9%(+83.1)#444 |
| 10. | Nibbe | 100.0% | 15.4%(+84.6)#10 | 16.9%(+83.1)#447 |
| 11. | Acton | 100.0% | 15.4%(+84.6)#11 | 16.9%(+83.1)#542 |
| 12. | Camrose Colony | 100.0% | 15.4%(+84.6)#12 | 16.9%(+83.1)#547 |
| 13. | Eagle Creek Colony | 100.0% | 15.4%(+84.6)#13 | 16.9%(+83.1)#594 |
| 14. | Pleasant Valley Colony | 100.0% | 15.4%(+84.6)#14 | 16.9%(+83.1)#613 |
| 15. | Neihart | 100.0% | 15.4%(+84.6)#15 | 16.9%(+83.1)#626 |
| 16. | Reserve | 100.0% | 15.4%(+84.6)#16 | 16.9%(+83.1)#646 |
| 17. | Pendroy | 100.0% | 15.4%(+84.6)#17 | 16.9%(+83.1)#654 |
| 18. | Joplin | 91.7% | 15.4%(+76.3)#18 | 16.9%(+74.8)#707 |
| 19. | Black Eagle | 87.5% | 15.4%(+72.1)#19 | 16.9%(+70.6)#776 |
| 20. | New Miami Colony | 82.0% | 15.4%(+66.6)#20 | 16.9%(+65.1)#937 |
| 21. | Stanford | 79.2% | 15.4%(+63.8)#21 | 16.9%(+62.3)#1,042 |
| 22. | Clyde Park | 78.9% | 15.4%(+63.6)#22 | 16.9%(+62.0)#1,050 |
| 23. | Flaxville | 71.4% | 15.4%(+56.1)#23 | 16.9%(+54.5)#1,360 |
| 24. | Geraldine | 66.7% | 15.4%(+51.3)#24 | 16.9%(+49.8)#1,583 |
| 25. | Bearcreek | 66.7% | 15.4%(+51.3)#25 | 16.9%(+49.8)#1,598 |
| 26. | Lame Deer | 66.5% | 15.4%(+51.1)#26 | 16.9%(+49.6)#1,620 |
| 27. | Florence | 64.4% | 15.4%(+49.0)#27 | 16.9%(+47.5)#1,718 |
| 28. | Lewistown Heights | 63.4% | 15.4%(+48.1)#28 | 16.9%(+46.5)#1,782 |
| 29. | Old Agency | 63.2% | 15.4%(+47.8)#29 | 16.9%(+46.3)#1,798 |
| 30. | Lodge Pole | 61.5% | 15.4%(+46.2)#30 | 16.9%(+44.6)#1,897 |
| 31. | Evaro | 61.4% | 15.4%(+46.0)#31 | 16.9%(+44.5)#1,907 |
| 32. | Swan Lake | 61.1% | 15.4%(+45.7)#32 | 16.9%(+44.2)#1,929 |
| 33. | Troy | 59.7% | 15.4%(+44.4)#33 | 16.9%(+42.8)#2,030 |
| 34. | Pablo | 59.3% | 15.4%(+43.9)#34 | 16.9%(+42.4)#2,058 |
| 35. | Lodge Grass | 59.3% | 15.4%(+43.9)#35 | 16.9%(+42.4)#2,060 |
| 36. | Paradise | 57.1% | 15.4%(+41.8)#36 | 16.9%(+40.2)#2,228 |
| 37. | Sun Prairie | 56.9% | 15.4%(+41.6)#37 | 16.9%(+40.0)#2,245 |
| 38. | Rimrock Colony | 56.4% | 15.4%(+41.0)#38 | 16.9%(+39.5)#2,297 |
| 39. | Saco | 55.6% | 15.4%(+40.2)#39 | 16.9%(+38.7)#2,362 |
| 40. | Parker School | 55.1% | 15.4%(+39.7)#40 | 16.9%(+38.2)#2,387 |
| 41. | Brockton | 53.6% | 15.4%(+38.2)#41 | 16.9%(+36.7)#2,528 |
| 42. | Muddy | 52.9% | 15.4%(+37.5)#42 | 16.9%(+36.0)#2,599 |
| 43. | Pryor | 52.5% | 15.4%(+37.2)#43 | 16.9%(+35.6)#2,637 |
| 44. | Fort Belknap Agency | 51.5% | 15.4%(+36.1)#44 | 16.9%(+34.6)#2,745 |
| 45. | Crow Agency | 51.4% | 15.4%(+36.0)#45 | 16.9%(+34.5)#2,750 |
| 46. | Hot Springs | 50.0% | 15.4%(+34.6)#46 | 16.9%(+33.1)#2,880 |
| 47. | Fallon | 50.0% | 15.4%(+34.6)#47 | 16.9%(+33.1)#2,897 |
| 48. | Hysham | 50.0% | 15.4%(+34.6)#48 | 16.9%(+33.1)#2,927 |
| 49. | Hays | 49.6% | 15.4%(+34.2)#49 | 16.9%(+32.7)#3,005 |
| 50. | Heart Butte | 47.9% | 15.4%(+32.6)#50 | 16.9%(+31.0)#3,192 |
| 51. | Boneau | 47.1% | 15.4%(+31.7)#51 | 16.9%(+30.2)#3,290 |
| 52. | Worden | 46.9% | 15.4%(+31.5)#52 | 16.9%(+30.0)#3,324 |
| 53. | Havre North | 45.9% | 15.4%(+30.6)#53 | 16.9%(+29.0)#3,432 |
| 54. | South Browning | 44.3% | 15.4%(+28.9)#54 | 16.9%(+27.4)#3,649 |
| 55. | Browning | 44.2% | 15.4%(+28.8)#55 | 16.9%(+27.3)#3,664 |
| 56. | Stevensville | 43.1% | 15.4%(+27.7)#56 | 16.9%(+26.2)#3,834 |
| 57. | Eureka | 42.9% | 15.4%(+27.5)#57 | 16.9%(+26.0)#3,852 |
| 58. | Arlee | 42.9% | 15.4%(+27.5)#58 | 16.9%(+26.0)#3,861 |
| 59. | Yaak | 42.9% | 15.4%(+27.5)#59 | 16.9%(+26.0)#3,868 |
| 60. | Lakeside | 42.4% | 15.4%(+27.1)#60 | 16.9%(+25.5)#3,933 |
| 61. | Libby | 40.8% | 15.4%(+25.4)#61 | 16.9%(+23.9)#4,180 |
| 62. | Ashland | 40.7% | 15.4%(+25.3)#62 | 16.9%(+23.8)#4,196 |
| 63. | Sangrey | 40.6% | 15.4%(+25.2)#63 | 16.9%(+23.7)#4,208 |
| 64. | Anaconda Deer Lodge County | 39.9% | 15.4%(+24.5)#64 | 16.9%(+23.0)#4,358 |
| 65. | North Browning | 39.8% | 15.4%(+24.5)#65 | 16.9%(+22.9)#4,363 |
| 66. | Harlowton | 39.6% | 15.4%(+24.3)#66 | 16.9%(+22.7)#4,394 |
| 67. | Lewistown | 38.9% | 15.4%(+23.5)#67 | 16.9%(+22.0)#4,505 |
| 68. | Poplar | 36.6% | 15.4%(+21.2)#68 | 16.9%(+19.7)#4,929 |
| 69. | Wyola | 36.2% | 15.4%(+20.8)#69 | 16.9%(+19.3)#5,019 |
| 70. | Kerr | 36.0% | 15.4%(+20.6)#70 | 16.9%(+19.1)#5,065 |
| 71. | Turah | 35.8% | 15.4%(+20.4)#71 | 16.9%(+18.9)#5,093 |
| 72. | Starr School | 35.5% | 15.4%(+20.1)#72 | 16.9%(+18.6)#5,179 |
| 73. | Ronan | 34.4% | 15.4%(+19.1)#73 | 16.9%(+17.5)#5,405 |
| 74. | St Pierre | 34.3% | 15.4%(+18.9)#74 | 16.9%(+17.4)#5,445 |
| 75. | Power | 33.3% | 15.4%(+18.0)#75 | 16.9%(+16.4)#5,707 |
| 76. | Roy | 33.3% | 15.4%(+18.0)#76 | 16.9%(+16.4)#5,717 |
| 77. | Whitewater | 33.3% | 15.4%(+18.0)#77 | 16.9%(+16.4)#5,738 |
| 78. | Conrad | 32.9% | 15.4%(+17.5)#78 | 16.9%(+16.0)#5,827 |
| 79. | Ryegate | 31.6% | 15.4%(+16.2)#79 | 16.9%(+14.7)#6,156 |
| 80. | Frazer | 31.3% | 15.4%(+16.0)#80 | 16.9%(+14.4)#6,211 |
| 81. | Nashua | 31.2% | 15.4%(+15.9)#81 | 16.9%(+14.3)#6,234 |
| 82. | Azure | 30.6% | 15.4%(+15.2)#82 | 16.9%(+13.7)#6,423 |
| 83. | East Glacier Park Village | 30.4% | 15.4%(+15.1)#83 | 16.9%(+13.5)#6,462 |
| 84. | Polson | 30.1% | 15.4%(+14.7)#84 | 16.9%(+13.2)#6,533 |
| 85. | Plains | 29.4% | 15.4%(+14.0)#85 | 16.9%(+12.5)#6,703 |
| 86. | Rocky Boy West | 28.8% | 15.4%(+13.5)#86 | 16.9%(+11.9)#6,860 |
| 87. | Evergreen | 28.4% | 15.4%(+13.0)#87 | 16.9%(+11.5)#6,980 |
| 88. | Red Lodge | 27.8% | 15.4%(+12.4)#88 | 16.9%(+10.9)#7,165 |
| 89. | Ekalaka | 27.8% | 15.4%(+12.4)#89 | 16.9%(+10.9)#7,184 |
| 90. | Pine Creek | 27.7% | 15.4%(+12.3)#90 | 16.9%(+10.8)#7,231 |
| 91. | Livingston | 27.6% | 15.4%(+12.2)#91 | 16.9%(+10.7)#7,245 |
| 92. | Columbia Falls | 27.0% | 15.4%(+11.7)#92 | 16.9%(+10.1)#7,404 |
| 93. | Dixon | 26.9% | 15.4%(+11.6)#93 | 16.9%(+10.0)#7,439 |
| 94. | White Sulphur Springs | 26.5% | 15.4%(+11.2)#94 | 16.9%(+9.63)#7,570 |
| 95. | Wibaux | 25.8% | 15.4%(+10.4)#95 | 16.9%(+8.90)#7,804 |
| 96. | Helena Valley Southeast | 25.5% | 15.4%(+10.1)#96 | 16.9%(+8.55)#7,921 |
| 97. | Roberts | 25.0% | 15.4%(+9.64)#97 | 16.9%(+8.10)#8,088 |
| 98. | Outlook | 25.0% | 15.4%(+9.64)#98 | 16.9%(+8.10)#8,137 |
| 99. | Plentywood | 24.4% | 15.4%(+9.01)#99 | 16.9%(+7.47)#8,306 |
| 100. | Medicine Lake | 24.0% | 15.4%(+8.64)#100 | 16.9%(+7.10)#8,433 |
Common Questions
What are the Top 10 Cities with the Highest Child Poverty Level Among Boys Under the Age of 16 in Montana?
Top 10 Cities with the Highest Child Poverty Level Among Boys Under the Age of 16 in Montana are:
#1
100.0%
#2
100.0%
#3
100.0%
#4
100.0%
#5
100.0%
#6
100.0%
#7
100.0%
#8
100.0%
#9
100.0%
#10
91.7%
What city has the Highest Child Poverty Level Among Boys Under the Age of 16 in Montana?
St Marie has the Highest Child Poverty Level Among Boys Under the Age of 16 in Montana with 100.0%.
What is the Poverty Level Among Boys Under the Age of 16 in the State of Montana?
Poverty Level Among Boys Under the Age of 16 in Montana is 15.4%.
What is the Poverty Level Among Boys Under the Age of 16 in the United States?
Poverty Level Among Boys Under the Age of 16 in the United States is 16.9%.