Cities with the Highest Child Poverty Level Among Boys Under the Age of 16 in Minnesota
RELATED REPORTS & OPTIONS
Highest Poverty | Boys 0-16
Minnesota
Compare Cities
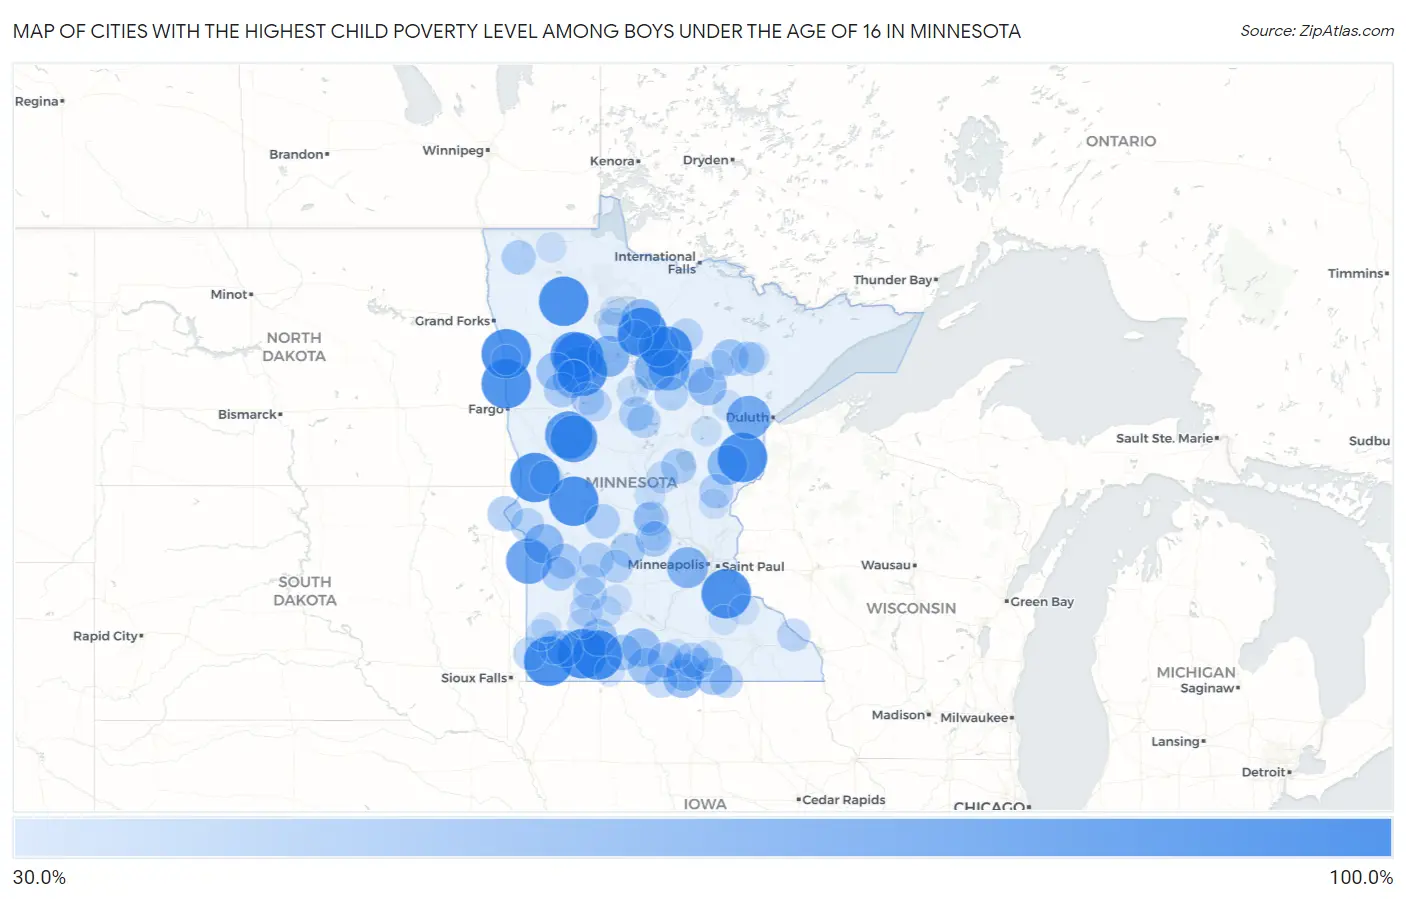
Map of Cities with the Highest Child Poverty Level Among Boys Under the Age of 16 in Minnesota
0.0%
100.0%
Cities with the Highest Child Poverty Level Among Boys Under the Age of 16 in Minnesota
| City | Child Poverty (Boys) | vs State | vs National | |
| 1. | Perley | 100.0% | 10.9%(+89.1)#1 | 16.9%(+83.1)#461 |
| 2. | Inger | 100.0% | 10.9%(+89.1)#2 | 16.9%(+83.1)#505 |
| 3. | Ebro | 100.0% | 10.9%(+89.1)#3 | 16.9%(+83.1)#516 |
| 4. | Nielsville | 100.0% | 10.9%(+89.1)#4 | 16.9%(+83.1)#521 |
| 5. | Dundee | 100.0% | 10.9%(+89.1)#5 | 16.9%(+83.1)#531 |
| 6. | Goodridge | 100.0% | 10.9%(+89.1)#6 | 16.9%(+83.1)#533 |
| 7. | New Trier | 100.0% | 10.9%(+89.1)#7 | 16.9%(+83.1)#555 |
| 8. | Kenneth | 100.0% | 10.9%(+89.1)#8 | 16.9%(+83.1)#562 |
| 9. | Funkley | 100.0% | 10.9%(+89.1)#9 | 16.9%(+83.1)#575 |
| 10. | Essig | 100.0% | 10.9%(+89.1)#10 | 16.9%(+83.1)#580 |
| 11. | Nashua | 100.0% | 10.9%(+89.1)#11 | 16.9%(+83.1)#591 |
| 12. | Bruno | 100.0% | 10.9%(+89.1)#12 | 16.9%(+83.1)#614 |
| 13. | Wilder | 100.0% | 10.9%(+89.1)#13 | 16.9%(+83.1)#621 |
| 14. | South End | 100.0% | 10.9%(+89.1)#14 | 16.9%(+83.1)#627 |
| 15. | Farwell | 100.0% | 10.9%(+89.1)#15 | 16.9%(+83.1)#633 |
| 16. | Dent | 92.9% | 10.9%(+82.0)#16 | 16.9%(+76.0)#692 |
| 17. | Richville | 91.7% | 10.9%(+80.8)#17 | 16.9%(+74.8)#711 |
| 18. | Lengby | 90.0% | 10.9%(+79.1)#18 | 16.9%(+73.1)#733 |
| 19. | Marietta | 86.4% | 10.9%(+75.5)#19 | 16.9%(+69.5)#807 |
| 20. | Mahnomen | 80.0% | 10.9%(+69.1)#20 | 16.9%(+63.1)#1,002 |
| 21. | Wilton | 72.0% | 10.9%(+61.1)#21 | 16.9%(+55.1)#1,320 |
| 22. | Spring Park | 71.7% | 10.9%(+60.9)#22 | 16.9%(+54.8)#1,333 |
| 23. | Bena | 71.4% | 10.9%(+60.5)#23 | 16.9%(+54.5)#1,350 |
| 24. | Ball Club | 71.4% | 10.9%(+60.5)#24 | 16.9%(+54.5)#1,353 |
| 25. | Squaw Lake | 71.4% | 10.9%(+60.5)#25 | 16.9%(+54.5)#1,355 |
| 26. | Finlayson | 68.4% | 10.9%(+57.5)#26 | 16.9%(+51.5)#1,495 |
| 27. | Kelliher | 66.7% | 10.9%(+55.8)#27 | 16.9%(+49.8)#1,573 |
| 28. | Correll | 66.7% | 10.9%(+55.8)#28 | 16.9%(+49.8)#1,616 |
| 29. | Twin Lakes | 63.6% | 10.9%(+52.7)#29 | 16.9%(+46.7)#1,763 |
| 30. | Warba | 63.3% | 10.9%(+52.4)#30 | 16.9%(+46.4)#1,786 |
| 31. | Kiester | 62.9% | 10.9%(+52.0)#31 | 16.9%(+46.0)#1,813 |
| 32. | Lewisville | 62.5% | 10.9%(+51.6)#32 | 16.9%(+45.6)#1,835 |
| 33. | Riverland | 60.4% | 10.9%(+49.5)#33 | 16.9%(+43.5)#1,975 |
| 34. | Walters | 60.0% | 10.9%(+49.1)#34 | 16.9%(+43.1)#2,014 |
| 35. | Myrtle | 60.0% | 10.9%(+49.1)#35 | 16.9%(+43.1)#2,017 |
| 36. | Jeffers | 58.8% | 10.9%(+47.9)#36 | 16.9%(+41.9)#2,089 |
| 37. | Iona | 57.9% | 10.9%(+47.0)#37 | 16.9%(+41.0)#2,167 |
| 38. | Granada | 57.7% | 10.9%(+46.8)#38 | 16.9%(+40.8)#2,182 |
| 39. | Chisholm | 57.1% | 10.9%(+46.2)#39 | 16.9%(+40.2)#2,238 |
| 40. | South Haven | 55.0% | 10.9%(+44.1)#40 | 16.9%(+38.1)#2,398 |
| 41. | Odin | 54.2% | 10.9%(+43.3)#41 | 16.9%(+37.3)#2,487 |
| 42. | Delavan | 53.8% | 10.9%(+43.0)#42 | 16.9%(+36.9)#2,510 |
| 43. | Watson | 53.3% | 10.9%(+42.4)#43 | 16.9%(+36.4)#2,557 |
| 44. | Blackduck | 52.9% | 10.9%(+42.0)#44 | 16.9%(+36.0)#2,605 |
| 45. | Browns Valley | 52.8% | 10.9%(+41.9)#45 | 16.9%(+35.9)#2,610 |
| 46. | Vineland | 52.6% | 10.9%(+41.7)#46 | 16.9%(+35.7)#2,622 |
| 47. | Waite Park | 52.0% | 10.9%(+41.1)#47 | 16.9%(+35.1)#2,685 |
| 48. | Raymond | 51.9% | 10.9%(+41.1)#48 | 16.9%(+35.0)#2,693 |
| 49. | White Earth | 51.4% | 10.9%(+40.5)#49 | 16.9%(+34.5)#2,749 |
| 50. | Grove City | 51.2% | 10.9%(+40.3)#50 | 16.9%(+34.3)#2,774 |
| 51. | Freeborn | 51.1% | 10.9%(+40.2)#51 | 16.9%(+34.2)#2,784 |
| 52. | Brooten | 50.9% | 10.9%(+40.0)#52 | 16.9%(+34.0)#2,799 |
| 53. | Coleraine | 50.0% | 10.9%(+39.1)#53 | 16.9%(+33.1)#2,854 |
| 54. | Redby | 50.0% | 10.9%(+39.1)#54 | 16.9%(+33.1)#2,862 |
| 55. | Backus | 50.0% | 10.9%(+39.1)#55 | 16.9%(+33.1)#2,906 |
| 56. | Boyd | 50.0% | 10.9%(+39.1)#56 | 16.9%(+33.1)#2,934 |
| 57. | Leonidas | 50.0% | 10.9%(+39.1)#57 | 16.9%(+33.1)#2,979 |
| 58. | Henriette | 50.0% | 10.9%(+39.1)#58 | 16.9%(+33.1)#2,984 |
| 59. | Halma | 50.0% | 10.9%(+39.1)#59 | 16.9%(+33.1)#2,985 |
| 60. | Chandler | 48.6% | 10.9%(+37.7)#60 | 16.9%(+31.7)#3,106 |
| 61. | Remer | 48.1% | 10.9%(+37.3)#61 | 16.9%(+31.2)#3,158 |
| 62. | Pine River | 47.8% | 10.9%(+36.9)#62 | 16.9%(+30.9)#3,201 |
| 63. | Jasper | 47.2% | 10.9%(+36.3)#63 | 16.9%(+30.3)#3,264 |
| 64. | Belview | 47.2% | 10.9%(+36.3)#64 | 16.9%(+30.3)#3,268 |
| 65. | Clinton | 47.1% | 10.9%(+36.2)#65 | 16.9%(+30.2)#3,291 |
| 66. | Lake Lillian | 47.1% | 10.9%(+36.2)#66 | 16.9%(+30.2)#3,295 |
| 67. | Wendell | 47.1% | 10.9%(+36.2)#67 | 16.9%(+30.2)#3,297 |
| 68. | Bigfork | 46.2% | 10.9%(+35.3)#68 | 16.9%(+29.3)#3,402 |
| 69. | Elmore | 46.0% | 10.9%(+35.1)#69 | 16.9%(+29.1)#3,425 |
| 70. | Lyle | 45.9% | 10.9%(+35.1)#70 | 16.9%(+29.0)#3,433 |
| 71. | Pine Point | 45.7% | 10.9%(+34.8)#71 | 16.9%(+28.8)#3,464 |
| 72. | Osage | 45.5% | 10.9%(+34.6)#72 | 16.9%(+28.6)#3,499 |
| 73. | Lucan | 45.5% | 10.9%(+34.6)#73 | 16.9%(+28.6)#3,503 |
| 74. | Minnesota City | 45.5% | 10.9%(+34.6)#74 | 16.9%(+28.6)#3,505 |
| 75. | Naytahwaush | 45.3% | 10.9%(+34.4)#75 | 16.9%(+28.4)#3,525 |
| 76. | Lastrup | 42.9% | 10.9%(+32.0)#76 | 16.9%(+26.0)#3,892 |
| 77. | Manchester | 42.9% | 10.9%(+32.0)#77 | 16.9%(+26.0)#3,896 |
| 78. | Sacred Heart | 41.4% | 10.9%(+30.5)#78 | 16.9%(+24.5)#4,099 |
| 79. | Holland | 40.5% | 10.9%(+29.7)#79 | 16.9%(+23.6)#4,215 |
| 80. | Walker | 40.5% | 10.9%(+29.6)#80 | 16.9%(+23.6)#4,226 |
| 81. | Geneva | 40.5% | 10.9%(+29.6)#81 | 16.9%(+23.6)#4,227 |
| 82. | Gilbert | 40.1% | 10.9%(+29.2)#82 | 16.9%(+23.2)#4,282 |
| 83. | Royalton | 39.7% | 10.9%(+28.8)#83 | 16.9%(+22.8)#4,386 |
| 84. | Clements | 38.9% | 10.9%(+28.0)#84 | 16.9%(+22.0)#4,518 |
| 85. | Franklin | 38.8% | 10.9%(+27.9)#85 | 16.9%(+21.9)#4,530 |
| 86. | Floodwood | 38.2% | 10.9%(+27.3)#86 | 16.9%(+21.3)#4,632 |
| 87. | Braham | 37.8% | 10.9%(+26.9)#87 | 16.9%(+20.9)#4,717 |
| 88. | Shelly | 37.5% | 10.9%(+26.6)#88 | 16.9%(+20.6)#4,784 |
| 89. | St Joseph | 37.4% | 10.9%(+26.6)#89 | 16.9%(+20.5)#4,793 |
| 90. | Badger | 37.3% | 10.9%(+26.4)#90 | 16.9%(+20.4)#4,805 |
| 91. | Minnesota Lake | 37.3% | 10.9%(+26.4)#91 | 16.9%(+20.4)#4,812 |
| 92. | Mcgregor | 37.3% | 10.9%(+26.4)#92 | 16.9%(+20.4)#4,819 |
| 93. | Kenyon | 37.2% | 10.9%(+26.3)#93 | 16.9%(+20.3)#4,821 |
| 94. | Walnut Grove | 37.2% | 10.9%(+26.3)#94 | 16.9%(+20.3)#4,829 |
| 95. | Ponemah | 37.1% | 10.9%(+26.2)#95 | 16.9%(+20.2)#4,846 |
| 96. | Fairhaven | 37.0% | 10.9%(+26.1)#96 | 16.9%(+20.1)#4,855 |
| 97. | Goodhue | 37.0% | 10.9%(+26.1)#97 | 16.9%(+20.1)#4,870 |
| 98. | Ruthton | 36.8% | 10.9%(+26.0)#98 | 16.9%(+19.9)#4,889 |
| 99. | Keewatin | 36.8% | 10.9%(+25.9)#99 | 16.9%(+19.9)#4,897 |
| 100. | Jackson | 36.6% | 10.9%(+25.8)#100 | 16.9%(+19.7)#4,920 |
Common Questions
What are the Top 10 Cities with the Highest Child Poverty Level Among Boys Under the Age of 16 in Minnesota?
Top 10 Cities with the Highest Child Poverty Level Among Boys Under the Age of 16 in Minnesota are:
What city has the Highest Child Poverty Level Among Boys Under the Age of 16 in Minnesota?
Perley has the Highest Child Poverty Level Among Boys Under the Age of 16 in Minnesota with 100.0%.
What is the Poverty Level Among Boys Under the Age of 16 in the State of Minnesota?
Poverty Level Among Boys Under the Age of 16 in Minnesota is 10.9%.
What is the Poverty Level Among Boys Under the Age of 16 in the United States?
Poverty Level Among Boys Under the Age of 16 in the United States is 16.9%.