Cities with the Highest Child Poverty Level Among Boys Under the Age of 16 in New Mexico
RELATED REPORTS & OPTIONS
Highest Poverty | Boys 0-16
New Mexico
Compare Cities
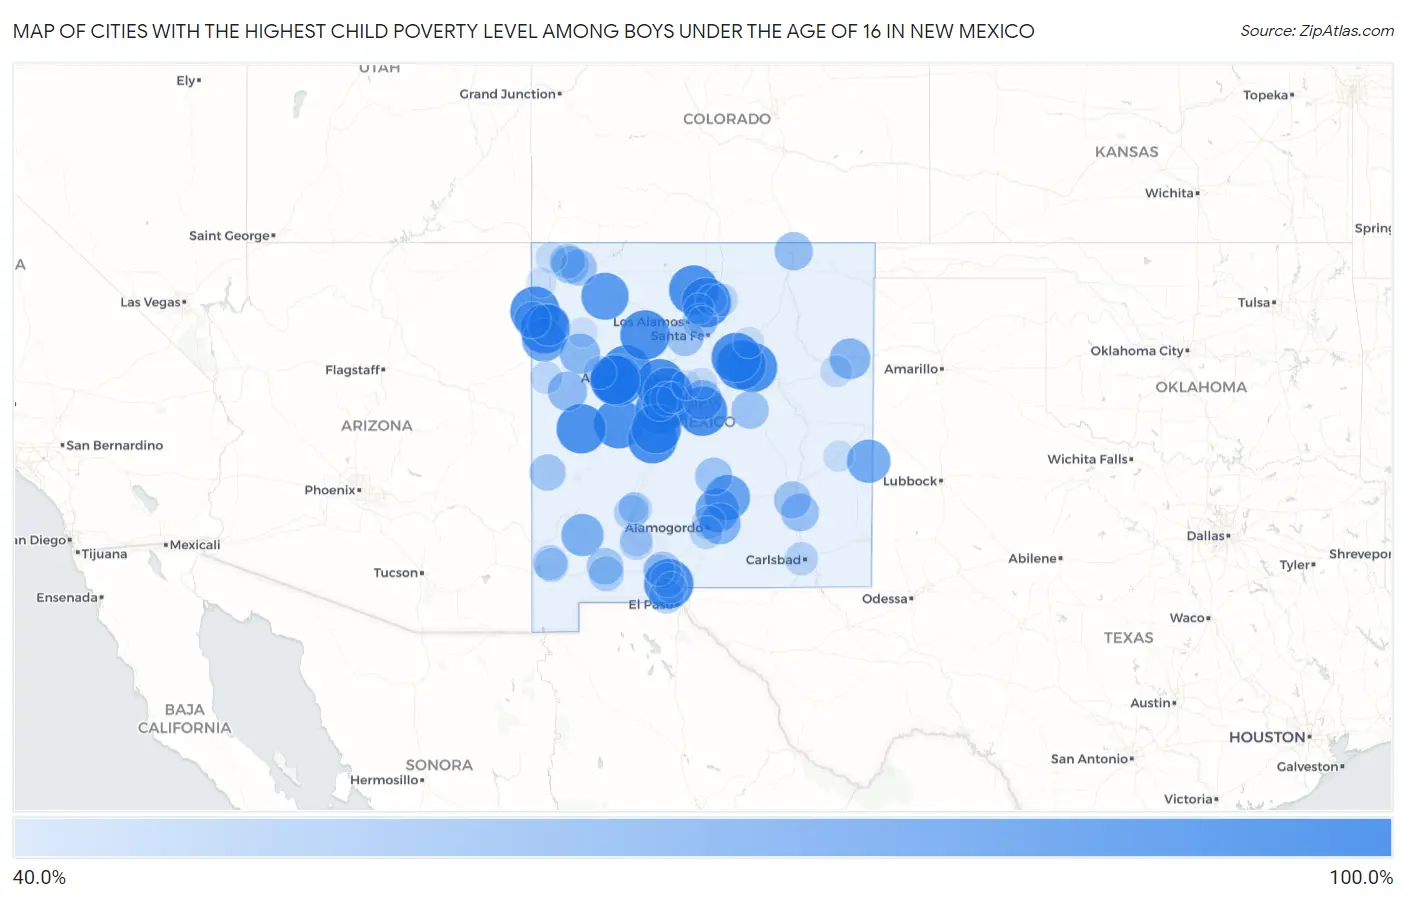
Map of Cities with the Highest Child Poverty Level Among Boys Under the Age of 16 in New Mexico
0.0%
100.0%
Cities with the Highest Child Poverty Level Among Boys Under the Age of 16 in New Mexico
| City | Child Poverty (Boys) | vs State | vs National | |
| 1. | Gamerco | 100.0% | 24.5%(+75.5)#1 | 16.9%(+83.1)#33 |
| 2. | Berino | 100.0% | 24.5%(+75.5)#2 | 16.9%(+83.1)#47 |
| 3. | Alamo | 100.0% | 24.5%(+75.5)#3 | 16.9%(+83.1)#59 |
| 4. | El Rito | 100.0% | 24.5%(+75.5)#4 | 16.9%(+83.1)#73 |
| 5. | Monterey Park | 100.0% | 24.5%(+75.5)#5 | 16.9%(+83.1)#138 |
| 6. | Polvadera | 100.0% | 24.5%(+75.5)#6 | 16.9%(+83.1)#140 |
| 7. | Seboyeta | 100.0% | 24.5%(+75.5)#7 | 16.9%(+83.1)#156 |
| 8. | Tecolotito | 100.0% | 24.5%(+75.5)#8 | 16.9%(+83.1)#163 |
| 9. | Totah Vista | 100.0% | 24.5%(+75.5)#9 | 16.9%(+83.1)#176 |
| 10. | Villanueva | 100.0% | 24.5%(+75.5)#10 | 16.9%(+83.1)#185 |
| 11. | Pueblitos | 100.0% | 24.5%(+75.5)#11 | 16.9%(+83.1)#191 |
| 12. | Seama | 100.0% | 24.5%(+75.5)#12 | 16.9%(+83.1)#202 |
| 13. | Willard | 100.0% | 24.5%(+75.5)#13 | 16.9%(+83.1)#218 |
| 14. | Homer C Jones | 100.0% | 24.5%(+75.5)#14 | 16.9%(+83.1)#225 |
| 15. | Lybrook | 100.0% | 24.5%(+75.5)#15 | 16.9%(+83.1)#228 |
| 16. | Ribera | 100.0% | 24.5%(+75.5)#16 | 16.9%(+83.1)#231 |
| 17. | Sagar | 100.0% | 24.5%(+75.5)#17 | 16.9%(+83.1)#234 |
| 18. | Velarde | 100.0% | 24.5%(+75.5)#18 | 16.9%(+83.1)#260 |
| 19. | Crystal | 100.0% | 24.5%(+75.5)#19 | 16.9%(+83.1)#263 |
| 20. | Jamestown | 100.0% | 24.5%(+75.5)#20 | 16.9%(+83.1)#314 |
| 21. | North Acomita Village | 100.0% | 24.5%(+75.5)#21 | 16.9%(+83.1)#315 |
| 22. | Pajarito Mesa | 100.0% | 24.5%(+75.5)#22 | 16.9%(+83.1)#323 |
| 23. | Nakaibito | 100.0% | 24.5%(+75.5)#23 | 16.9%(+83.1)#327 |
| 24. | Chical | 100.0% | 24.5%(+75.5)#24 | 16.9%(+83.1)#331 |
| 25. | Pie Town | 100.0% | 24.5%(+75.5)#25 | 16.9%(+83.1)#375 |
| 26. | San Luis | 100.0% | 24.5%(+75.5)#26 | 16.9%(+83.1)#386 |
| 27. | La Joya | 100.0% | 24.5%(+75.5)#27 | 16.9%(+83.1)#424 |
| 28. | South Acomita Village | 100.0% | 24.5%(+75.5)#28 | 16.9%(+83.1)#452 |
| 29. | Nageezi | 93.0% | 24.5%(+68.5)#29 | 16.9%(+76.1)#687 |
| 30. | Prewitt | 92.9% | 24.5%(+68.4)#30 | 16.9%(+76.0)#688 |
| 31. | Ojo Encino | 87.3% | 24.5%(+62.8)#31 | 16.9%(+70.4)#781 |
| 32. | Ruidoso Downs | 86.6% | 24.5%(+62.1)#32 | 16.9%(+69.7)#798 |
| 33. | Borrego Pass | 83.3% | 24.5%(+58.8)#33 | 16.9%(+66.4)#902 |
| 34. | Mescalero | 82.7% | 24.5%(+58.2)#34 | 16.9%(+65.8)#919 |
| 35. | Haystack | 81.8% | 24.5%(+57.3)#35 | 16.9%(+64.9)#945 |
| 36. | Rock Springs | 81.7% | 24.5%(+57.1)#36 | 16.9%(+64.7)#953 |
| 37. | Causey | 81.6% | 24.5%(+57.1)#37 | 16.9%(+64.7)#955 |
| 38. | Becenti | 78.9% | 24.5%(+54.4)#38 | 16.9%(+62.0)#1,051 |
| 39. | Pinedale | 78.7% | 24.5%(+54.1)#39 | 16.9%(+61.7)#1,061 |
| 40. | Santa Clara | 78.0% | 24.5%(+53.5)#40 | 16.9%(+61.1)#1,083 |
| 41. | Tohatchi | 75.9% | 24.5%(+51.4)#41 | 16.9%(+59.0)#1,155 |
| 42. | Cloudcroft | 74.8% | 24.5%(+50.3)#42 | 16.9%(+57.9)#1,205 |
| 43. | Logan | 73.1% | 24.5%(+48.6)#43 | 16.9%(+56.2)#1,278 |
| 44. | Thoreau | 72.2% | 24.5%(+47.7)#44 | 16.9%(+55.3)#1,310 |
| 45. | Sundance | 71.9% | 24.5%(+47.4)#45 | 16.9%(+55.0)#1,325 |
| 46. | Estancia | 69.8% | 24.5%(+45.3)#46 | 16.9%(+52.9)#1,434 |
| 47. | Pinehill | 69.2% | 24.5%(+44.7)#47 | 16.9%(+52.3)#1,454 |
| 48. | Crestview | 69.2% | 24.5%(+44.7)#48 | 16.9%(+52.3)#1,457 |
| 49. | Raton | 65.8% | 24.5%(+41.3)#49 | 16.9%(+48.9)#1,647 |
| 50. | Hagerman | 64.7% | 24.5%(+40.2)#50 | 16.9%(+47.8)#1,698 |
| 51. | Vaughn | 63.6% | 24.5%(+39.1)#51 | 16.9%(+46.7)#1,759 |
| 52. | Carrizozo | 63.2% | 24.5%(+38.6)#52 | 16.9%(+46.3)#1,791 |
| 53. | Ojo Amarillo | 62.7% | 24.5%(+38.2)#53 | 16.9%(+45.8)#1,820 |
| 54. | Midway | 62.5% | 24.5%(+38.0)#54 | 16.9%(+45.6)#1,829 |
| 55. | Cochiti Lake | 62.5% | 24.5%(+38.0)#55 | 16.9%(+45.6)#1,830 |
| 56. | University Park | 61.7% | 24.5%(+37.1)#56 | 16.9%(+44.8)#1,887 |
| 57. | Navajo | 61.2% | 24.5%(+36.7)#57 | 16.9%(+44.3)#1,919 |
| 58. | Keeler Farm | 60.5% | 24.5%(+36.0)#58 | 16.9%(+43.6)#1,965 |
| 59. | Napi Headquarters | 60.4% | 24.5%(+35.9)#59 | 16.9%(+43.5)#1,969 |
| 60. | Reserve | 60.0% | 24.5%(+35.5)#60 | 16.9%(+43.1)#1,993 |
| 61. | Nenahnezad | 56.7% | 24.5%(+32.1)#61 | 16.9%(+39.8)#2,269 |
| 62. | El Rancho | 56.5% | 24.5%(+32.0)#62 | 16.9%(+39.6)#2,287 |
| 63. | La Hacienda | 56.4% | 24.5%(+31.9)#63 | 16.9%(+39.5)#2,291 |
| 64. | Santa Teresa | 55.3% | 24.5%(+30.8)#64 | 16.9%(+38.4)#2,372 |
| 65. | El Cerro Mission | 55.1% | 24.5%(+30.5)#65 | 16.9%(+38.2)#2,385 |
| 66. | Glen Acres | 55.0% | 24.5%(+30.5)#66 | 16.9%(+38.1)#2,396 |
| 67. | Belen | 55.0% | 24.5%(+30.5)#67 | 16.9%(+38.1)#2,401 |
| 68. | Williamsburg | 54.5% | 24.5%(+30.0)#68 | 16.9%(+37.6)#2,437 |
| 69. | Vado | 54.5% | 24.5%(+30.0)#69 | 16.9%(+37.6)#2,450 |
| 70. | Lordsburg | 53.3% | 24.5%(+28.8)#70 | 16.9%(+36.4)#2,547 |
| 71. | Dona Ana | 52.1% | 24.5%(+27.6)#71 | 16.9%(+35.2)#2,680 |
| 72. | La Luz | 52.0% | 24.5%(+27.5)#72 | 16.9%(+35.1)#2,686 |
| 73. | Elephant Butte | 51.4% | 24.5%(+26.8)#73 | 16.9%(+34.4)#2,755 |
| 74. | Happy Valley | 51.3% | 24.5%(+26.8)#74 | 16.9%(+34.4)#2,762 |
| 75. | Tortugas | 51.1% | 24.5%(+26.6)#75 | 16.9%(+34.2)#2,779 |
| 76. | Grants | 50.4% | 24.5%(+25.9)#76 | 16.9%(+33.5)#2,829 |
| 77. | Boles Acres | 50.3% | 24.5%(+25.8)#77 | 16.9%(+33.4)#2,840 |
| 78. | Hatch | 50.2% | 24.5%(+25.7)#78 | 16.9%(+33.3)#2,845 |
| 79. | Salem | 50.0% | 24.5%(+25.5)#79 | 16.9%(+33.1)#2,870 |
| 80. | Picuris Pueblo | 50.0% | 24.5%(+25.5)#80 | 16.9%(+33.1)#2,971 |
| 81. | Black Rock | 48.3% | 24.5%(+23.8)#81 | 16.9%(+31.4)#3,139 |
| 82. | Penasco | 47.3% | 24.5%(+22.8)#82 | 16.9%(+30.4)#3,254 |
| 83. | Tucumcari | 47.2% | 24.5%(+22.7)#83 | 16.9%(+30.3)#3,272 |
| 84. | Crouch Mesa | 47.1% | 24.5%(+22.6)#84 | 16.9%(+30.2)#3,277 |
| 85. | Moriarty | 47.0% | 24.5%(+22.5)#85 | 16.9%(+30.1)#3,304 |
| 86. | Mesilla | 46.4% | 24.5%(+21.9)#86 | 16.9%(+29.5)#3,362 |
| 87. | Anthony | 45.5% | 24.5%(+20.9)#87 | 16.9%(+28.6)#3,484 |
| 88. | Dixon | 45.5% | 24.5%(+20.9)#88 | 16.9%(+28.6)#3,488 |
| 89. | Las Vegas | 45.2% | 24.5%(+20.7)#89 | 16.9%(+28.3)#3,527 |
| 90. | Shiprock | 44.5% | 24.5%(+20.0)#90 | 16.9%(+27.6)#3,612 |
| 91. | Elida | 44.4% | 24.5%(+19.9)#91 | 16.9%(+27.5)#3,637 |
| 92. | Little Walnut | 44.0% | 24.5%(+19.5)#92 | 16.9%(+27.1)#3,691 |
| 93. | Meadow Lake | 43.8% | 24.5%(+19.3)#93 | 16.9%(+26.9)#3,712 |
| 94. | Chamita | 43.8% | 24.5%(+19.2)#94 | 16.9%(+26.8)#3,721 |
| 95. | Williams Acres | 43.4% | 24.5%(+18.9)#95 | 16.9%(+26.5)#3,776 |
| 96. | Jacona | 43.2% | 24.5%(+18.7)#96 | 16.9%(+26.3)#3,824 |
| 97. | Sanostee | 42.9% | 24.5%(+18.3)#97 | 16.9%(+26.0)#3,876 |
| 98. | Crownpoint | 42.8% | 24.5%(+18.3)#98 | 16.9%(+25.9)#3,899 |
| 99. | Truth Or Consequences | 42.4% | 24.5%(+17.9)#99 | 16.9%(+25.5)#3,941 |
| 100. | Ponderosa Pine | 42.0% | 24.5%(+17.5)#100 | 16.9%(+25.1)#3,996 |
Common Questions
What are the Top 10 Cities with the Highest Child Poverty Level Among Boys Under the Age of 16 in New Mexico?
Top 10 Cities with the Highest Child Poverty Level Among Boys Under the Age of 16 in New Mexico are:
#1
100.0%
#2
100.0%
#3
100.0%
#4
100.0%
#5
100.0%
#6
100.0%
#7
100.0%
#8
100.0%
#9
100.0%
#10
100.0%
What city has the Highest Child Poverty Level Among Boys Under the Age of 16 in New Mexico?
Berino has the Highest Child Poverty Level Among Boys Under the Age of 16 in New Mexico with 100.0%.
What is the Poverty Level Among Boys Under the Age of 16 in the State of New Mexico?
Poverty Level Among Boys Under the Age of 16 in New Mexico is 24.5%.
What is the Poverty Level Among Boys Under the Age of 16 in the United States?
Poverty Level Among Boys Under the Age of 16 in the United States is 16.9%.