Cities with the Highest Percentage of Indian (Asian) Population in Massachusetts
RELATED REPORTS & OPTIONS
Indian (Asian)
Massachusetts
Compare Cities
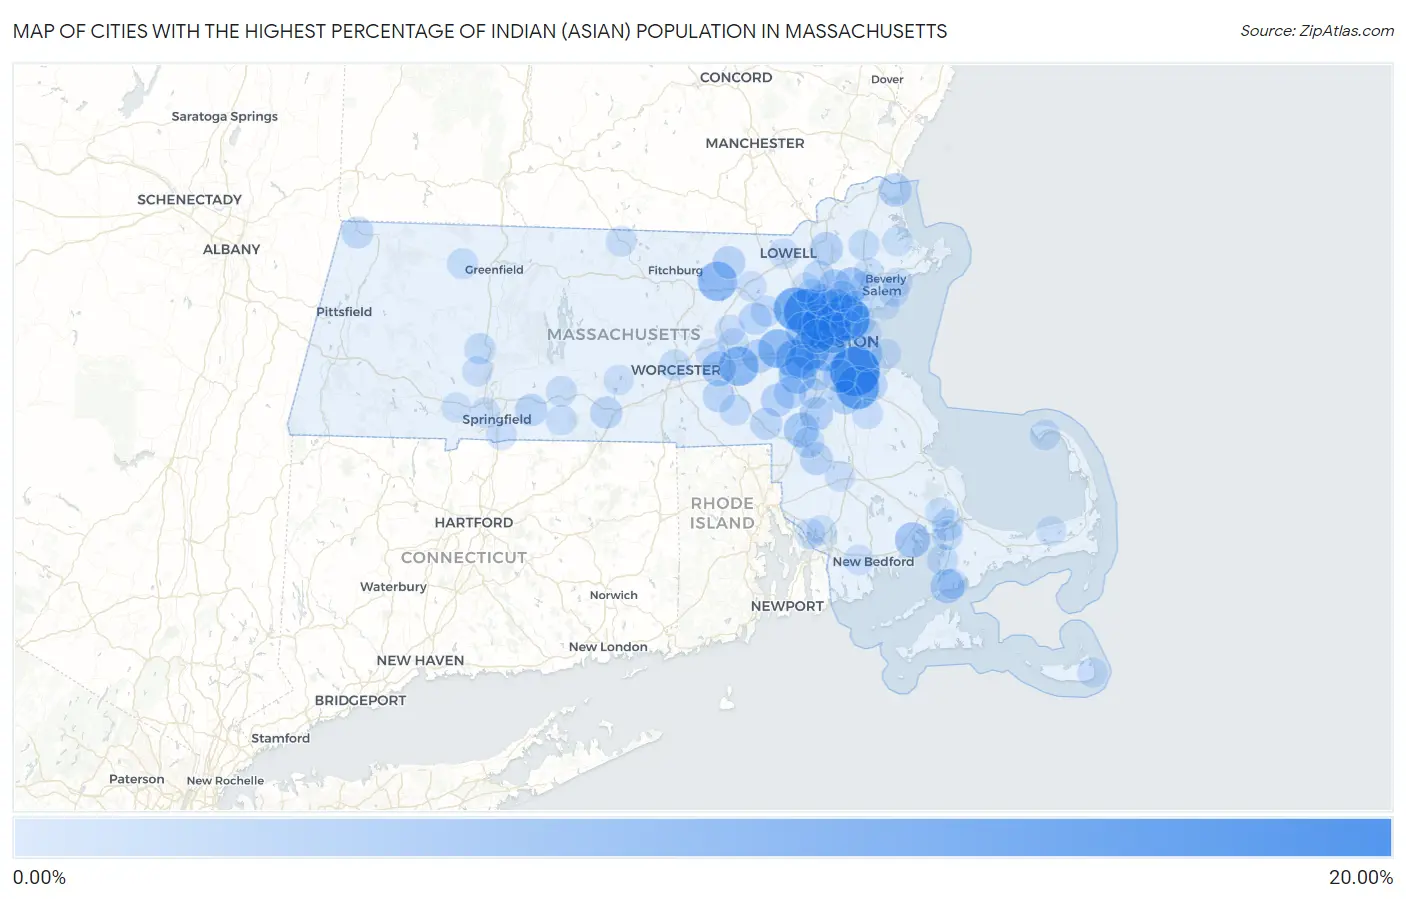
Map of Cities with the Highest Percentage of Indian (Asian) Population in Massachusetts
0.00%
20.00%
Cities with the Highest Percentage of Indian (Asian) Population in Massachusetts
| City | Indian (Asian) | vs State | vs National | |
| 1. | Quincy | 18.93% | 2.84%(+16.1)#1 | 1.61%(+17.3)#82 |
| 2. | Malden | 16.35% | 2.84%(+13.5)#2 | 1.61%(+14.7)#121 |
| 3. | Lexington | 16.34% | 2.84%(+13.5)#3 | 1.61%(+14.7)#123 |
| 4. | Braintree Town | 12.73% | 2.84%(+9.90)#4 | 1.61%(+11.1)#195 |
| 5. | Hanscom Afb | 12.11% | 2.84%(+9.27)#5 | 1.61%(+10.5)#217 |
| 6. | Winchester | 10.47% | 2.84%(+7.63)#6 | 1.61%(+8.86)#275 |
| 7. | Belmont | 10.02% | 2.84%(+7.18)#7 | 1.61%(+8.41)#303 |
| 8. | Brookline | 9.54% | 2.84%(+6.71)#8 | 1.61%(+7.94)#320 |
| 9. | Newton | 9.16% | 2.84%(+6.33)#9 | 1.61%(+7.55)#343 |
| 10. | Cordaville | 9.15% | 2.84%(+6.32)#10 | 1.61%(+7.55)#344 |
| 11. | Devens | 9.13% | 2.84%(+6.30)#11 | 1.61%(+7.52)#346 |
| 12. | Cambridge | 8.82% | 2.84%(+5.98)#12 | 1.61%(+7.21)#365 |
| 13. | Wellesley | 8.56% | 2.84%(+5.72)#13 | 1.61%(+6.95)#382 |
| 14. | Cochituate | 8.51% | 2.84%(+5.67)#14 | 1.61%(+6.90)#384 |
| 15. | Dover | 7.21% | 2.84%(+4.37)#15 | 1.61%(+5.60)#465 |
| 16. | Waltham | 6.22% | 2.84%(+3.38)#16 | 1.61%(+4.61)#564 |
| 17. | Amherst | 5.88% | 2.84%(+3.05)#17 | 1.61%(+4.27)#611 |
| 18. | Arlington | 5.59% | 2.84%(+2.75)#18 | 1.61%(+3.98)#646 |
| 19. | Lynnfield | 5.42% | 2.84%(+2.58)#19 | 1.61%(+3.81)#669 |
| 20. | Marion Center | 5.41% | 2.84%(+2.57)#20 | 1.61%(+3.80)#671 |
| 21. | Needham | 5.18% | 2.84%(+2.34)#21 | 1.61%(+3.57)#717 |
| 22. | Foxborough | 5.15% | 2.84%(+2.31)#22 | 1.61%(+3.54)#723 |
| 23. | Boston | 5.09% | 2.84%(+2.25)#23 | 1.61%(+3.48)#737 |
| 24. | Medford | 4.91% | 2.84%(+2.08)#24 | 1.61%(+3.30)#765 |
| 25. | Westborough | 4.86% | 2.84%(+2.03)#25 | 1.61%(+3.25)#772 |
| 26. | Melrose | 4.57% | 2.84%(+1.73)#26 | 1.61%(+2.96)#847 |
| 27. | Somerville | 4.24% | 2.84%(+1.41)#27 | 1.61%(+2.64)#911 |
| 28. | Falmouth | 4.20% | 2.84%(+1.36)#28 | 1.61%(+2.59)#921 |
| 29. | Randolph Town | 4.12% | 2.84%(+1.29)#29 | 1.61%(+2.51)#931 |
| 30. | Watertown Town | 3.99% | 2.84%(+1.15)#30 | 1.61%(+2.38)#969 |
| 31. | Reading | 3.95% | 2.84%(+1.12)#31 | 1.61%(+2.35)#977 |
| 32. | Sharon | 3.86% | 2.84%(+1.03)#32 | 1.61%(+2.25)#1,000 |
| 33. | Framingham | 3.85% | 2.84%(+1.02)#33 | 1.61%(+2.25)#1,006 |
| 34. | Milton | 3.79% | 2.84%(+0.957)#34 | 1.61%(+2.18)#1,021 |
| 35. | Salisbury | 3.68% | 2.84%(+0.846)#35 | 1.61%(+2.07)#1,052 |
| 36. | Andover | 3.55% | 2.84%(+0.710)#36 | 1.61%(+1.94)#1,089 |
| 37. | Millis Clicquot | 3.48% | 2.84%(+0.641)#37 | 1.61%(+1.87)#1,115 |
| 38. | Stoneham | 3.15% | 2.84%(+0.313)#38 | 1.61%(+1.54)#1,230 |
| 39. | Groton | 3.12% | 2.84%(+0.289)#39 | 1.61%(+1.52)#1,240 |
| 40. | Norton Center | 3.10% | 2.84%(+0.265)#40 | 1.61%(+1.49)#1,252 |
| 41. | Wilbraham | 2.87% | 2.84%(+0.030)#41 | 1.61%(+1.26)#1,354 |
| 42. | Medfield | 2.83% | 2.84%(-0.002)#42 | 1.61%(+1.22)#1,366 |
| 43. | Maynard | 2.71% | 2.84%(-0.127)#43 | 1.61%(+1.10)#1,440 |
| 44. | Upton | 2.66% | 2.84%(-0.178)#44 | 1.61%(+1.05)#1,475 |
| 45. | Weymouth Town | 2.60% | 2.84%(-0.235)#45 | 1.61%(+0.992)#1,505 |
| 46. | Franklin Town | 2.54% | 2.84%(-0.291)#46 | 1.61%(+0.936)#1,543 |
| 47. | Fiskdale | 2.51% | 2.84%(-0.324)#47 | 1.61%(+0.903)#1,570 |
| 48. | Woburn | 2.38% | 2.84%(-0.457)#48 | 1.61%(+0.770)#1,663 |
| 49. | Williamstown | 2.31% | 2.84%(-0.523)#49 | 1.61%(+0.703)#1,715 |
| 50. | Burlington | 2.27% | 2.84%(-0.562)#50 | 1.61%(+0.665)#1,742 |
| 51. | Wilmington | 2.15% | 2.84%(-0.688)#51 | 1.61%(+0.539)#1,826 |
| 52. | Everett | 2.06% | 2.84%(-0.775)#52 | 1.61%(+0.451)#1,888 |
| 53. | Wakefield | 1.99% | 2.84%(-0.843)#53 | 1.61%(+0.384)#1,951 |
| 54. | Mansfield Center | 1.92% | 2.84%(-0.911)#54 | 1.61%(+0.316)#2,025 |
| 55. | Northampton | 1.92% | 2.84%(-0.917)#55 | 1.61%(+0.310)#2,030 |
| 56. | Buzzards Bay | 1.87% | 2.84%(-0.964)#56 | 1.61%(+0.262)#2,074 |
| 57. | West Concord | 1.86% | 2.84%(-0.975)#57 | 1.61%(+0.252)#2,086 |
| 58. | North Falmouth | 1.86% | 2.84%(-0.980)#58 | 1.61%(+0.246)#2,092 |
| 59. | Revere | 1.75% | 2.84%(-1.09)#59 | 1.61%(+0.141)#2,207 |
| 60. | Worcester | 1.72% | 2.84%(-1.12)#60 | 1.61%(+0.109)#2,252 |
| 61. | Hopedale | 1.69% | 2.84%(-1.14)#61 | 1.61%(+0.083)#2,291 |
| 62. | Saugus | 1.59% | 2.84%(-1.25)#62 | 1.61%(-0.023)#2,415 |
| 63. | Shelburne Falls | 1.53% | 2.84%(-1.31)#63 | 1.61%(-0.078)#2,486 |
| 64. | Boxford | 1.44% | 2.84%(-1.40)#64 | 1.61%(-0.172)#2,639 |
| 65. | Palmer Town | 1.38% | 2.84%(-1.46)#65 | 1.61%(-0.232)#2,739 |
| 66. | Salem | 1.35% | 2.84%(-1.48)#66 | 1.61%(-0.257)#2,768 |
| 67. | Marlborough | 1.32% | 2.84%(-1.51)#67 | 1.61%(-0.287)#2,814 |
| 68. | Norwood | 1.30% | 2.84%(-1.53)#68 | 1.61%(-0.304)#2,838 |
| 69. | Abington | 1.26% | 2.84%(-1.58)#69 | 1.61%(-0.350)#2,922 |
| 70. | Provincetown | 1.22% | 2.84%(-1.61)#70 | 1.61%(-0.385)#2,995 |
| 71. | Dedham | 1.22% | 2.84%(-1.61)#71 | 1.61%(-0.388)#3,004 |
| 72. | Monson Center | 1.20% | 2.84%(-1.64)#72 | 1.61%(-0.413)#3,058 |
| 73. | Ocean Grove | 1.19% | 2.84%(-1.65)#73 | 1.61%(-0.420)#3,068 |
| 74. | Winchendon | 1.17% | 2.84%(-1.67)#74 | 1.61%(-0.443)#3,110 |
| 75. | Monument Beach | 1.16% | 2.84%(-1.68)#75 | 1.61%(-0.451)#3,124 |
| 76. | Winthrop Town | 1.16% | 2.84%(-1.68)#76 | 1.61%(-0.453)#3,125 |
| 77. | Teaticket | 1.15% | 2.84%(-1.68)#77 | 1.61%(-0.456)#3,136 |
| 78. | West Springfield Town | 1.09% | 2.84%(-1.74)#78 | 1.61%(-0.517)#3,277 |
| 79. | Littleton Common | 1.08% | 2.84%(-1.76)#79 | 1.61%(-0.529)#3,299 |
| 80. | Smith Mills | 1.08% | 2.84%(-1.76)#80 | 1.61%(-0.533)#3,309 |
| 81. | Longmeadow | 1.06% | 2.84%(-1.78)#81 | 1.61%(-0.551)#3,353 |
| 82. | Taunton | 1.04% | 2.84%(-1.79)#82 | 1.61%(-0.564)#3,388 |
| 83. | Lowell | 1.01% | 2.84%(-1.82)#83 | 1.61%(-0.594)#3,473 |
| 84. | Hudson | 1.01% | 2.84%(-1.82)#84 | 1.61%(-0.596)#3,478 |
| 85. | Easthampton Town | 0.97% | 2.84%(-1.87)#85 | 1.61%(-0.642)#3,602 |
| 86. | East Brookfield | 0.97% | 2.84%(-1.87)#86 | 1.61%(-0.642)#3,603 |
| 87. | Northborough | 0.96% | 2.84%(-1.88)#87 | 1.61%(-0.650)#3,624 |
| 88. | Peabody | 0.93% | 2.84%(-1.91)#88 | 1.61%(-0.681)#3,714 |
| 89. | North Attleborough | 0.90% | 2.84%(-1.94)#89 | 1.61%(-0.711)#3,810 |
| 90. | Ipswich | 0.88% | 2.84%(-1.95)#90 | 1.61%(-0.726)#3,856 |
| 91. | Siasconset | 0.87% | 2.84%(-1.97)#91 | 1.61%(-0.739)#3,900 |
| 92. | Pinehurst | 0.79% | 2.84%(-2.04)#92 | 1.61%(-0.815)#4,144 |
| 93. | Swampscott | 0.79% | 2.84%(-2.04)#93 | 1.61%(-0.815)#4,147 |
| 94. | Westfield | 0.77% | 2.84%(-2.06)#94 | 1.61%(-0.837)#4,226 |
| 95. | Beverly | 0.76% | 2.84%(-2.07)#95 | 1.61%(-0.847)#4,253 |
| 96. | East Dennis | 0.75% | 2.84%(-2.08)#96 | 1.61%(-0.854)#4,270 |
| 97. | Hull | 0.75% | 2.84%(-2.08)#97 | 1.61%(-0.857)#4,281 |
| 98. | Danvers | 0.74% | 2.84%(-2.10)#98 | 1.61%(-0.871)#4,326 |
| 99. | Somerset | 0.70% | 2.84%(-2.14)#99 | 1.61%(-0.913)#4,477 |
| 100. | White Island Shores | 0.67% | 2.84%(-2.16)#100 | 1.61%(-0.934)#4,551 |
Common Questions
What are the Top 10 Cities with the Highest Percentage of Indian (Asian) Population in Massachusetts?
Top 10 Cities with the Highest Percentage of Indian (Asian) Population in Massachusetts are:
#1
18.93%
#2
16.35%
#3
16.34%
#4
12.73%
#5
12.11%
#6
10.47%
#7
10.02%
#8
9.54%
#9
9.16%
#10
9.15%
What city has the Highest Percentage of Indian (Asian) Population in Massachusetts?
Quincy has the Highest Percentage of Indian (Asian) Population in Massachusetts with 18.93%.
What is the Percentage of Indian (Asian) Population in the State of Massachusetts?
Percentage of Indian (Asian) Population in Massachusetts is 2.84%.
What is the Percentage of Indian (Asian) Population in the United States?
Percentage of Indian (Asian) Population in the United States is 1.61%.