Cities with the Highest Percentage of Indian (Asian) Population in Idaho

RELATED REPORTS & OPTIONS

Indian (Asian)
Population
Families and Households
Female Fertility
Female Fertility (Unmarried)
Race (Community Size)
Race (Percentage)
Ancestry (Community Size)
AfghanAfricanAlaska NativeAlaskan AthabascanAlbanianAleutAlsatianAmericanApacheArabArapahoArgentineanArmenianAssyrian / Chaldean / SyriacAustralianAustrianBahamianBangladeshiBarbadianBasqueBelgianBelizeanBermudanBhutaneseBlackfeetBolivianBrazilianBritishBritish West IndianBulgarianBurmeseCajunCambodianCanadianCape VerdeanCarpatho RusynCelticCentral AmericanCentral American IndianCherokeeCheyenneChickasawChileanChineseChippewaChoctawColombianColvilleComancheCosta RicanCreeCreekCroatianCrowCubanCypriotCzechCzechoslovakianDanishDelawareDominicanDutchDutch West IndianEastern EuropeanEcuadorianEgyptianEnglishEstonianEthiopianEuropeanFijianFilipinoFinnishFrenchFrench American IndianFrench CanadianGermanGerman RussianGhanaianGreekGuamanian / ChamorroGuatemalanGuyaneseHaitianHmongHonduranHopiHoumaHungarianIcelanderIndian (Asian)IndonesianInupiatIranianIraqiIrishIroquoisIsraeliItalianJamaicanJapaneseJordanianKenyanKiowaKoreanLaotianLatvianLebaneseLiberianLithuanianLumbeeLuxembourgerMacedonianMalaysianMalteseMarshalleseMenomineeMexicanMexican American IndianMongolianMoroccanNative HawaiianNavajoNepaleseNew ZealanderNicaraguanNigerianNorthern EuropeanNorwegianOkinawanOsageOttawaPaiutePakistaniPalestinianPanamanianParaguayanPennsylvania GermanPeruvianPimaPolishPortuguesePotawatomiPuebloPuerto RicanPuget Sound SalishRomanianRussianSalvadoranSamoanScandinavianScotch-IrishScottishSeminoleSenegaleseSerbianShoshoneSierra LeoneanSiouxSlavicSlovakSloveneSomaliSouth AfricanSouth AmericanSouth American IndianSoviet UnionSpaniardSpanishSpanish AmericanSpanish American IndianSri LankanSubsaharan AfricanSudaneseSwedishSwissSyrianTaiwaneseThaiTlingit-HaidaTohono O'OdhamTonganTrinidadian and TobagonianTsimshianTurkishU.S. Virgin IslanderUgandanUkrainianUruguayanUteVenezuelanVietnameseWelshWest IndianYakamaYaquiYugoslavianYumanYup'ikZimbabwean
Ancestry (Percentage)
AfghanAfricanAlaska NativeAlaskan AthabascanAlbanianAleutAlsatianAmericanApacheArabArapahoArgentineanArmenianAssyrian / Chaldean / SyriacAustralianAustrianBahamianBangladeshiBarbadianBasqueBelgianBelizeanBermudanBhutaneseBlackfeetBolivianBrazilianBritishBritish West IndianBulgarianBurmeseCajunCambodianCanadianCape VerdeanCarpatho RusynCelticCentral AmericanCentral American IndianCherokeeCheyenneChickasawChileanChineseChippewaChoctawColombianColvilleComancheCosta RicanCreeCreekCroatianCrowCubanCypriotCzechCzechoslovakianDanishDelawareDominicanDutchDutch West IndianEastern EuropeanEcuadorianEgyptianEnglishEstonianEthiopianEuropeanFijianFilipinoFinnishFrenchFrench American IndianFrench CanadianGermanGerman RussianGhanaianGreekGuamanian / ChamorroGuatemalanGuyaneseHaitianHmongHonduranHopiHoumaHungarianIcelanderIndian (Asian)IndonesianInupiatIranianIraqiIrishIroquoisIsraeliItalianJamaicanJapaneseJordanianKenyanKiowaKoreanLaotianLatvianLebaneseLiberianLithuanianLumbeeLuxembourgerMacedonianMalaysianMalteseMarshalleseMenomineeMexicanMexican American IndianMongolianMoroccanNative HawaiianNavajoNepaleseNew ZealanderNicaraguanNigerianNorthern EuropeanNorwegianOkinawanOsageOttawaPaiutePakistaniPalestinianPanamanianParaguayanPennsylvania GermanPeruvianPimaPolishPortuguesePotawatomiPuebloPuerto RicanPuget Sound SalishRomanianRussianSalvadoranSamoanScandinavianScotch-IrishScottishSeminoleSenegaleseSerbianShoshoneSierra LeoneanSiouxSlavicSlovakSloveneSomaliSouth AfricanSouth AmericanSouth American IndianSoviet UnionSpaniardSpanishSpanish AmericanSpanish American IndianSri LankanSubsaharan AfricanSudaneseSwedishSwissSyrianTaiwaneseThaiTlingit-HaidaTohono O'OdhamTonganTrinidadian and TobagonianTsimshianTurkishU.S. Virgin IslanderUgandanUkrainianUruguayanUteVenezuelanVietnameseWelshWest IndianYakamaYaquiYugoslavianYumanYup'ikZimbabwean
Immigrant Origin (Total)
AfghanistanAfricaAlbaniaArgentinaArmeniaAsiaAustraliaAustriaAzoresBahamasBangladeshBarbadosBelarusBelgiumBelizeBoliviaBosnia and HerzegovinaBrazilBulgariaBurma / MyanmarCabo VerdeCambodiaCameroonCanadaCaribbeanCentral AmericaChileChinaColombiaCongoCosta RicaCroatiaCubaCzechoslovakiaDenmarkDominicaDominican RepublicEastern AfricaEastern AsiaEastern EuropeEcuadorEgyptEl SalvadorEnglandEritreaEthiopiaEuropeFijiFranceGermanyGhanaGreeceGrenadaGuatemalaGuyanaHaitiHondurasHong KongHungaryIndiaIndonesiaIranIraqIrelandIsraelItalyJamaicaJapanJordanKazakhstanKenyaKoreaKuwaitLaosLatin AmericaLatviaLebanonLiberiaLithuaniaMalaysiaMexicoMicronesiaMiddle AfricaMoldovaMoroccoNepalNetherlandsNicaraguaNigeriaNorth MacedoniaNorthern AfricaNorthern EuropeNorwayOceaniaPakistanPanamaPeruPhilippinesPolandPortugalRomaniaRussiaSaudi ArabiaScotlandSenegalSerbiaSierra LeoneSingaporeSomaliaSouth AfricaSouth AmericaSouth Central AsiaSouth Eastern AsiaSouthern EuropeSpainSri LankaSt. Vincent and the GrenadinesSudanSwedenSwitzerlandSyriaTaiwanThailandTrinidad and TobagoTurkeyUgandaUkraineUruguayUzbekistanVenezuelaVietnamWest IndiesWestern AfricaWestern AsiaWestern EuropeYemenZaireZimbabwe
Immigrant Origin (Percentage)
AfghanistanAfricaAlbaniaArgentinaArmeniaAsiaAustraliaAustriaAzoresBahamasBangladeshBarbadosBelarusBelgiumBelizeBoliviaBosnia and HerzegovinaBrazilBulgariaBurma / MyanmarCabo VerdeCambodiaCameroonCanadaCaribbeanCentral AmericaChileChinaColombiaCongoCosta RicaCroatiaCubaCzechoslovakiaDenmarkDominicaDominican RepublicEastern AfricaEastern AsiaEastern EuropeEcuadorEgyptEl SalvadorEnglandEritreaEthiopiaEuropeFijiFranceGermanyGhanaGreeceGrenadaGuatemalaGuyanaHaitiHondurasHong KongHungaryIndiaIndonesiaIranIraqIrelandIsraelItalyJamaicaJapanJordanKazakhstanKenyaKoreaKuwaitLaosLatin AmericaLatviaLebanonLiberiaLithuaniaMalaysiaMexicoMicronesiaMiddle AfricaMoldovaMoroccoNepalNetherlandsNicaraguaNigeriaNorth MacedoniaNorthern AfricaNorthern EuropeNorwayOceaniaPakistanPanamaPeruPhilippinesPolandPortugalRomaniaRussiaSaudi ArabiaScotlandSenegalSerbiaSierra LeoneSingaporeSomaliaSouth AfricaSouth AmericaSouth Central AsiaSouth Eastern AsiaSouthern EuropeSpainSri LankaSt. Vincent and the GrenadinesSudanSwedenSwitzerlandSyriaTaiwanThailandTrinidad and TobagoTurkeyUgandaUkraineUruguayUzbekistanVenezuelaVietnamWest IndiesWestern AfricaWestern AsiaWestern EuropeYemenZaireZimbabwe
Income
Income (Families)
Income (Households)
Poverty
Poverty (Families)
Unemployment
Employment Occupations
Employment Industries
Employer Class
Commute Time
Commute Means
School Enrollment
Education by Degree Field
Occupancy
Finances
Physical Characteristics
Idaho
Compare Cities
Comparison Subject

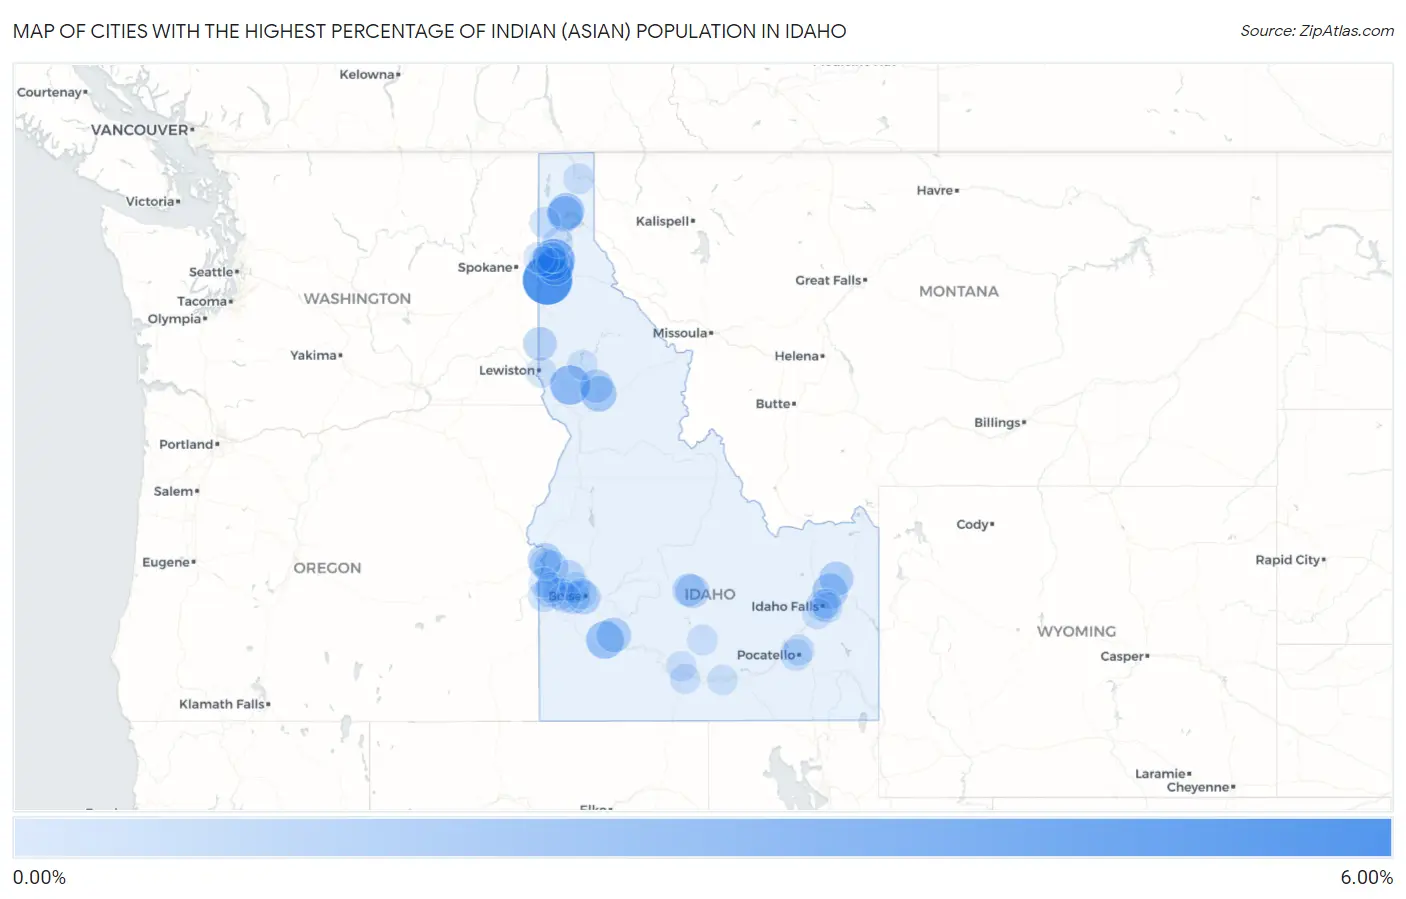
Map of Cities with the Highest Percentage of Indian (Asian) Population in Idaho

0.00%
6.00%
Cities with the Highest Percentage of Indian (Asian) Population in Idaho Map

Cities with the Highest Percentage of Indian (Asian) Population in Idaho

City Indian (Asian) vs State vs National
1.Rockford Bay5.88%0.42%(+5.46)#11.61%(+4.27)#609
2.Dalton Gardens3.55%0.42%(+3.13)#21.61%(+1.94)#1,090
3.Craigmont2.79%0.42%(+2.37)#31.61%(+1.19)#1,388
4.Fernan Lake Village2.22%0.42%(+1.80)#41.61%(+0.613)#1,773
5.Mountain Home Afb2.20%0.42%(+1.78)#51.61%(+0.590)#1,788
6.Ponderay1.82%0.42%(+1.40)#61.61%(+0.212)#2,128
7.Kooskia1.64%0.42%(+1.22)#71.61%(+0.036)#2,351
8.Sandpoint1.60%0.42%(+1.18)#81.61%(-0.013)#2,406
9.Rigby1.55%0.42%(+1.13)#91.61%(-0.059)#2,457
10.Mountain Home1.32%0.42%(+0.902)#101.61%(-0.286)#2,809
11.Rexburg1.20%0.42%(+0.783)#111.61%(-0.405)#3,041
12.New Plymouth1.16%0.42%(+0.735)#121.61%(-0.454)#3,129
13.Payette1.12%0.42%(+0.704)#131.61%(-0.484)#3,194
14.Boise City1.05%0.42%(+0.627)#141.61%(-0.562)#3,380
15.Sun Valley1.01%0.42%(+0.592)#151.61%(-0.596)#3,483
16.Moscow1.00%0.42%(+0.575)#161.61%(-0.613)#3,522
17.Kamiah0.99%0.42%(+0.571)#171.61%(-0.617)#3,535
18.Meridian0.85%0.42%(+0.427)#181.61%(-0.761)#3,972
19.Ketchum0.80%0.42%(+0.382)#191.61%(-0.806)#4,125
20.Emmett0.65%0.42%(+0.229)#201.61%(-0.959)#4,656
21.Caldwell0.56%0.42%(+0.143)#211.61%(-1.05)#5,057
22.Coeur D Alene0.56%0.42%(+0.138)#221.61%(-1.05)#5,081
23.Idaho Falls0.52%0.42%(+0.096)#231.61%(-1.09)#5,287
24.Greenleaf0.50%0.42%(+0.082)#241.61%(-1.11)#5,348
25.Pocatello0.45%0.42%(+0.027)#251.61%(-1.16)#5,644
26.Fruitland0.39%0.42%(-0.031)#261.61%(-1.22)#6,000
27.Homedale0.38%0.42%(-0.044)#271.61%(-1.23)#6,091
28.Eagle0.38%0.42%(-0.045)#281.61%(-1.23)#6,095
29.Garden City0.30%0.42%(-0.120)#291.61%(-1.31)#6,562
30.Chubbuck0.28%0.42%(-0.139)#301.61%(-1.33)#6,674
31.Priest River0.28%0.42%(-0.144)#311.61%(-1.33)#6,712
32.Hayden Lake0.26%0.42%(-0.161)#321.61%(-1.35)#6,828
33.Hauser0.21%0.42%(-0.207)#331.61%(-1.39)#7,167
34.Ammon0.21%0.42%(-0.208)#341.61%(-1.40)#7,177
35.Richfield0.20%0.42%(-0.224)#351.61%(-1.41)#7,290
36.Nampa0.19%0.42%(-0.226)#361.61%(-1.41)#7,305
37.Shelley0.18%0.42%(-0.236)#371.61%(-1.42)#7,384
38.Lewiston0.16%0.42%(-0.260)#381.61%(-1.45)#7,568
39.Notus0.16%0.42%(-0.262)#391.61%(-1.45)#7,587
40.Bonners Ferry0.16%0.42%(-0.264)#401.61%(-1.45)#7,603
41.Burley0.14%0.42%(-0.281)#411.61%(-1.47)#7,731
42.Athol0.13%0.42%(-0.294)#421.61%(-1.48)#7,830
43.Orofino0.092%0.42%(-0.328)#431.61%(-1.52)#8,051
44.Lincoln0.082%0.42%(-0.338)#441.61%(-1.53)#8,119
45.Jerome0.080%0.42%(-0.340)#451.61%(-1.53)#8,137
46.Twin Falls0.059%0.42%(-0.361)#461.61%(-1.55)#8,268
47.Hayden0.057%0.42%(-0.363)#471.61%(-1.55)#8,279
48.Parma0.052%0.42%(-0.369)#481.61%(-1.56)#8,317
49.Post Falls0.0075%0.42%(-0.413)#491.61%(-1.60)#8,517

Common Questions

What are the Top 10 Cities with the Highest Percentage of Indian (Asian) Population in Idaho?
Top 10 Cities with the Highest Percentage of Indian (Asian) Population in Idaho are:
What city has the Highest Percentage of Indian (Asian) Population in Idaho?
Rockford Bay has the Highest Percentage of Indian (Asian) Population in Idaho with 5.88%.
What is the Percentage of Indian (Asian) Population in the State of Idaho?
Percentage of Indian (Asian) Population in Idaho is 0.42%.
What is the Percentage of Indian (Asian) Population in the United States?
Percentage of Indian (Asian) Population in the United States is 1.61%.