Cities with the Highest Percentage of Indian (Asian) Population in Virginia
RELATED REPORTS & OPTIONS
Indian (Asian)
Virginia
Compare Cities
Map of Cities with the Highest Percentage of Indian (Asian) Population in Virginia
0.00%
25.00%
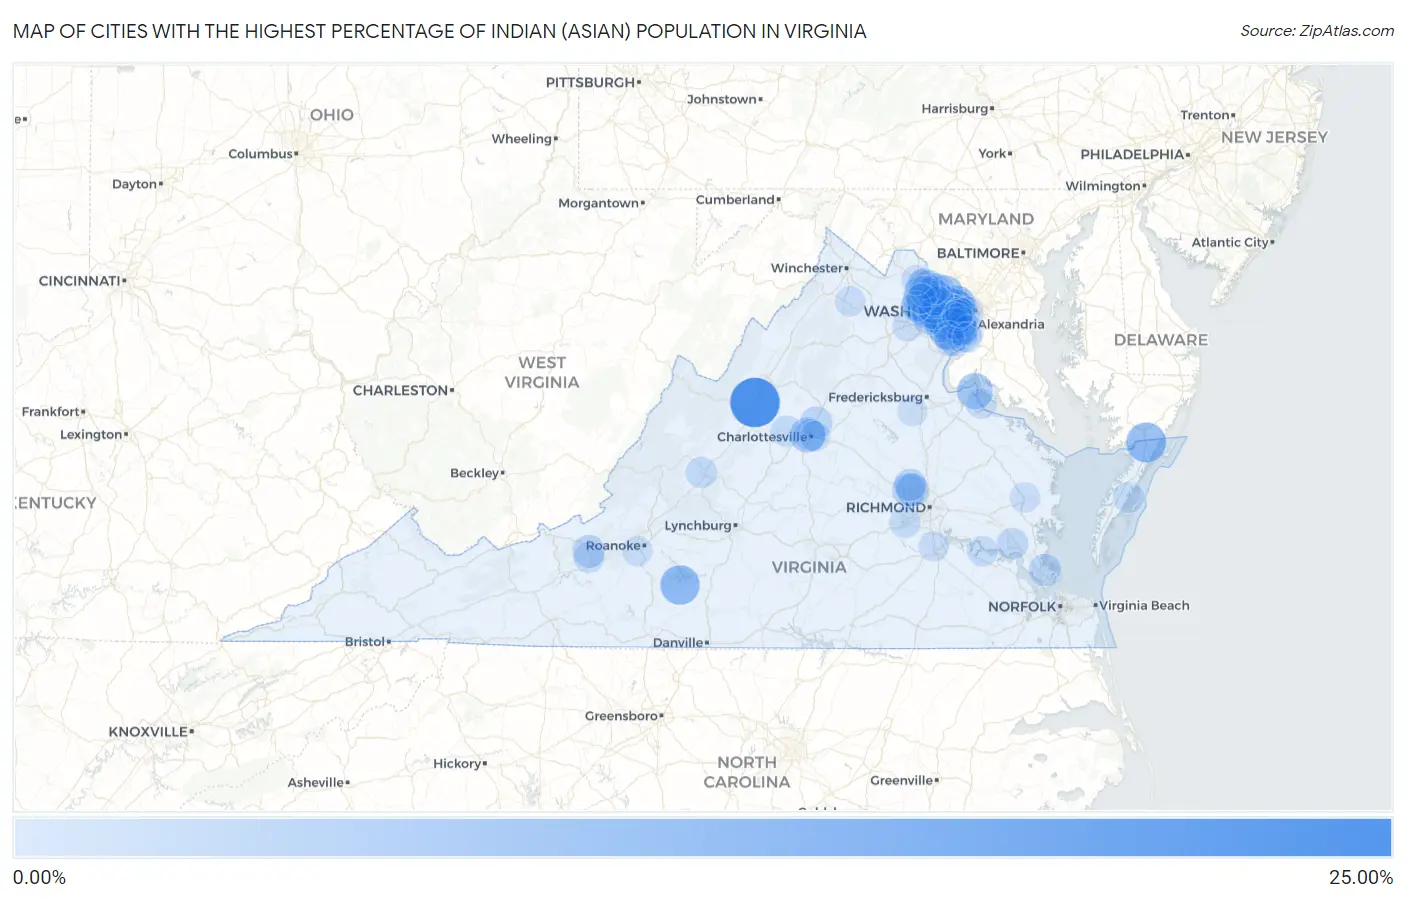
Cities with the Highest Percentage of Indian (Asian) Population in Virginia
| City | Indian (Asian) | vs State | vs National | |
| 1. | Mount Sidney | 20.36% | 1.12%(+19.2)#1 | 1.61%(+18.7)#64 |
| 2. | Sully Square | 13.52% | 1.12%(+12.4)#2 | 1.61%(+11.9)#177 |
| 3. | Navy | 11.38% | 1.12%(+10.3)#3 | 1.61%(+9.77)#240 |
| 4. | New Church | 10.68% | 1.12%(+9.55)#4 | 1.61%(+9.07)#264 |
| 5. | Penhook | 10.22% | 1.12%(+9.09)#5 | 1.61%(+8.61)#288 |
| 6. | Great Falls Crossing | 9.71% | 1.12%(+8.59)#6 | 1.61%(+8.10)#314 |
| 7. | Mclean | 9.63% | 1.12%(+8.50)#7 | 1.61%(+8.02)#317 |
| 8. | Pimmit Hills | 9.29% | 1.12%(+8.17)#8 | 1.61%(+7.68)#336 |
| 9. | Tysons | 8.56% | 1.12%(+7.44)#9 | 1.61%(+6.95)#381 |
| 10. | Fair Oaks | 7.62% | 1.12%(+6.50)#10 | 1.61%(+6.01)#438 |
| 11. | Great Falls | 7.57% | 1.12%(+6.45)#11 | 1.61%(+5.96)#441 |
| 12. | Dahlgren Center | 7.19% | 1.12%(+6.07)#12 | 1.61%(+5.58)#467 |
| 13. | Floris | 7.13% | 1.12%(+6.01)#13 | 1.61%(+5.52)#472 |
| 14. | South Run | 6.97% | 1.12%(+5.85)#14 | 1.61%(+5.37)#482 |
| 15. | Oakton | 6.55% | 1.12%(+5.43)#15 | 1.61%(+4.94)#519 |
| 16. | University Of Virginia | 6.21% | 1.12%(+5.09)#16 | 1.61%(+4.60)#565 |
| 17. | George Mason | 5.96% | 1.12%(+4.84)#17 | 1.61%(+4.35)#595 |
| 18. | Moorefield | 5.94% | 1.12%(+4.81)#18 | 1.61%(+4.33)#599 |
| 19. | Kings Park | 5.92% | 1.12%(+4.80)#19 | 1.61%(+4.31)#602 |
| 20. | Wolf Trap | 5.22% | 1.12%(+4.10)#20 | 1.61%(+3.61)#711 |
| 21. | Long Branch | 4.89% | 1.12%(+3.76)#21 | 1.61%(+3.28)#769 |
| 22. | Arcola | 4.88% | 1.12%(+3.76)#22 | 1.61%(+3.27)#770 |
| 23. | Innovation | 4.75% | 1.12%(+3.63)#23 | 1.61%(+3.14)#801 |
| 24. | Vienna | 4.69% | 1.12%(+3.57)#24 | 1.61%(+3.09)#807 |
| 25. | Kings Park West | 4.59% | 1.12%(+3.46)#25 | 1.61%(+2.98)#839 |
| 26. | Dunn Loring | 4.51% | 1.12%(+3.39)#26 | 1.61%(+2.90)#863 |
| 27. | Short Pump | 4.49% | 1.12%(+3.37)#27 | 1.61%(+2.88)#870 |
| 28. | Chantilly | 4.40% | 1.12%(+3.27)#28 | 1.61%(+2.79)#883 |
| 29. | South Riding | 4.35% | 1.12%(+3.23)#29 | 1.61%(+2.74)#894 |
| 30. | Springfield | 4.31% | 1.12%(+3.19)#30 | 1.61%(+2.70)#903 |
| 31. | Belmont | 4.12% | 1.12%(+2.99)#31 | 1.61%(+2.51)#933 |
| 32. | Innsbrook | 4.03% | 1.12%(+2.91)#32 | 1.61%(+2.43)#953 |
| 33. | Seven Corners | 4.01% | 1.12%(+2.89)#33 | 1.61%(+2.41)#960 |
| 34. | Idylwood | 4.01% | 1.12%(+2.89)#34 | 1.61%(+2.41)#961 |
| 35. | Fair Lakes | 3.98% | 1.12%(+2.86)#35 | 1.61%(+2.37)#974 |
| 36. | Blacksburg | 3.90% | 1.12%(+2.78)#36 | 1.61%(+2.29)#987 |
| 37. | Mantua | 3.89% | 1.12%(+2.77)#37 | 1.61%(+2.28)#991 |
| 38. | Franconia | 3.76% | 1.12%(+2.64)#38 | 1.61%(+2.15)#1,027 |
| 39. | Burke | 3.72% | 1.12%(+2.59)#39 | 1.61%(+2.11)#1,038 |
| 40. | Broadlands | 3.60% | 1.12%(+2.48)#40 | 1.61%(+1.99)#1,076 |
| 41. | Wyndham | 3.59% | 1.12%(+2.47)#41 | 1.61%(+1.98)#1,078 |
| 42. | Bethel Manor | 3.51% | 1.12%(+2.38)#42 | 1.61%(+1.90)#1,103 |
| 43. | Merrifield | 3.49% | 1.12%(+2.37)#43 | 1.61%(+1.88)#1,109 |
| 44. | Lowes Island | 3.47% | 1.12%(+2.35)#44 | 1.61%(+1.86)#1,116 |
| 45. | Fairfax | 3.46% | 1.12%(+2.34)#45 | 1.61%(+1.85)#1,120 |
| 46. | Lorton | 3.44% | 1.12%(+2.31)#46 | 1.61%(+1.83)#1,130 |
| 47. | Hollymead | 3.39% | 1.12%(+2.26)#47 | 1.61%(+1.78)#1,146 |
| 48. | Fairfax Station | 3.32% | 1.12%(+2.19)#48 | 1.61%(+1.71)#1,175 |
| 49. | University Center | 3.22% | 1.12%(+2.10)#49 | 1.61%(+1.61)#1,207 |
| 50. | Franklin Farm | 3.20% | 1.12%(+2.08)#50 | 1.61%(+1.59)#1,211 |
| 51. | Charlottesville | 3.13% | 1.12%(+2.00)#51 | 1.61%(+1.52)#1,238 |
| 52. | Dranesville | 3.09% | 1.12%(+1.97)#52 | 1.61%(+1.48)#1,256 |
| 53. | Leesylvania | 3.07% | 1.12%(+1.94)#53 | 1.61%(+1.46)#1,266 |
| 54. | Arlington | 2.91% | 1.12%(+1.78)#54 | 1.61%(+1.30)#1,336 |
| 55. | Williamsburg | 2.89% | 1.12%(+1.76)#55 | 1.61%(+1.28)#1,345 |
| 56. | Centreville | 2.87% | 1.12%(+1.75)#56 | 1.61%(+1.26)#1,351 |
| 57. | Mcnair | 2.74% | 1.12%(+1.62)#57 | 1.61%(+1.14)#1,418 |
| 58. | Lincolnia | 2.74% | 1.12%(+1.62)#58 | 1.61%(+1.13)#1,422 |
| 59. | North Springfield | 2.67% | 1.12%(+1.55)#59 | 1.61%(+1.07)#1,462 |
| 60. | Brambleton | 2.66% | 1.12%(+1.54)#60 | 1.61%(+1.05)#1,473 |
| 61. | Lexington | 2.63% | 1.12%(+1.50)#61 | 1.61%(+1.02)#1,486 |
| 62. | Woodburn | 2.53% | 1.12%(+1.41)#62 | 1.61%(+0.921)#1,557 |
| 63. | Kingstowne | 2.52% | 1.12%(+1.39)#63 | 1.61%(+0.909)#1,568 |
| 64. | Crozet | 2.48% | 1.12%(+1.36)#64 | 1.61%(+0.876)#1,592 |
| 65. | Brandermill | 2.45% | 1.12%(+1.33)#65 | 1.61%(+0.841)#1,607 |
| 66. | Reston | 2.44% | 1.12%(+1.31)#66 | 1.61%(+0.828)#1,613 |
| 67. | Greenbriar | 2.29% | 1.12%(+1.17)#67 | 1.61%(+0.682)#1,727 |
| 68. | Dulles Town Center | 2.28% | 1.12%(+1.15)#68 | 1.61%(+0.669)#1,740 |
| 69. | Wachapreague | 2.22% | 1.12%(+1.10)#69 | 1.61%(+0.613)#1,772 |
| 70. | Difficult Run | 2.18% | 1.12%(+1.05)#70 | 1.61%(+0.567)#1,807 |
| 71. | Rio | 2.17% | 1.12%(+1.04)#71 | 1.61%(+0.558)#1,816 |
| 72. | Goose Creek | 2.14% | 1.12%(+1.02)#72 | 1.61%(+0.535)#1,834 |
| 73. | Herndon | 2.14% | 1.12%(+1.02)#73 | 1.61%(+0.534)#1,836 |
| 74. | Merrimac | 2.06% | 1.12%(+0.936)#74 | 1.61%(+0.451)#1,889 |
| 75. | Ravensworth | 1.99% | 1.12%(+0.868)#75 | 1.61%(+0.383)#1,953 |
| 76. | Rose Hill Cdp Fairfax County | 1.99% | 1.12%(+0.867)#76 | 1.61%(+0.382)#1,956 |
| 77. | Lansdowne | 1.95% | 1.12%(+0.832)#77 | 1.61%(+0.346)#1,997 |
| 78. | Claremont | 1.90% | 1.12%(+0.777)#78 | 1.61%(+0.291)#2,047 |
| 79. | One Loudoun | 1.87% | 1.12%(+0.748)#79 | 1.61%(+0.262)#2,073 |
| 80. | Cascades | 1.85% | 1.12%(+0.726)#80 | 1.61%(+0.241)#2,097 |
| 81. | Colonial Beach | 1.85% | 1.12%(+0.725)#81 | 1.61%(+0.240)#2,099 |
| 82. | Pantops | 1.84% | 1.12%(+0.715)#82 | 1.61%(+0.229)#2,112 |
| 83. | Ashburn | 1.79% | 1.12%(+0.669)#83 | 1.61%(+0.183)#2,162 |
| 84. | Colonial Heights | 1.77% | 1.12%(+0.650)#84 | 1.61%(+0.165)#2,178 |
| 85. | Stone Ridge | 1.74% | 1.12%(+0.615)#85 | 1.61%(+0.130)#2,226 |
| 86. | Shenandoah Shores | 1.73% | 1.12%(+0.603)#86 | 1.61%(+0.118)#2,240 |
| 87. | Gainesville | 1.70% | 1.12%(+0.574)#87 | 1.61%(+0.088)#2,285 |
| 88. | Saluda | 1.69% | 1.12%(+0.569)#88 | 1.61%(+0.084)#2,290 |
| 89. | Annandale | 1.69% | 1.12%(+0.566)#89 | 1.61%(+0.080)#2,293 |
| 90. | Occoquan | 1.68% | 1.12%(+0.556)#90 | 1.61%(+0.070)#2,305 |
| 91. | Groveton | 1.68% | 1.12%(+0.553)#91 | 1.61%(+0.067)#2,309 |
| 92. | Cave Spring | 1.64% | 1.12%(+0.514)#92 | 1.61%(+0.029)#2,364 |
| 93. | Fort Belvoir | 1.61% | 1.12%(+0.489)#93 | 1.61%(+0.004)#2,393 |
| 94. | West Falls Church | 1.60% | 1.12%(+0.480)#94 | 1.61%(-0.005)#2,398 |
| 95. | Crosspointe | 1.56% | 1.12%(+0.441)#95 | 1.61%(-0.044)#2,443 |
| 96. | Falls Church | 1.50% | 1.12%(+0.372)#96 | 1.61%(-0.113)#2,543 |
| 97. | Spotsylvania Courthouse | 1.48% | 1.12%(+0.359)#97 | 1.61%(-0.126)#2,559 |
| 98. | Mount Vernon | 1.45% | 1.12%(+0.328)#98 | 1.61%(-0.158)#2,615 |
| 99. | Leesburg | 1.45% | 1.12%(+0.325)#99 | 1.61%(-0.160)#2,621 |
| 100. | Loudoun Valley Estates | 1.42% | 1.12%(+0.294)#100 | 1.61%(-0.192)#2,673 |
Common Questions
What are the Top 10 Cities with the Highest Percentage of Indian (Asian) Population in Virginia?
Top 10 Cities with the Highest Percentage of Indian (Asian) Population in Virginia are:
#1
20.36%
#2
10.68%
#3
10.22%
#4
9.63%
#5
9.29%
#6
8.56%
#7
7.62%
#8
7.57%
#9
7.19%
#10
7.13%
What city has the Highest Percentage of Indian (Asian) Population in Virginia?
Mount Sidney has the Highest Percentage of Indian (Asian) Population in Virginia with 20.36%.
What is the Percentage of Indian (Asian) Population in the State of Virginia?
Percentage of Indian (Asian) Population in Virginia is 1.12%.
What is the Percentage of Indian (Asian) Population in the United States?
Percentage of Indian (Asian) Population in the United States is 1.61%.