Bellingham, WA Map & Demographics
Bellingham Map
Bellingham Overview
$40,287
PER CAPITA INCOME
$100,228
AVG FAMILY INCOME
$64,026
AVG HOUSEHOLD INCOME
27.3%
WAGE / INCOME GAP [ % ]
72.7¢/ $1
WAGE / INCOME GAP [ $ ]
$9,486
FAMILY INCOME DEFICIT
0.47
INEQUALITY / GINI INDEX
91,353
TOTAL POPULATION
44,130
MALE POPULATION
47,223
FEMALE POPULATION
93.45
MALES / 100 FEMALES
107.01
FEMALES / 100 MALES
33.7
MEDIAN AGE
2.8
AVG FAMILY SIZE
2.2
AVG HOUSEHOLD SIZE
52,467
LABOR FORCE [ PEOPLE ]
65.3%
PERCENT IN LABOR FORCE
4.8%
UNEMPLOYMENT RATE
Bellingham Area Codes
Income in Bellingham
Income Overview in Bellingham
Per Capita Income in Bellingham is $40,287, while median incomes of families and households are $100,228 and $64,026 respectively.
| Characteristic | Number | Measure |
| Per Capita Income | 91,353 | $40,287 |
| Median Family Income | 18,151 | $100,228 |
| Mean Family Income | 18,151 | $123,061 |
| Median Household Income | 40,085 | $64,026 |
| Mean Household Income | 40,085 | $89,546 |
| Income Deficit | 18,151 | $9,486 |
| Wage / Income Gap (%) | 91,353 | 27.34% |
| Wage / Income Gap ($) | 91,353 | 72.66¢ per $1 |
| Gini / Inequality Index | 91,353 | 0.47 |
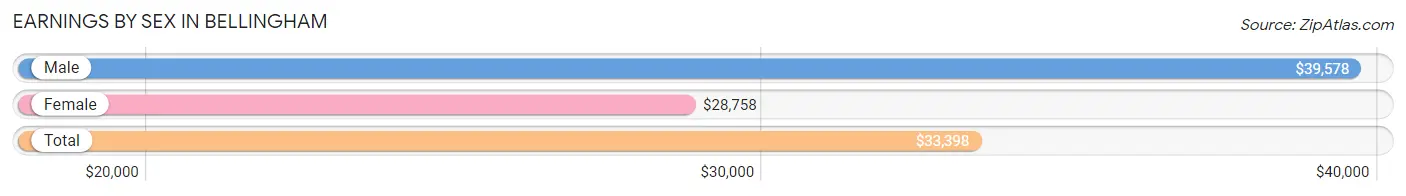
Earnings by Sex in Bellingham
Average Earnings in Bellingham are $33,398, $39,578 for men and $28,758 for women, a difference of 27.3%.
| Sex | Number | Average Earnings |
| Male | 28,753 (50.5%) | $39,578 |
| Female | 28,124 (49.4%) | $28,758 |
| Total | 56,877 (100.0%) | $33,398 |
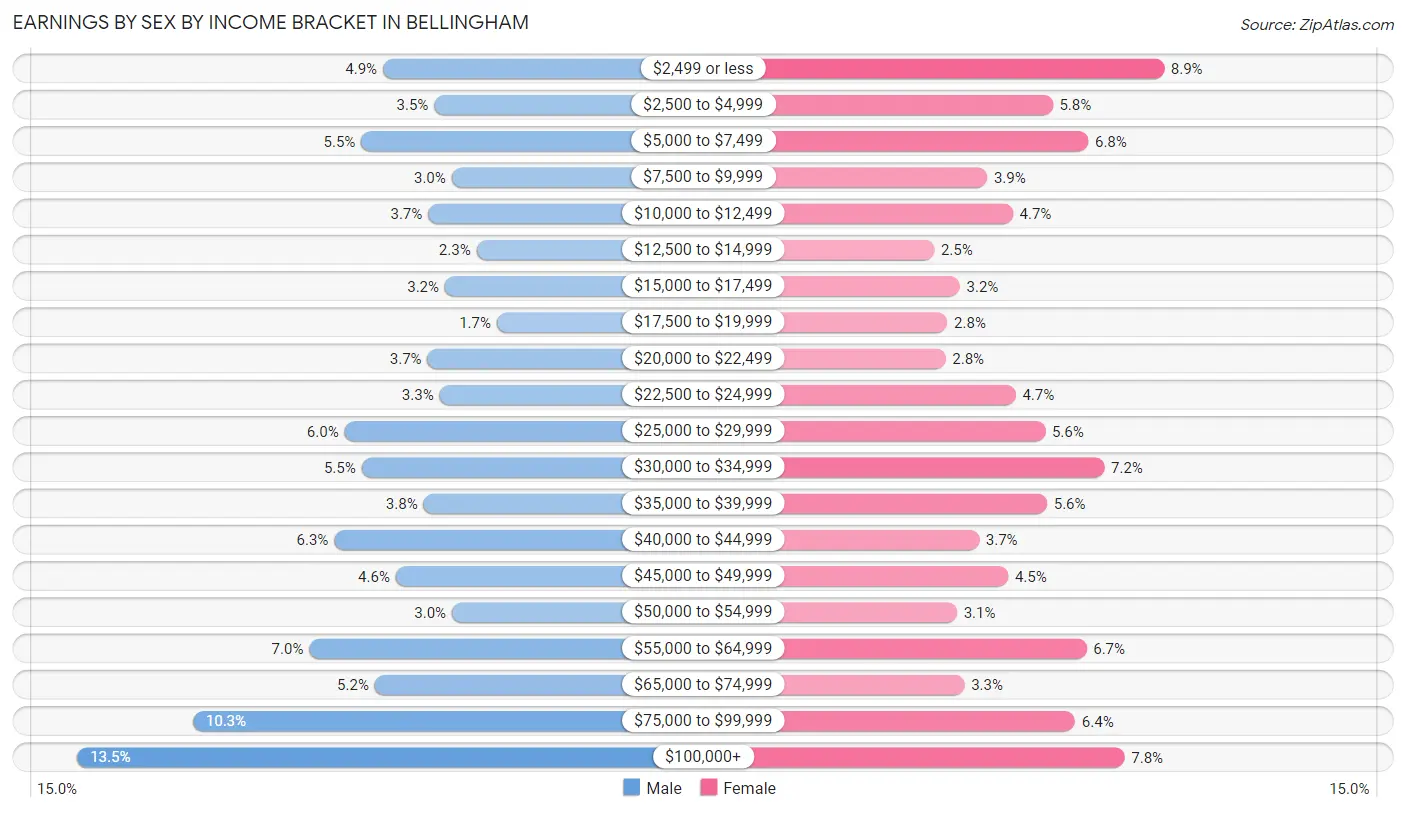
Earnings by Sex by Income Bracket in Bellingham
The most common earnings brackets in Bellingham are $100,000+ for men (3,887 | 13.5%) and $2,499 or less for women (2,505 | 8.9%).
| Income | Male | Female |
| $2,499 or less | 1,418 (4.9%) | 2,505 (8.9%) |
| $2,500 to $4,999 | 1,004 (3.5%) | 1,625 (5.8%) |
| $5,000 to $7,499 | 1,592 (5.5%) | 1,908 (6.8%) |
| $7,500 to $9,999 | 864 (3.0%) | 1,107 (3.9%) |
| $10,000 to $12,499 | 1,052 (3.7%) | 1,311 (4.7%) |
| $12,500 to $14,999 | 662 (2.3%) | 690 (2.5%) |
| $15,000 to $17,499 | 918 (3.2%) | 891 (3.2%) |
| $17,500 to $19,999 | 496 (1.7%) | 793 (2.8%) |
| $20,000 to $22,499 | 1,059 (3.7%) | 778 (2.8%) |
| $22,500 to $24,999 | 959 (3.3%) | 1,332 (4.7%) |
| $25,000 to $29,999 | 1,728 (6.0%) | 1,566 (5.6%) |
| $30,000 to $34,999 | 1,589 (5.5%) | 2,032 (7.2%) |
| $35,000 to $39,999 | 1,089 (3.8%) | 1,581 (5.6%) |
| $40,000 to $44,999 | 1,812 (6.3%) | 1,044 (3.7%) |
| $45,000 to $49,999 | 1,313 (4.6%) | 1,273 (4.5%) |
| $50,000 to $54,999 | 860 (3.0%) | 870 (3.1%) |
| $55,000 to $64,999 | 2,014 (7.0%) | 1,893 (6.7%) |
| $65,000 to $74,999 | 1,485 (5.2%) | 927 (3.3%) |
| $75,000 to $99,999 | 2,952 (10.3%) | 1,803 (6.4%) |
| $100,000+ | 3,887 (13.5%) | 2,195 (7.8%) |
| Total | 28,753 (100.0%) | 28,124 (100.0%) |
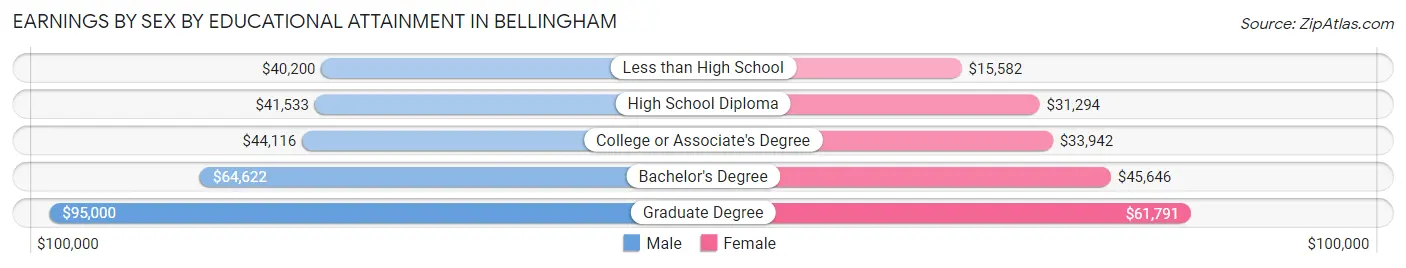
Earnings by Sex by Educational Attainment in Bellingham
Average earnings in Bellingham are $52,829 for men and $39,848 for women, a difference of 24.6%. Men with an educational attainment of graduate degree enjoy the highest average annual earnings of $95,000, while those with less than high school education earn the least with $40,200. Women with an educational attainment of graduate degree earn the most with the average annual earnings of $61,791, while those with less than high school education have the smallest earnings of $15,582.
| Educational Attainment | Male Income | Female Income |
| Less than High School | $40,200 | $15,582 |
| High School Diploma | $41,533 | $31,294 |
| College or Associate's Degree | $44,116 | $33,942 |
| Bachelor's Degree | $64,622 | $45,646 |
| Graduate Degree | $95,000 | $61,791 |
| Total | $52,829 | $39,848 |
Family Income in Bellingham
Family Income Brackets in Bellingham
According to the Bellingham family income data, there are 4,211 families falling into the $100,000 to $149,999 income range, which is the most common income bracket and makes up 23.2% of all families. Conversely, the $10,000 to $14,999 income bracket is the least frequent group with only 272 families (1.5%) belonging to this category.
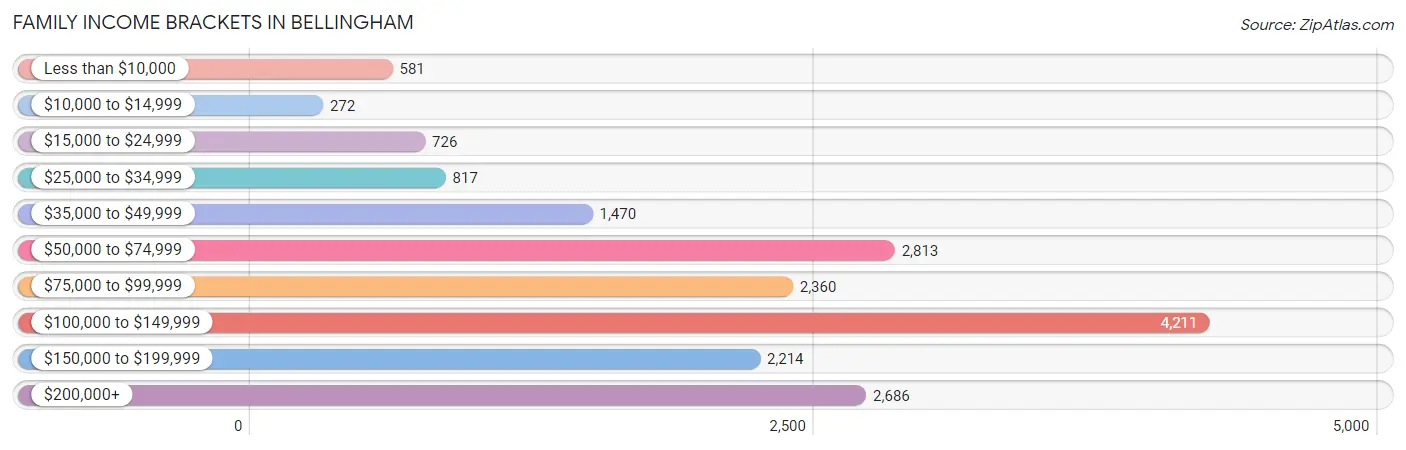
| Income Bracket | # Families | % Families |
| Less than $10,000 | 581 | 3.2% |
| $10,000 to $14,999 | 272 | 1.5% |
| $15,000 to $24,999 | 726 | 4.0% |
| $25,000 to $34,999 | 817 | 4.5% |
| $35,000 to $49,999 | 1,470 | 8.1% |
| $50,000 to $74,999 | 2,813 | 15.5% |
| $75,000 to $99,999 | 2,360 | 13.0% |
| $100,000 to $149,999 | 4,211 | 23.2% |
| $150,000 to $199,999 | 2,214 | 12.2% |
| $200,000+ | 2,686 | 14.8% |
Family Income by Famaliy Size in Bellingham
4-person families (2,861 | 15.8%) account for the highest median family income in Bellingham with $135,216 per family, while 2-person families (10,612 | 58.5%) have the highest median income of $43,368 per family member.
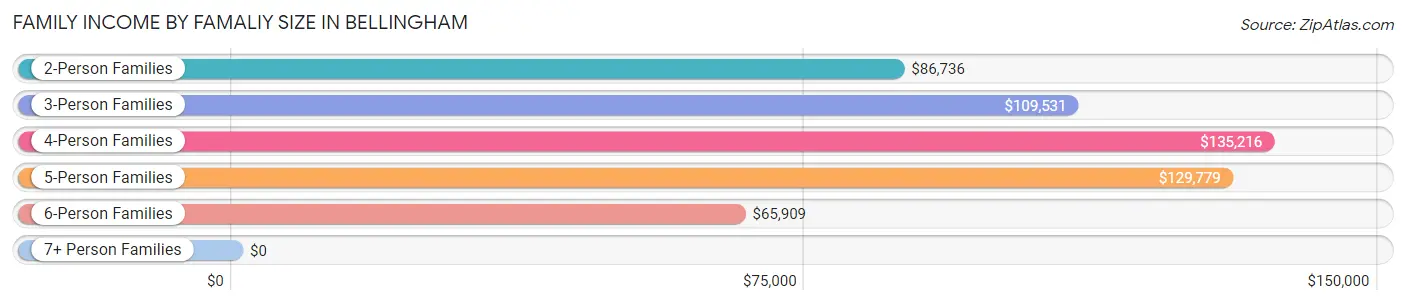
| Income Bracket | # Families | Median Income |
| 2-Person Families | 10,612 (58.5%) | $86,736 |
| 3-Person Families | 3,697 (20.4%) | $109,531 |
| 4-Person Families | 2,861 (15.8%) | $135,216 |
| 5-Person Families | 517 (2.9%) | $129,779 |
| 6-Person Families | 392 (2.2%) | $65,909 |
| 7+ Person Families | 72 (0.4%) | $0 |
| Total | 18,151 (100.0%) | $100,228 |
Family Income by Number of Earners in Bellingham
The median family income in Bellingham is $100,228, with families comprising 3+ earners (1,441) having the highest median family income of $164,432, while families with 1 earner (5,426) have the lowest median family income of $64,681, accounting for 7.9% and 29.9% of families, respectively.
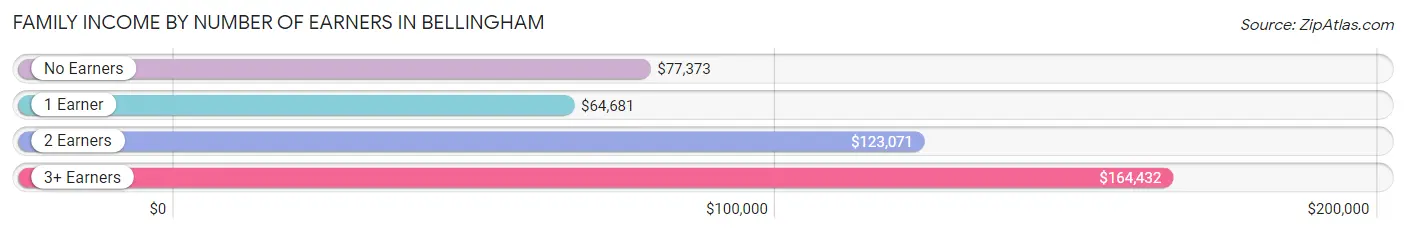
| Number of Earners | # Families | Median Income |
| No Earners | 2,991 (16.5%) | $77,373 |
| 1 Earner | 5,426 (29.9%) | $64,681 |
| 2 Earners | 8,293 (45.7%) | $123,071 |
| 3+ Earners | 1,441 (7.9%) | $164,432 |
| Total | 18,151 (100.0%) | $100,228 |
Household Income in Bellingham
Household Income Brackets in Bellingham
With 7,376 households falling in the category, the $50,000 to $74,999 income range is the most frequent in Bellingham, accounting for 18.4% of all households. In contrast, only 2,044 households (5.1%) fall into the $10,000 to $14,999 income bracket, making it the least populous group.
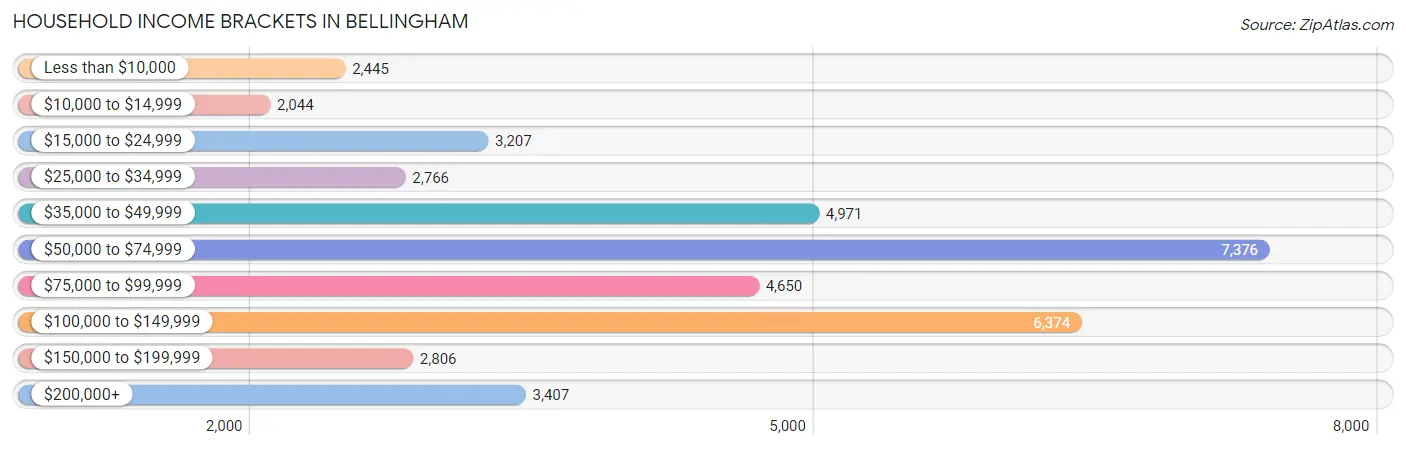
| Income Bracket | # Households | % Households |
| Less than $10,000 | 2,445 | 6.1% |
| $10,000 to $14,999 | 2,044 | 5.1% |
| $15,000 to $24,999 | 3,207 | 8.0% |
| $25,000 to $34,999 | 2,766 | 6.9% |
| $35,000 to $49,999 | 4,971 | 12.4% |
| $50,000 to $74,999 | 7,376 | 18.4% |
| $75,000 to $99,999 | 4,650 | 11.6% |
| $100,000 to $149,999 | 6,374 | 15.9% |
| $150,000 to $199,999 | 2,806 | 7.0% |
| $200,000+ | 3,407 | 8.5% |
Household Income by Householder Age in Bellingham
The median household income in Bellingham is $64,026, with the highest median household income of $89,534 found in the 45 to 64 years age bracket for the primary householder. A total of 11,059 households (27.6%) fall into this category. Meanwhile, the 15 to 24 years age bracket for the primary householder has the lowest median household income of $36,810, with 6,127 households (15.3%) in this group.
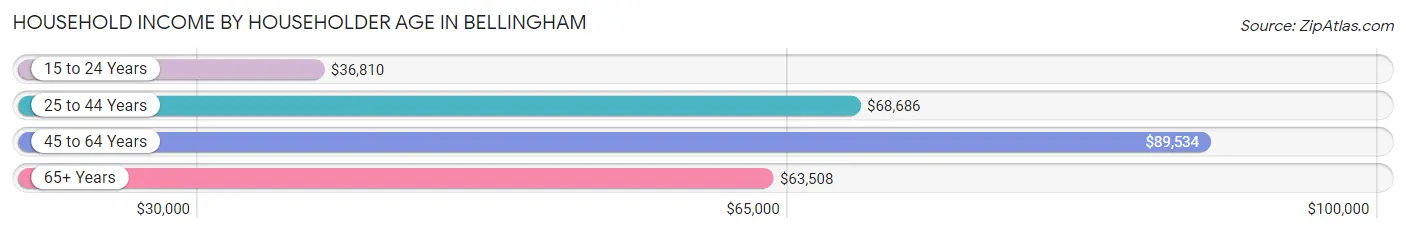
| Income Bracket | # Households | Median Income |
| 15 to 24 Years | 6,127 (15.3%) | $36,810 |
| 25 to 44 Years | 13,067 (32.6%) | $68,686 |
| 45 to 64 Years | 11,059 (27.6%) | $89,534 |
| 65+ Years | 9,832 (24.5%) | $63,508 |
| Total | 40,085 (100.0%) | $64,026 |
Poverty in Bellingham
Income Below Poverty by Sex and Age in Bellingham
With 17.8% poverty level for males and 19.5% for females among the residents of Bellingham, 18 to 24 year old males and 18 to 24 year old females are the most vulnerable to poverty, with 3,442 males (40.3%) and 4,010 females (44.9%) in their respective age groups living below the poverty level.
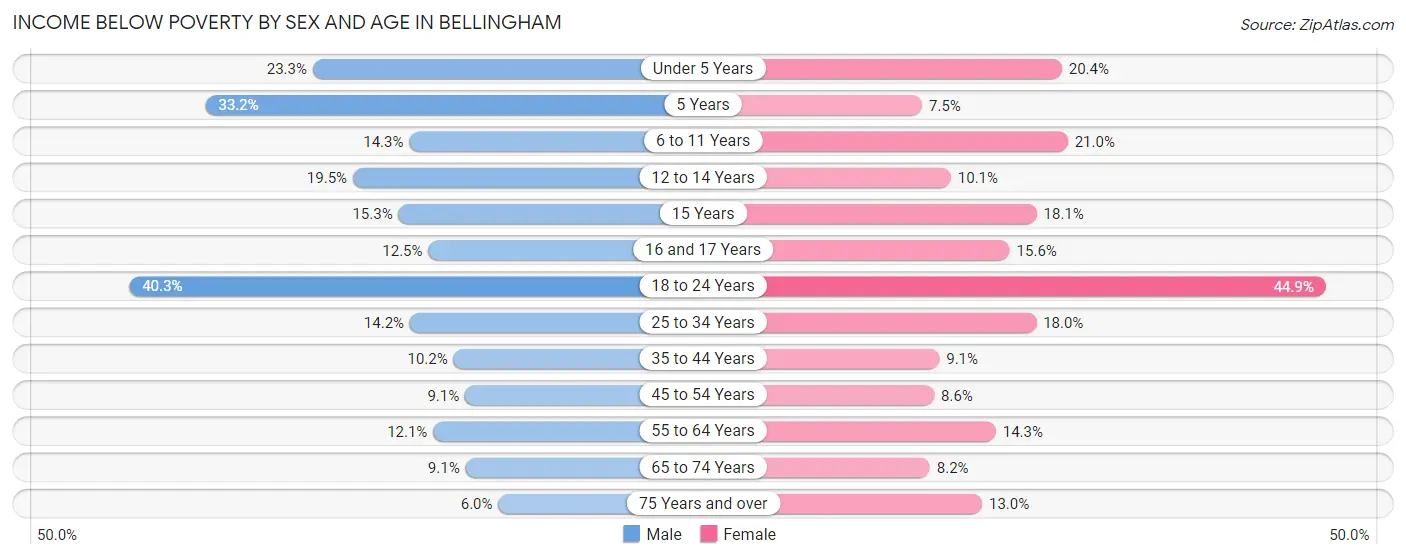
| Age Bracket | Male | Female |
| Under 5 Years | 345 (23.3%) | 313 (20.4%) |
| 5 Years | 99 (33.2%) | 19 (7.4%) |
| 6 to 11 Years | 297 (14.3%) | 431 (21.0%) |
| 12 to 14 Years | 174 (19.5%) | 96 (10.1%) |
| 15 Years | 54 (15.3%) | 128 (18.1%) |
| 16 and 17 Years | 102 (12.5%) | 84 (15.6%) |
| 18 to 24 Years | 3,442 (40.3%) | 4,010 (44.9%) |
| 25 to 34 Years | 1,075 (14.2%) | 1,273 (18.0%) |
| 35 to 44 Years | 541 (10.2%) | 451 (9.0%) |
| 45 to 54 Years | 416 (9.1%) | 391 (8.6%) |
| 55 to 64 Years | 500 (12.1%) | 713 (14.3%) |
| 65 to 74 Years | 368 (9.1%) | 383 (8.2%) |
| 75 Years and over | 134 (6.0%) | 469 (13.0%) |
| Total | 7,547 (17.8%) | 8,761 (19.5%) |
Income Above Poverty by Sex and Age in Bellingham
According to the poverty statistics in Bellingham, males aged 75 years and over and females aged 5 years are the age groups that are most secure financially, with 94.0% of males and 92.5% of females in these age groups living above the poverty line.
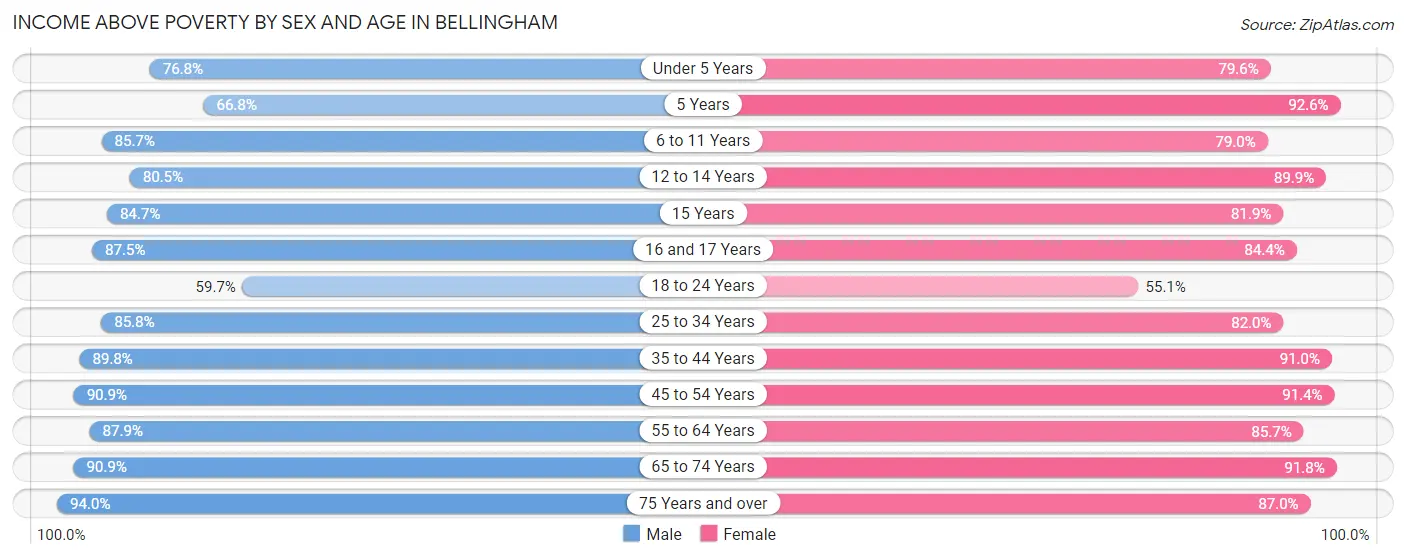
| Age Bracket | Male | Female |
| Under 5 Years | 1,139 (76.7%) | 1,220 (79.6%) |
| 5 Years | 199 (66.8%) | 236 (92.5%) |
| 6 to 11 Years | 1,780 (85.7%) | 1,624 (79.0%) |
| 12 to 14 Years | 717 (80.5%) | 853 (89.9%) |
| 15 Years | 299 (84.7%) | 580 (81.9%) |
| 16 and 17 Years | 712 (87.5%) | 455 (84.4%) |
| 18 to 24 Years | 5,102 (59.7%) | 4,919 (55.1%) |
| 25 to 34 Years | 6,475 (85.8%) | 5,782 (82.0%) |
| 35 to 44 Years | 4,766 (89.8%) | 4,532 (90.9%) |
| 45 to 54 Years | 4,146 (90.9%) | 4,169 (91.4%) |
| 55 to 64 Years | 3,640 (87.9%) | 4,276 (85.7%) |
| 65 to 74 Years | 3,687 (90.9%) | 4,307 (91.8%) |
| 75 Years and over | 2,087 (94.0%) | 3,132 (87.0%) |
| Total | 34,749 (82.2%) | 36,085 (80.5%) |
Income Below Poverty Among Married-Couple Families in Bellingham
The poverty statistics for married-couple families in Bellingham show that 2.6% or 361 of the total 13,959 families live below the poverty line. Families with 1 or 2 children have the highest poverty rate of 3.3%, comprising of 144 families. On the other hand, families with no children have the lowest poverty rate of 2.3%, which includes 206 families.
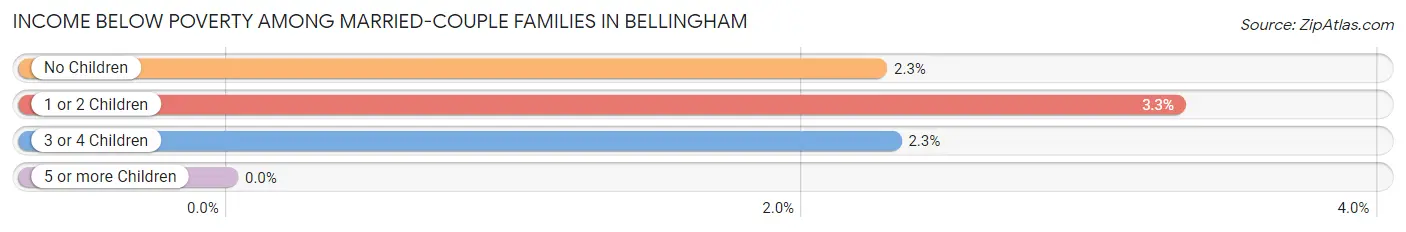
| Children | Above Poverty | Below Poverty |
| No Children | 8,911 (97.7%) | 206 (2.3%) |
| 1 or 2 Children | 4,221 (96.7%) | 144 (3.3%) |
| 3 or 4 Children | 466 (97.7%) | 11 (2.3%) |
| 5 or more Children | 0 (0.0%) | 0 (0.0%) |
| Total | 13,598 (97.4%) | 361 (2.6%) |
Income Below Poverty Among Single-Parent Households in Bellingham
According to the poverty data in Bellingham, 23.8% or 229 single-father households and 30.3% or 980 single-mother households are living below the poverty line. Among single-father households, those with 3 or 4 children have the highest poverty rate, with 142 households (82.1%) experiencing poverty. Likewise, among single-mother households, those with 1 or 2 children have the highest poverty rate, with 659 households (40.5%) falling below the poverty line.
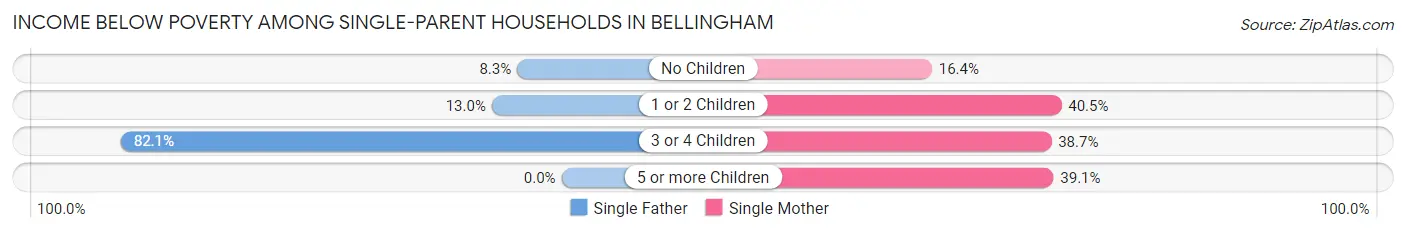
| Children | Single Father | Single Mother |
| No Children | 27 (8.3%) | 221 (16.4%) |
| 1 or 2 Children | 60 (13.0%) | 659 (40.5%) |
| 3 or 4 Children | 142 (82.1%) | 75 (38.7%) |
| 5 or more Children | 0 (0.0%) | 25 (39.1%) |
| Total | 229 (23.8%) | 980 (30.3%) |
Income Below Poverty Among Married-Couple vs Single-Parent Households in Bellingham
The poverty data for Bellingham shows that 361 of the married-couple family households (2.6%) and 1,209 of the single-parent households (28.8%) are living below the poverty level. Within the married-couple family households, those with 1 or 2 children have the highest poverty rate, with 144 households (3.3%) falling below the poverty line. Among the single-parent households, those with 3 or 4 children have the highest poverty rate, with 217 household (59.1%) living below poverty.
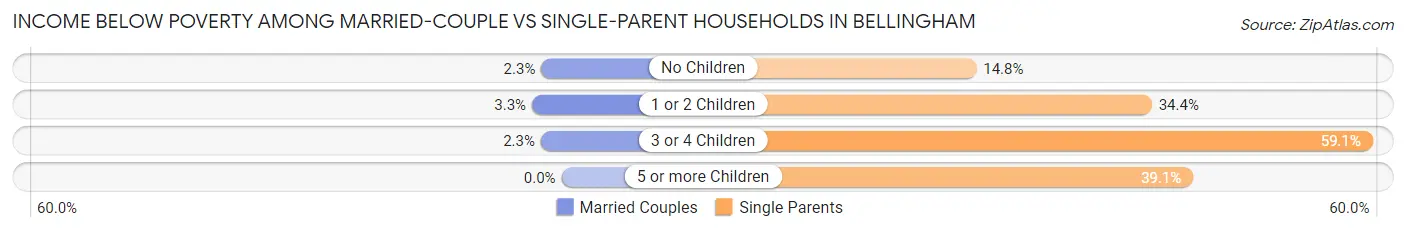
| Children | Married-Couple Families | Single-Parent Households |
| No Children | 206 (2.3%) | 248 (14.8%) |
| 1 or 2 Children | 144 (3.3%) | 719 (34.4%) |
| 3 or 4 Children | 11 (2.3%) | 217 (59.1%) |
| 5 or more Children | 0 (0.0%) | 25 (39.1%) |
| Total | 361 (2.6%) | 1,209 (28.8%) |
Race in Bellingham
The most populous races in Bellingham are White / Caucasian (73,837 | 80.8%), Hispanic or Latino (9,135 | 10.0%), and Two or more Races (7,132 | 7.8%).
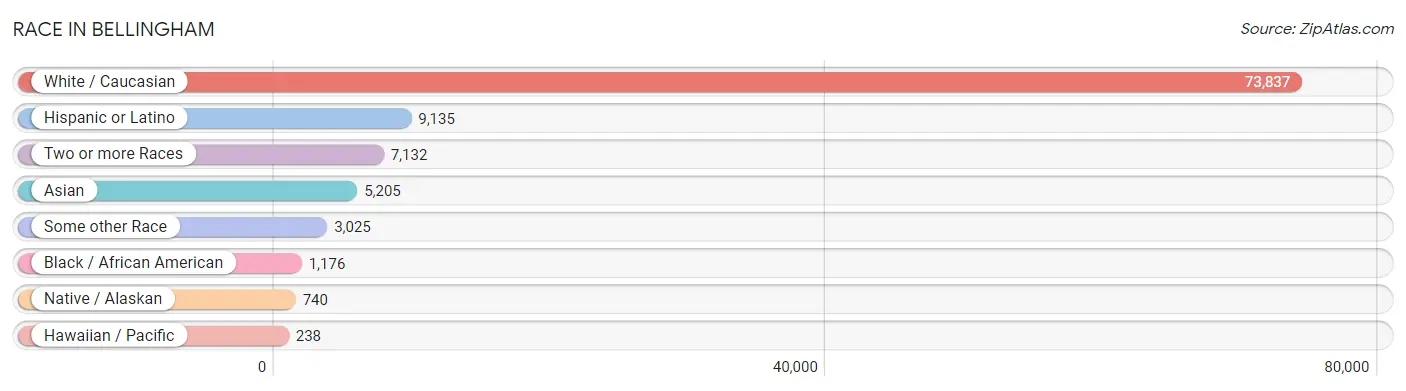
| Race | # Population | % Population |
| Asian | 5,205 | 5.7% |
| Black / African American | 1,176 | 1.3% |
| Hawaiian / Pacific | 238 | 0.3% |
| Hispanic or Latino | 9,135 | 10.0% |
| Native / Alaskan | 740 | 0.8% |
| White / Caucasian | 73,837 | 80.8% |
| Two or more Races | 7,132 | 7.8% |
| Some other Race | 3,025 | 3.3% |
| Total | 91,353 | 100.0% |
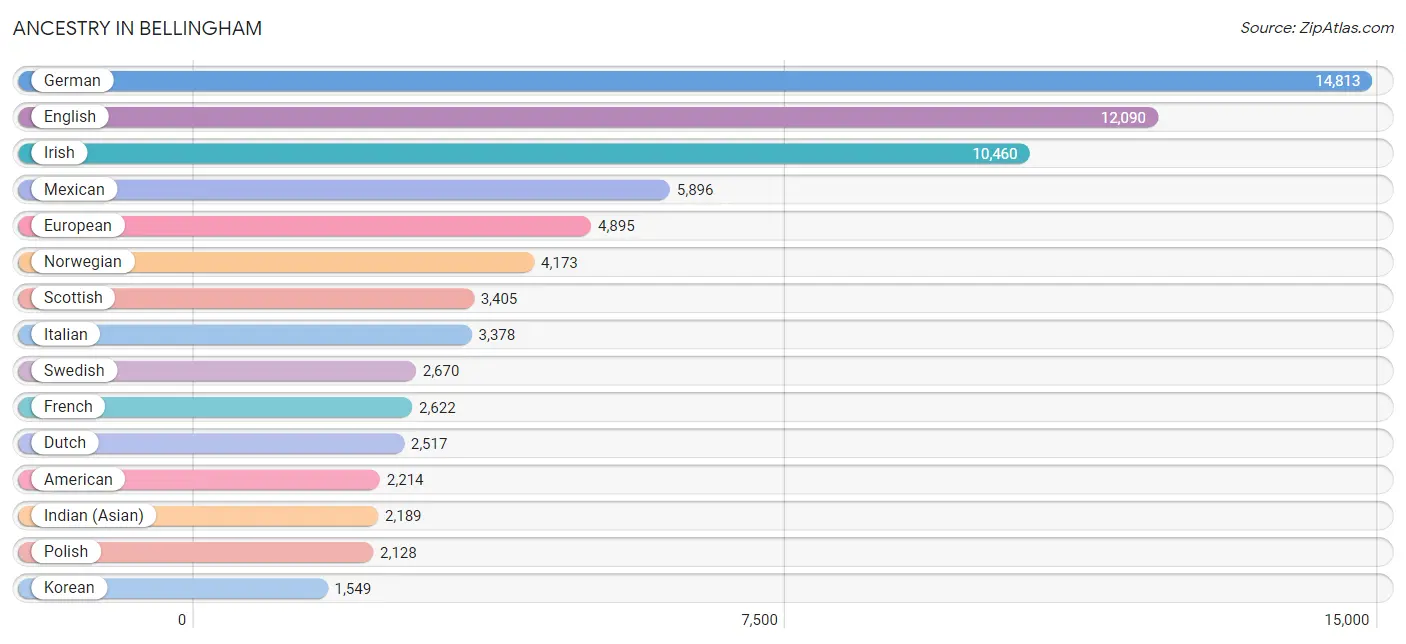
Ancestry in Bellingham
The most populous ancestries reported in Bellingham are German (14,813 | 16.2%), English (12,090 | 13.2%), Irish (10,460 | 11.5%), Mexican (5,896 | 6.5%), and European (4,895 | 5.4%), together accounting for 52.7% of all Bellingham residents.
| Ancestry | # Population | % Population |
| African | 180 | 0.2% |
| Alaska Native | 9 | 0.0% |
| Alaskan Athabascan | 27 | 0.0% |
| Albanian | 40 | 0.0% |
| Aleut | 47 | 0.1% |
| American | 2,214 | 2.4% |
| Apache | 12 | 0.0% |
| Arab | 226 | 0.3% |
| Argentinean | 50 | 0.1% |
| Armenian | 15 | 0.0% |
| Australian | 90 | 0.1% |
| Austrian | 281 | 0.3% |
| Bangladeshi | 18 | 0.0% |
| Basque | 18 | 0.0% |
| Belgian | 60 | 0.1% |
| Belizean | 41 | 0.0% |
| Bhutanese | 946 | 1.0% |
| Blackfeet | 41 | 0.0% |
| Bolivian | 55 | 0.1% |
| Brazilian | 49 | 0.1% |
| British | 1,166 | 1.3% |
| British West Indian | 14 | 0.0% |
| Bulgarian | 129 | 0.1% |
| Burmese | 680 | 0.7% |
| Cajun | 30 | 0.0% |
| Canadian | 706 | 0.8% |
| Carpatho Rusyn | 15 | 0.0% |
| Celtic | 141 | 0.2% |
| Central American | 772 | 0.9% |
| Central American Indian | 18 | 0.0% |
| Cherokee | 295 | 0.3% |
| Cheyenne | 28 | 0.0% |
| Chickasaw | 55 | 0.1% |
| Chilean | 59 | 0.1% |
| Chippewa | 16 | 0.0% |
| Choctaw | 59 | 0.1% |
| Colombian | 135 | 0.2% |
| Costa Rican | 150 | 0.2% |
| Cree | 7 | 0.0% |
| Creek | 19 | 0.0% |
| Croatian | 160 | 0.2% |
| Cuban | 125 | 0.1% |
| Czech | 274 | 0.3% |
| Czechoslovakian | 33 | 0.0% |
| Danish | 791 | 0.9% |
| Delaware | 12 | 0.0% |
| Dominican | 153 | 0.2% |
| Dutch | 2,517 | 2.8% |
| Eastern European | 225 | 0.3% |
| Egyptian | 93 | 0.1% |
| English | 12,090 | 13.2% |
| Estonian | 42 | 0.1% |
| Ethiopian | 33 | 0.0% |
| European | 4,895 | 5.4% |
| Filipino | 78 | 0.1% |
| Finnish | 401 | 0.4% |
| French | 2,622 | 2.9% |
| French Canadian | 529 | 0.6% |
| German | 14,813 | 16.2% |
| Ghanaian | 54 | 0.1% |
| Greek | 169 | 0.2% |
| Guamanian / Chamorro | 151 | 0.2% |
| Guatemalan | 134 | 0.2% |
| Haitian | 15 | 0.0% |
| Honduran | 170 | 0.2% |
| Hungarian | 311 | 0.3% |
| Icelander | 322 | 0.4% |
| Indian (Asian) | 2,189 | 2.4% |
| Indonesian | 25 | 0.0% |
| Inupiat | 23 | 0.0% |
| Iranian | 182 | 0.2% |
| Irish | 10,460 | 11.5% |
| Iroquois | 70 | 0.1% |
| Israeli | 24 | 0.0% |
| Italian | 3,378 | 3.7% |
| Jamaican | 107 | 0.1% |
| Japanese | 28 | 0.0% |
| Jordanian | 23 | 0.0% |
| Korean | 1,549 | 1.7% |
| Laotian | 6 | 0.0% |
| Latvian | 78 | 0.1% |
| Lebanese | 22 | 0.0% |
| Lithuanian | 247 | 0.3% |
| Malaysian | 52 | 0.1% |
| Mexican | 5,896 | 6.5% |
| Mexican American Indian | 127 | 0.1% |
| Mongolian | 67 | 0.1% |
| Native Hawaiian | 356 | 0.4% |
| Navajo | 68 | 0.1% |
| Nicaraguan | 9 | 0.0% |
| Northern European | 550 | 0.6% |
| Norwegian | 4,173 | 4.6% |
| Pakistani | 251 | 0.3% |
| Palestinian | 8 | 0.0% |
| Panamanian | 89 | 0.1% |
| Peruvian | 264 | 0.3% |
| Polish | 2,128 | 2.3% |
| Portuguese | 440 | 0.5% |
| Potawatomi | 34 | 0.0% |
| Puerto Rican | 362 | 0.4% |
| Puget Sound Salish | 67 | 0.1% |
| Romanian | 161 | 0.2% |
| Russian | 1,200 | 1.3% |
| Salvadoran | 220 | 0.2% |
| Samoan | 67 | 0.1% |
| Scandinavian | 831 | 0.9% |
| Scotch-Irish | 913 | 1.0% |
| Scottish | 3,405 | 3.7% |
| Seminole | 12 | 0.0% |
| Serbian | 78 | 0.1% |
| Shoshone | 11 | 0.0% |
| Sioux | 156 | 0.2% |
| Slavic | 76 | 0.1% |
| Slovak | 84 | 0.1% |
| Slovene | 43 | 0.1% |
| Somali | 17 | 0.0% |
| South American | 685 | 0.7% |
| Spaniard | 362 | 0.4% |
| Spanish | 207 | 0.2% |
| Sri Lankan | 917 | 1.0% |
| Subsaharan African | 395 | 0.4% |
| Swedish | 2,670 | 2.9% |
| Swiss | 607 | 0.7% |
| Syrian | 48 | 0.1% |
| Thai | 896 | 1.0% |
| Tlingit-Haida | 96 | 0.1% |
| Tongan | 38 | 0.0% |
| Trinidadian and Tobagonian | 24 | 0.0% |
| Turkish | 39 | 0.0% |
| Ukrainian | 238 | 0.3% |
| Venezuelan | 91 | 0.1% |
| Welsh | 1,065 | 1.2% |
| Yugoslavian | 91 | 0.1% |
| Yup'ik | 81 | 0.1% |
| Zimbabwean | 59 | 0.1% | View All 135 Rows |
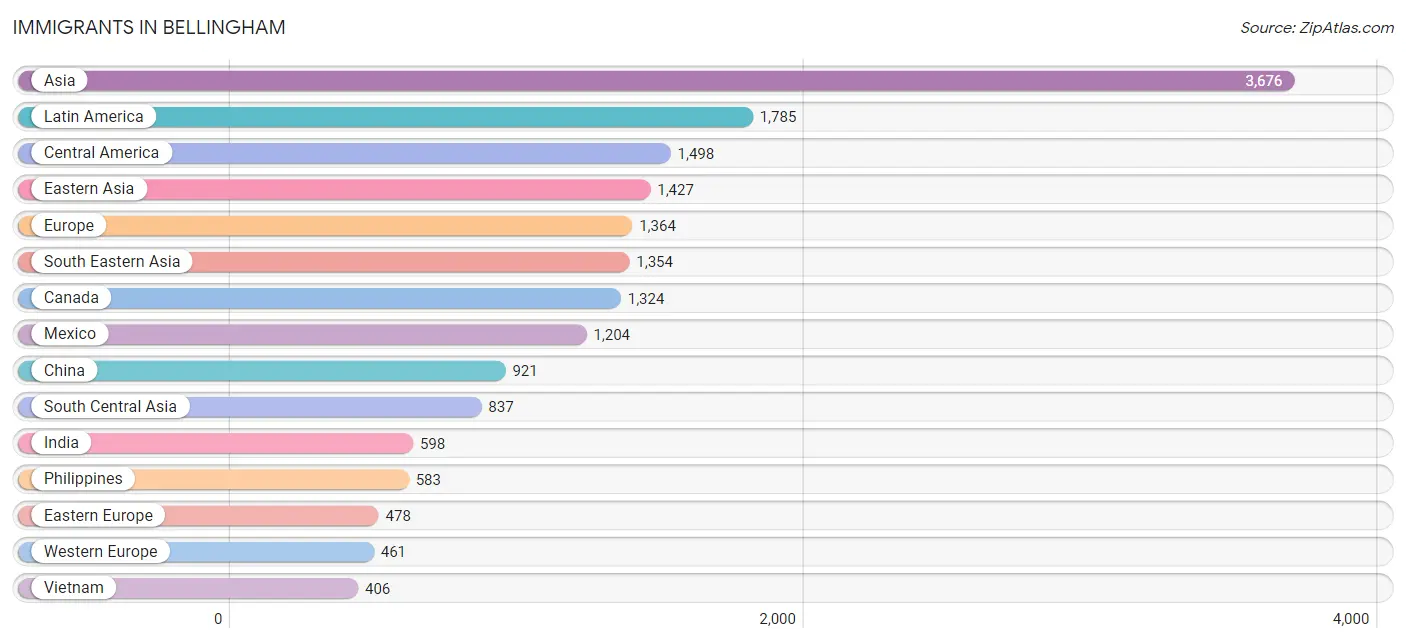
Immigrants in Bellingham
The most numerous immigrant groups reported in Bellingham came from Asia (3,676 | 4.0%), Latin America (1,785 | 1.9%), Central America (1,498 | 1.6%), Eastern Asia (1,427 | 1.6%), and Europe (1,364 | 1.5%), together accounting for 10.7% of all Bellingham residents.
| Immigration Origin | # Population | % Population |
| Africa | 263 | 0.3% |
| Argentina | 14 | 0.0% |
| Asia | 3,676 | 4.0% |
| Australia | 30 | 0.0% |
| Belize | 41 | 0.0% |
| Bosnia and Herzegovina | 5 | 0.0% |
| Bulgaria | 93 | 0.1% |
| Cambodia | 11 | 0.0% |
| Canada | 1,324 | 1.5% |
| Caribbean | 53 | 0.1% |
| Central America | 1,498 | 1.6% |
| China | 921 | 1.0% |
| Colombia | 53 | 0.1% |
| Costa Rica | 75 | 0.1% |
| Croatia | 11 | 0.0% |
| Denmark | 3 | 0.0% |
| Eastern Africa | 72 | 0.1% |
| Eastern Asia | 1,427 | 1.6% |
| Eastern Europe | 478 | 0.5% |
| Egypt | 32 | 0.0% |
| El Salvador | 41 | 0.0% |
| England | 221 | 0.2% |
| Ethiopia | 12 | 0.0% |
| Europe | 1,364 | 1.5% |
| Germany | 361 | 0.4% |
| Ghana | 49 | 0.1% |
| Guatemala | 7 | 0.0% |
| Honduras | 84 | 0.1% |
| Hong Kong | 69 | 0.1% |
| Hungary | 22 | 0.0% |
| India | 598 | 0.6% |
| Indonesia | 66 | 0.1% |
| Iran | 81 | 0.1% |
| Ireland | 22 | 0.0% |
| Italy | 14 | 0.0% |
| Jamaica | 53 | 0.1% |
| Japan | 267 | 0.3% |
| Kenya | 60 | 0.1% |
| Korea | 239 | 0.3% |
| Latin America | 1,785 | 1.9% |
| Latvia | 12 | 0.0% |
| Liberia | 38 | 0.0% |
| Malaysia | 70 | 0.1% |
| Mexico | 1,204 | 1.3% |
| Middle Africa | 6 | 0.0% |
| Nepal | 12 | 0.0% |
| Netherlands | 97 | 0.1% |
| Northern Africa | 55 | 0.1% |
| Northern Europe | 380 | 0.4% |
| Norway | 20 | 0.0% |
| Oceania | 99 | 0.1% |
| Pakistan | 42 | 0.1% |
| Panama | 46 | 0.1% |
| Peru | 64 | 0.1% |
| Philippines | 583 | 0.6% |
| Poland | 18 | 0.0% |
| Romania | 47 | 0.1% |
| Russia | 217 | 0.2% |
| Saudi Arabia | 10 | 0.0% |
| Scotland | 30 | 0.0% |
| Serbia | 32 | 0.0% |
| South Africa | 43 | 0.1% |
| South America | 234 | 0.3% |
| South Central Asia | 837 | 0.9% |
| South Eastern Asia | 1,354 | 1.5% |
| Southern Europe | 45 | 0.1% |
| Spain | 31 | 0.0% |
| Sri Lanka | 18 | 0.0% |
| Switzerland | 3 | 0.0% |
| Taiwan | 140 | 0.2% |
| Thailand | 193 | 0.2% |
| Ukraine | 17 | 0.0% |
| Venezuela | 72 | 0.1% |
| Vietnam | 406 | 0.4% |
| Western Africa | 87 | 0.1% |
| Western Asia | 17 | 0.0% |
| Western Europe | 461 | 0.5% |
| Zaire | 6 | 0.0% | View All 78 Rows |
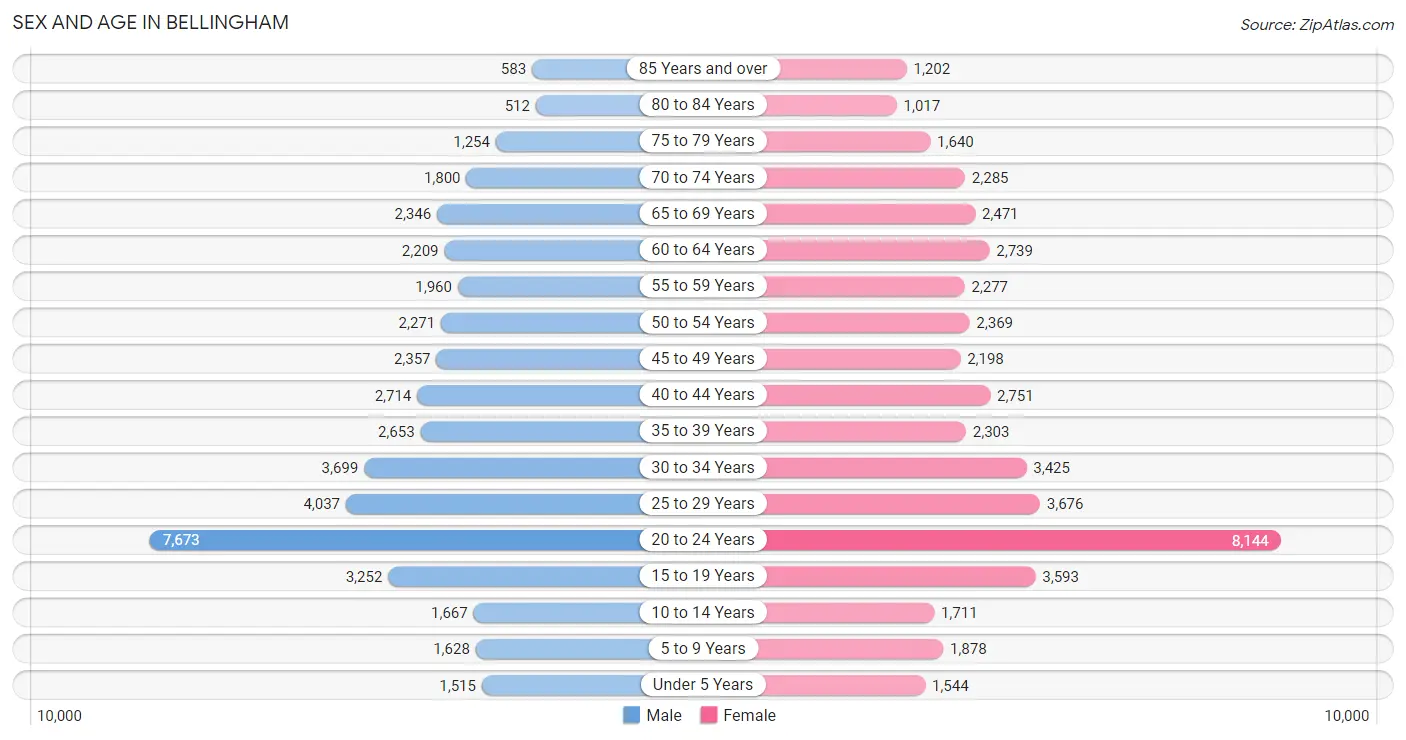
Sex and Age in Bellingham
Sex and Age in Bellingham
The most populous age groups in Bellingham are 20 to 24 Years (7,673 | 17.4%) for men and 20 to 24 Years (8,144 | 17.2%) for women.
| Age Bracket | Male | Female |
| Under 5 Years | 1,515 (3.4%) | 1,544 (3.3%) |
| 5 to 9 Years | 1,628 (3.7%) | 1,878 (4.0%) |
| 10 to 14 Years | 1,667 (3.8%) | 1,711 (3.6%) |
| 15 to 19 Years | 3,252 (7.4%) | 3,593 (7.6%) |
| 20 to 24 Years | 7,673 (17.4%) | 8,144 (17.2%) |
| 25 to 29 Years | 4,037 (9.1%) | 3,676 (7.8%) |
| 30 to 34 Years | 3,699 (8.4%) | 3,425 (7.2%) |
| 35 to 39 Years | 2,653 (6.0%) | 2,303 (4.9%) |
| 40 to 44 Years | 2,714 (6.1%) | 2,751 (5.8%) |
| 45 to 49 Years | 2,357 (5.3%) | 2,198 (4.6%) |
| 50 to 54 Years | 2,271 (5.1%) | 2,369 (5.0%) |
| 55 to 59 Years | 1,960 (4.4%) | 2,277 (4.8%) |
| 60 to 64 Years | 2,209 (5.0%) | 2,739 (5.8%) |
| 65 to 69 Years | 2,346 (5.3%) | 2,471 (5.2%) |
| 70 to 74 Years | 1,800 (4.1%) | 2,285 (4.8%) |
| 75 to 79 Years | 1,254 (2.8%) | 1,640 (3.5%) |
| 80 to 84 Years | 512 (1.2%) | 1,017 (2.1%) |
| 85 Years and over | 583 (1.3%) | 1,202 (2.5%) |
| Total | 44,130 (100.0%) | 47,223 (100.0%) |
Families and Households in Bellingham
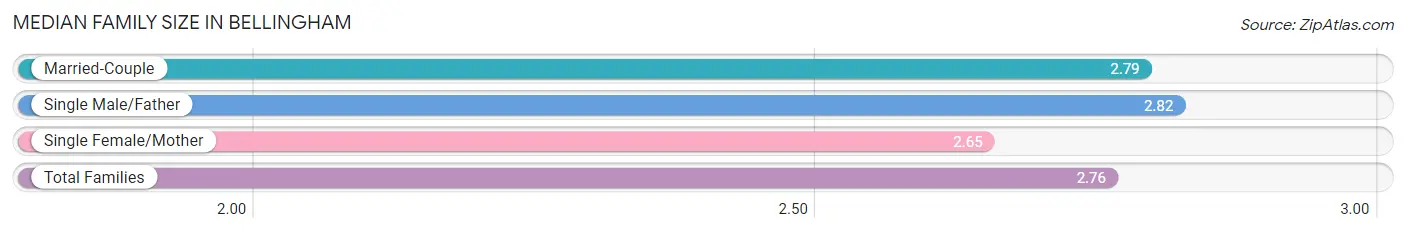
Median Family Size in Bellingham
The median family size in Bellingham is 2.76 persons per family, with single male/father families (961 | 5.3%) accounting for the largest median family size of 2.82 persons per family. On the other hand, single female/mother families (3,231 | 17.8%) represent the smallest median family size with 2.65 persons per family.
| Family Type | # Families | Family Size |
| Married-Couple | 13,959 (76.9%) | 2.79 |
| Single Male/Father | 961 (5.3%) | 2.82 |
| Single Female/Mother | 3,231 (17.8%) | 2.65 |
| Total Families | 18,151 (100.0%) | 2.76 |
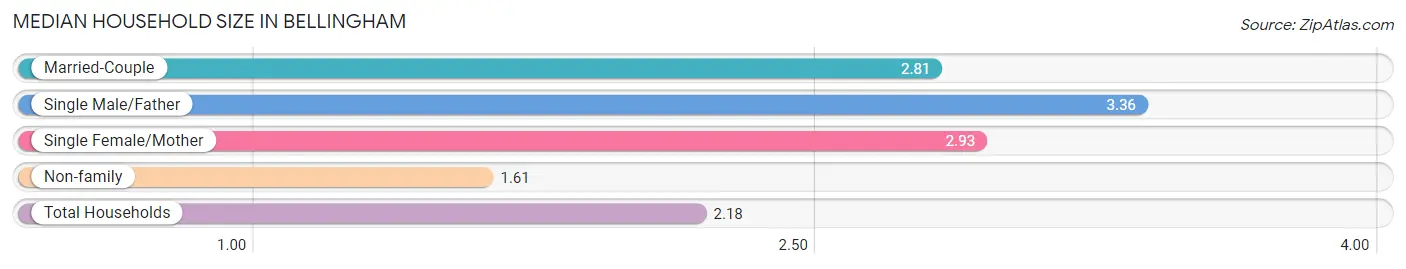
Median Household Size in Bellingham
The median household size in Bellingham is 2.18 persons per household, with single male/father households (961 | 2.4%) accounting for the largest median household size of 3.36 persons per household. non-family households (21,934 | 54.7%) represent the smallest median household size with 1.61 persons per household.
| Household Type | # Households | Household Size |
| Married-Couple | 13,959 (34.8%) | 2.81 |
| Single Male/Father | 961 (2.4%) | 3.36 |
| Single Female/Mother | 3,231 (8.1%) | 2.93 |
| Non-family | 21,934 (54.7%) | 1.61 |
| Total Households | 40,085 (100.0%) | 2.18 |
Household Size by Marriage Status in Bellingham
Out of a total of 40,085 households in Bellingham, 18,151 (45.3%) are family households, while 21,934 (54.7%) are nonfamily households. The most numerous type of family households are 2-person households, comprising 9,579, and the most common type of nonfamily households are 1-person households, comprising 13,467.
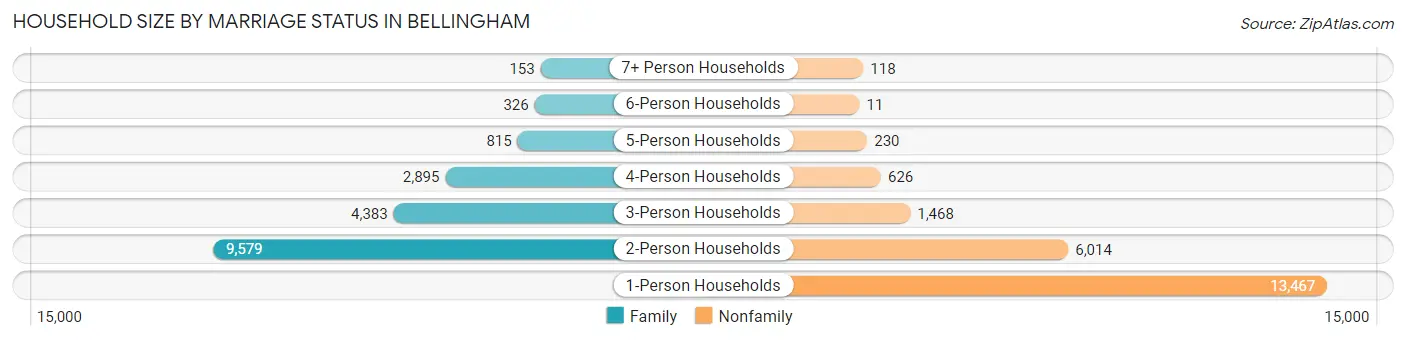
| Household Size | Family Households | Nonfamily Households |
| 1-Person Households | - | 13,467 (33.6%) |
| 2-Person Households | 9,579 (23.9%) | 6,014 (15.0%) |
| 3-Person Households | 4,383 (10.9%) | 1,468 (3.7%) |
| 4-Person Households | 2,895 (7.2%) | 626 (1.6%) |
| 5-Person Households | 815 (2.0%) | 230 (0.6%) |
| 6-Person Households | 326 (0.8%) | 11 (0.0%) |
| 7+ Person Households | 153 (0.4%) | 118 (0.3%) |
| Total | 18,151 (45.3%) | 21,934 (54.7%) |
Female Fertility in Bellingham
Fertility by Age in Bellingham
Average fertility rate in Bellingham is 29.0 births per 1,000 women. Women in the age bracket of 20 to 34 years have the highest fertility rate with 40.0 births per 1,000 women. Women in the age bracket of 20 to 34 years acount for 79.7% of all women with births.
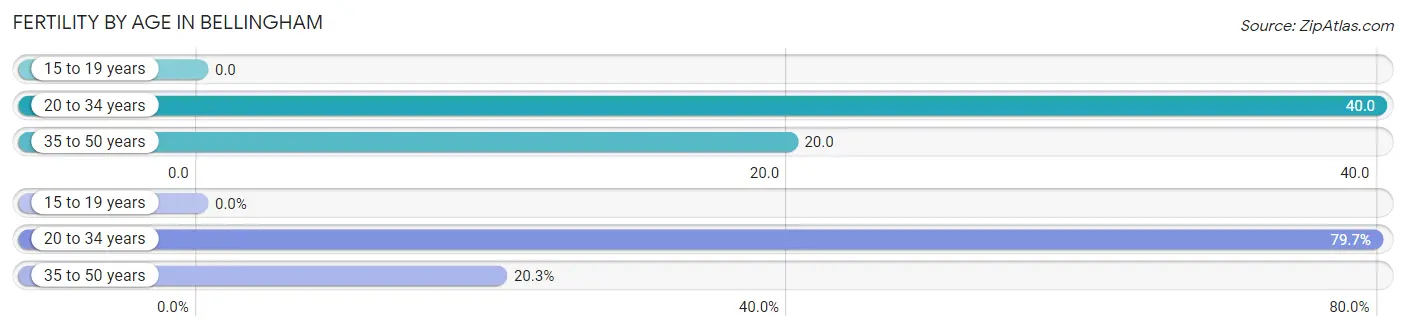
| Age Bracket | Women with Births | Births / 1,000 Women |
| 15 to 19 years | 0 (0.0%) | 0.0 |
| 20 to 34 years | 605 (79.7%) | 40.0 |
| 35 to 50 years | 154 (20.3%) | 20.0 |
| Total | 759 (100.0%) | 29.0 |
Fertility by Age by Marriage Status in Bellingham
77.5% of women with births (759) in Bellingham are married. The highest percentage of unmarried women with births falls into 20 to 34 years age bracket with 28.3% of them unmarried at the time of birth, while the lowest percentage of unmarried women with births belong to 35 to 50 years age bracket with 0.0% of them unmarried.
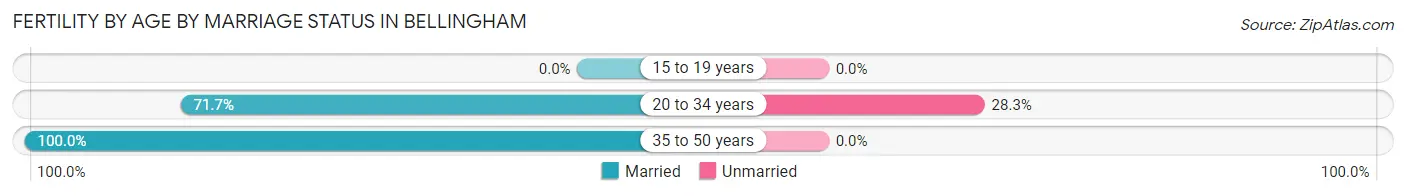
| Age Bracket | Married | Unmarried |
| 15 to 19 years | 0 (0.0%) | 0 (0.0%) |
| 20 to 34 years | 434 (71.7%) | 171 (28.3%) |
| 35 to 50 years | 154 (100.0%) | 0 (0.0%) |
| Total | 588 (77.5%) | 171 (22.5%) |
Fertility by Education in Bellingham
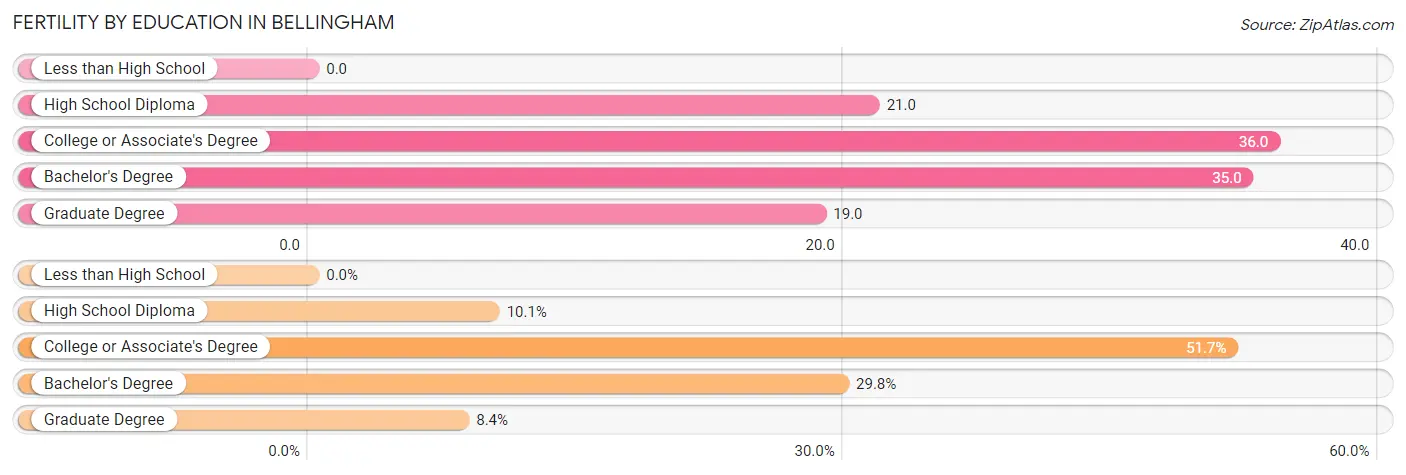
| Educational Attainment | Women with Births | Births / 1,000 Women |
| Less than High School | 0 (0.0%) | 0.0 |
| High School Diploma | 77 (10.1%) | 21.0 |
| College or Associate's Degree | 392 (51.6%) | 36.0 |
| Bachelor's Degree | 226 (29.8%) | 35.0 |
| Graduate Degree | 64 (8.4%) | 19.0 |
| Total | 759 (100.0%) | 29.0 |
Fertility by Education by Marriage Status in Bellingham
22.5% of women with births in Bellingham are unmarried. Women with the educational attainment of high school diploma are most likely to be married with 100.0% of them married at childbirth, while women with the educational attainment of college or associate's degree are least likely to be married with 43.6% of them unmarried at childbirth.
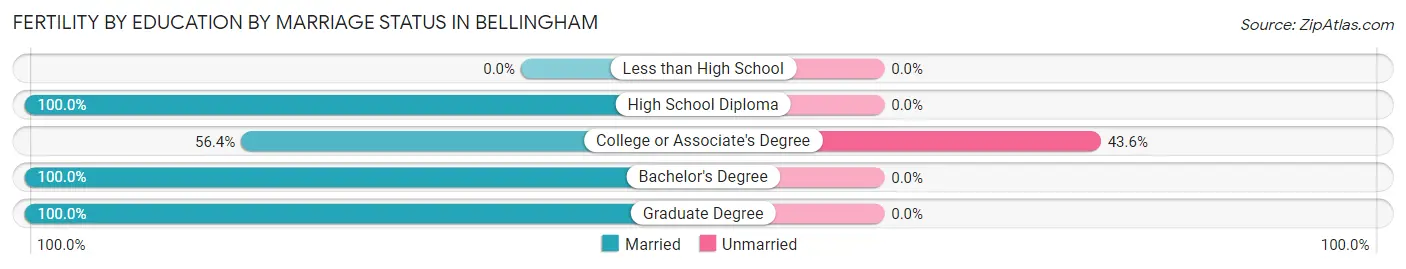
| Educational Attainment | Married | Unmarried |
| Less than High School | 0 (0.0%) | 0 (0.0%) |
| High School Diploma | 77 (100.0%) | 0 (0.0%) |
| College or Associate's Degree | 221 (56.4%) | 171 (43.6%) |
| Bachelor's Degree | 226 (100.0%) | 0 (0.0%) |
| Graduate Degree | 64 (100.0%) | 0 (0.0%) |
| Total | 588 (77.5%) | 171 (22.5%) |
Employment Characteristics in Bellingham
Employment by Class of Employer in Bellingham
Among the 48,641 employed individuals in Bellingham, private company employees (30,300 | 62.3%), not-for-profit organizations (4,308 | 8.9%), and local government employees (3,682 | 7.6%) make up the most common classes of employment.
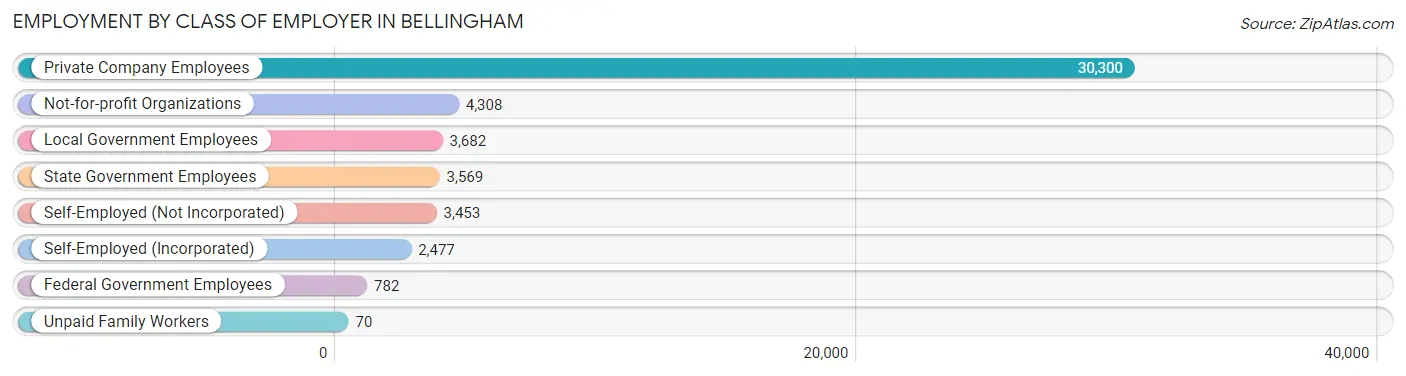
| Employer Class | # Employees | % Employees |
| Private Company Employees | 30,300 | 62.3% |
| Self-Employed (Incorporated) | 2,477 | 5.1% |
| Self-Employed (Not Incorporated) | 3,453 | 7.1% |
| Not-for-profit Organizations | 4,308 | 8.9% |
| Local Government Employees | 3,682 | 7.6% |
| State Government Employees | 3,569 | 7.3% |
| Federal Government Employees | 782 | 1.6% |
| Unpaid Family Workers | 70 | 0.1% |
| Total | 48,641 | 100.0% |
Employment Status by Age in Bellingham
According to the labor force statistics for Bellingham, out of the total population over 16 years of age (80,347), 65.3% or 52,467 individuals are in the labor force, with 4.8% or 2,518 of them unemployed. The age group with the highest labor force participation rate is 35 to 44 years, with 89.5% or 9,327 individuals in the labor force. Within the labor force, the 16 to 19 years age range has the highest percentage of unemployed individuals, with 18.5% or 466 of them being unemployed.
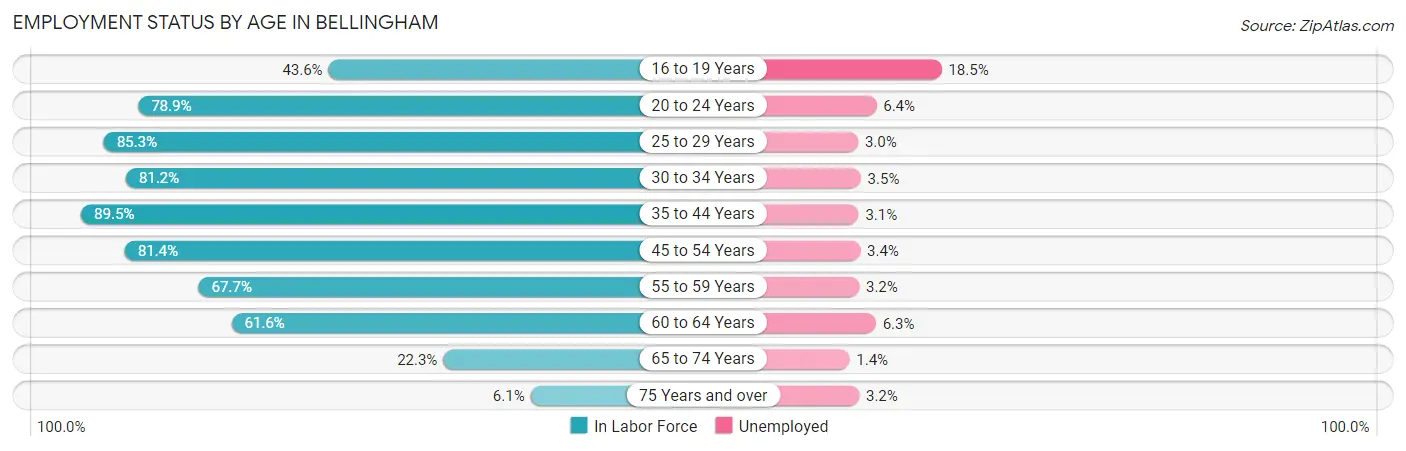
| Age Bracket | In Labor Force | Unemployed |
| 16 to 19 Years | 2,521 (43.6%) | 466 (18.5%) |
| 20 to 24 Years | 12,480 (78.9%) | 799 (6.4%) |
| 25 to 29 Years | 6,579 (85.3%) | 197 (3.0%) |
| 30 to 34 Years | 5,785 (81.2%) | 202 (3.5%) |
| 35 to 44 Years | 9,327 (89.5%) | 289 (3.1%) |
| 45 to 54 Years | 7,485 (81.4%) | 254 (3.4%) |
| 55 to 59 Years | 2,868 (67.7%) | 92 (3.2%) |
| 60 to 64 Years | 3,048 (61.6%) | 192 (6.3%) |
| 65 to 74 Years | 1,985 (22.3%) | 28 (1.4%) |
| 75 Years and over | 379 (6.1%) | 12 (3.2%) |
| Total | 52,467 (65.3%) | 2,518 (4.8%) |
Employment Status by Educational Attainment in Bellingham
According to labor force statistics for Bellingham, 80.4% of individuals (35,085) out of the total population between 25 and 64 years of age (43,638) are in the labor force, with 3.5% or 1,228 of them being unemployed. The group with the highest labor force participation rate are those with the educational attainment of bachelor's degree or higher, with 88.5% or 17,624 individuals in the labor force. Within the labor force, individuals with high school diploma education have the highest percentage of unemployment, with 5.8% or 308 of them being unemployed.
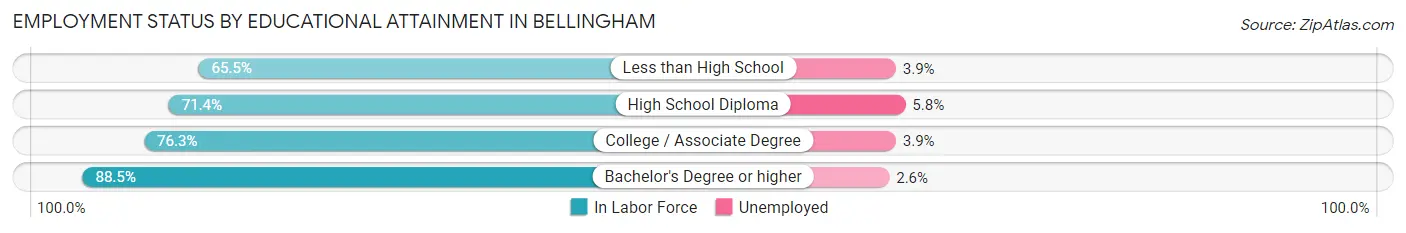
| Educational Attainment | In Labor Force | Unemployed |
| Less than High School | 1,665 (65.5%) | 99 (3.9%) |
| High School Diploma | 5,318 (71.4%) | 432 (5.8%) |
| College / Associate Degree | 10,479 (76.3%) | 536 (3.9%) |
| Bachelor's Degree or higher | 17,624 (88.5%) | 518 (2.6%) |
| Total | 35,085 (80.4%) | 1,527 (3.5%) |
Employment Occupations by Sex in Bellingham
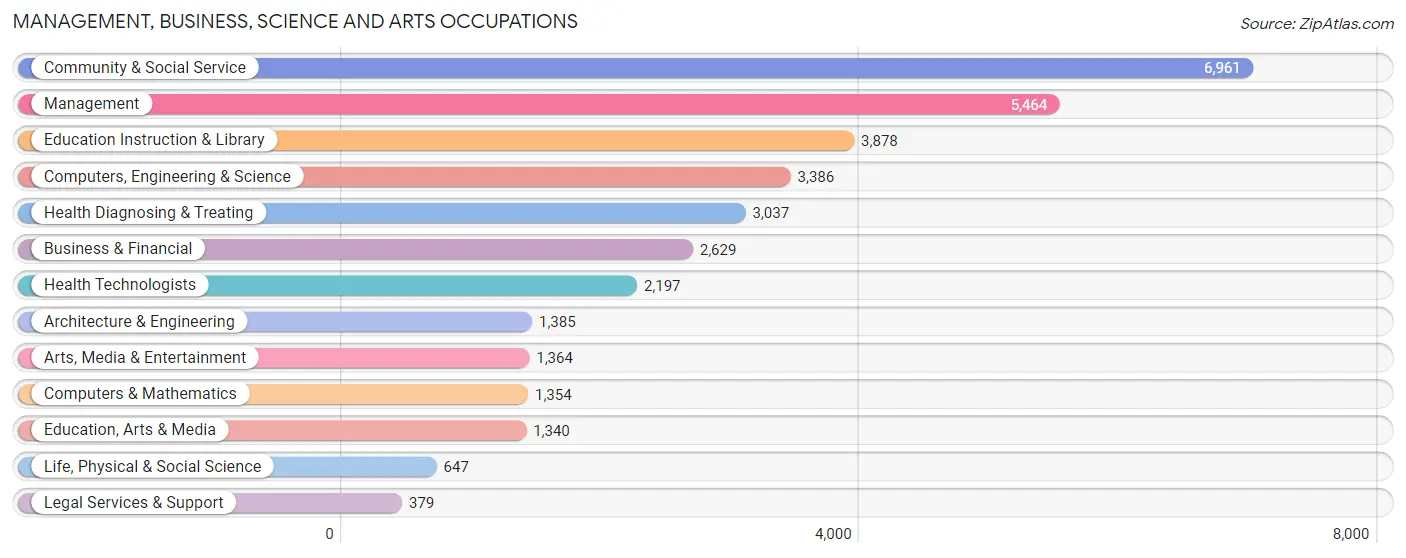
Management, Business, Science and Arts Occupations
The most common Management, Business, Science and Arts occupations in Bellingham are Community & Social Service (6,961 | 14.0%), Management (5,464 | 11.0%), Education Instruction & Library (3,878 | 7.8%), Computers, Engineering & Science (3,386 | 6.8%), and Health Diagnosing & Treating (3,037 | 6.1%).
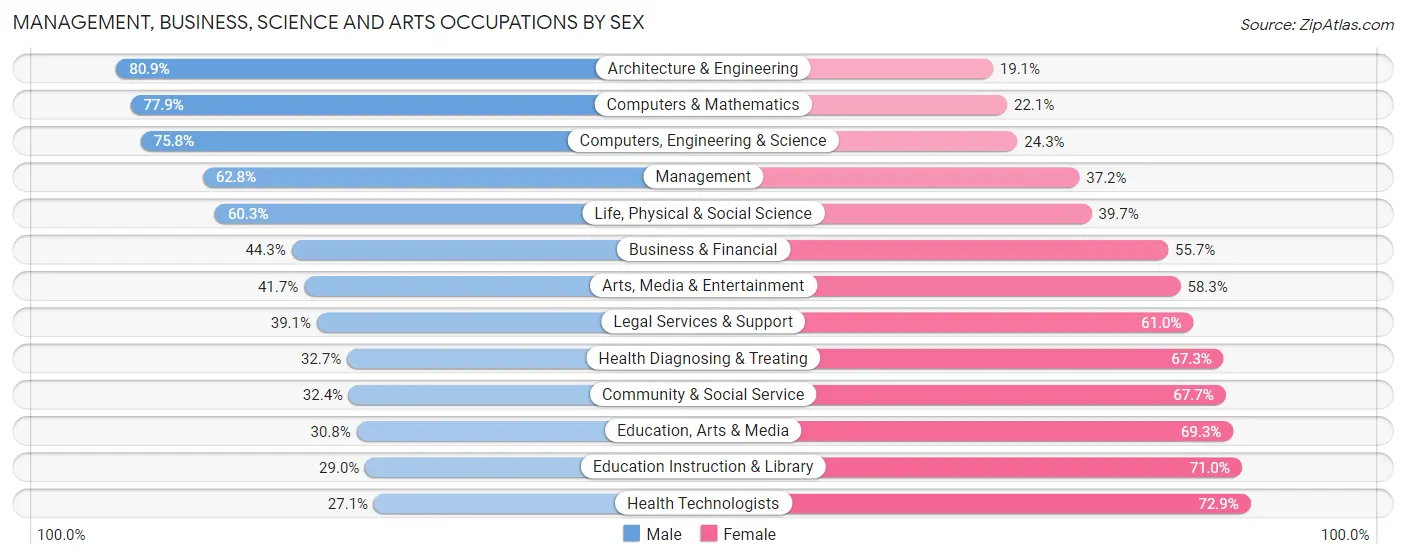
Management, Business, Science and Arts Occupations by Sex
Within the Management, Business, Science and Arts occupations in Bellingham, the most male-oriented occupations are Architecture & Engineering (80.9%), Computers & Mathematics (77.9%), and Computers, Engineering & Science (75.7%), while the most female-oriented occupations are Health Technologists (72.9%), Education Instruction & Library (71.0%), and Education, Arts & Media (69.3%).
| Occupation | Male | Female |
| Management | 3,433 (62.8%) | 2,031 (37.2%) |
| Business & Financial | 1,165 (44.3%) | 1,464 (55.7%) |
| Computers, Engineering & Science | 2,565 (75.7%) | 821 (24.2%) |
| Computers & Mathematics | 1,055 (77.9%) | 299 (22.1%) |
| Architecture & Engineering | 1,120 (80.9%) | 265 (19.1%) |
| Life, Physical & Social Science | 390 (60.3%) | 257 (39.7%) |
| Community & Social Service | 2,252 (32.4%) | 4,709 (67.6%) |
| Education, Arts & Media | 412 (30.7%) | 928 (69.3%) |
| Legal Services & Support | 148 (39.1%) | 231 (61.0%) |
| Education Instruction & Library | 1,123 (29.0%) | 2,755 (71.0%) |
| Arts, Media & Entertainment | 569 (41.7%) | 795 (58.3%) |
| Health Diagnosing & Treating | 994 (32.7%) | 2,043 (67.3%) |
| Health Technologists | 596 (27.1%) | 1,601 (72.9%) |
| Total (Category) | 10,409 (48.5%) | 11,068 (51.5%) |
| Total (Overall) | 25,074 (50.4%) | 24,654 (49.6%) |
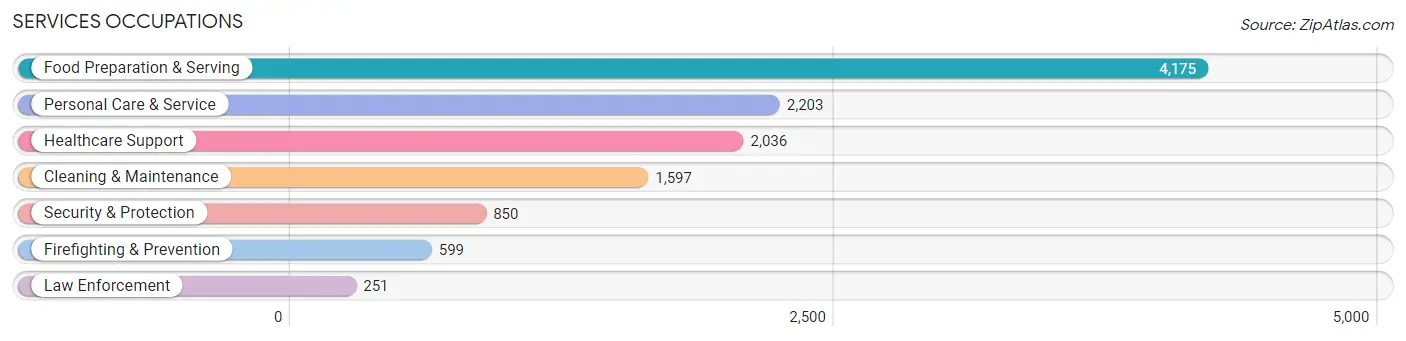
Services Occupations
The most common Services occupations in Bellingham are Food Preparation & Serving (4,175 | 8.4%), Personal Care & Service (2,203 | 4.4%), Healthcare Support (2,036 | 4.1%), Cleaning & Maintenance (1,597 | 3.2%), and Security & Protection (850 | 1.7%).
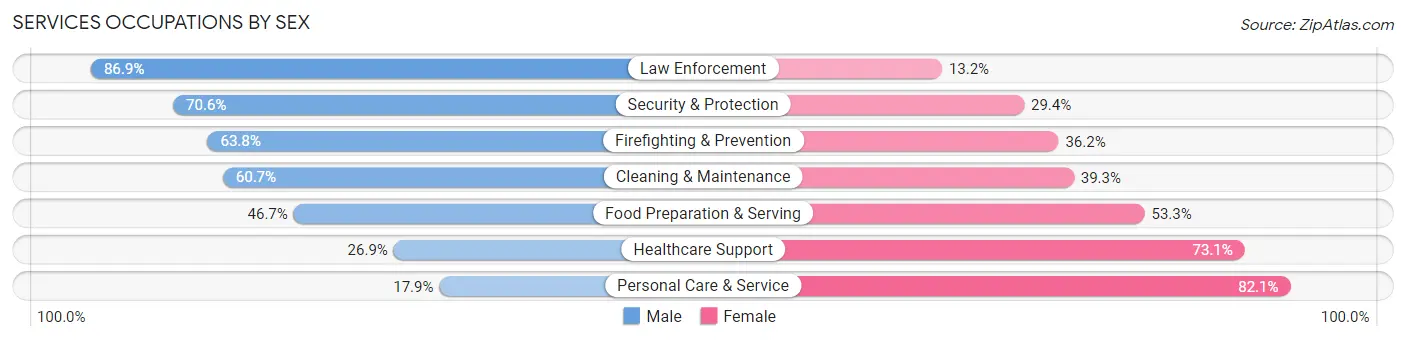
Services Occupations by Sex
Within the Services occupations in Bellingham, the most male-oriented occupations are Law Enforcement (86.9%), Security & Protection (70.6%), and Firefighting & Prevention (63.8%), while the most female-oriented occupations are Personal Care & Service (82.1%), Healthcare Support (73.1%), and Food Preparation & Serving (53.3%).
| Occupation | Male | Female |
| Healthcare Support | 548 (26.9%) | 1,488 (73.1%) |
| Security & Protection | 600 (70.6%) | 250 (29.4%) |
| Firefighting & Prevention | 382 (63.8%) | 217 (36.2%) |
| Law Enforcement | 218 (86.9%) | 33 (13.2%) |
| Food Preparation & Serving | 1,951 (46.7%) | 2,224 (53.3%) |
| Cleaning & Maintenance | 970 (60.7%) | 627 (39.3%) |
| Personal Care & Service | 394 (17.9%) | 1,809 (82.1%) |
| Total (Category) | 4,463 (41.1%) | 6,398 (58.9%) |
| Total (Overall) | 25,074 (50.4%) | 24,654 (49.6%) |
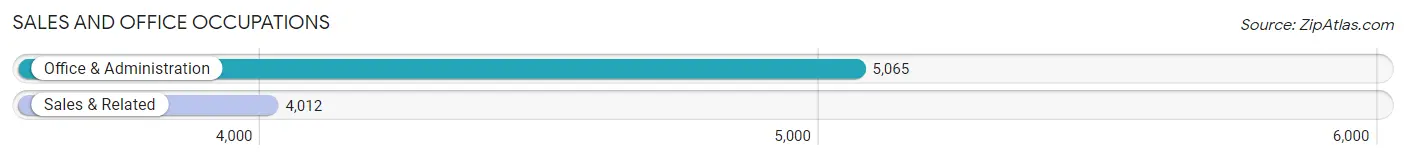
Sales and Office Occupations
The most common Sales and Office occupations in Bellingham are Office & Administration (5,065 | 10.2%), and Sales & Related (4,012 | 8.1%).
Sales and Office Occupations by Sex
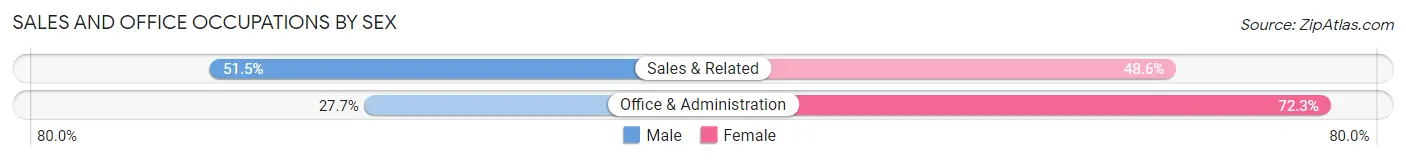
| Occupation | Male | Female |
| Sales & Related | 2,064 (51.4%) | 1,948 (48.5%) |
| Office & Administration | 1,402 (27.7%) | 3,663 (72.3%) |
| Total (Category) | 3,466 (38.2%) | 5,611 (61.8%) |
| Total (Overall) | 25,074 (50.4%) | 24,654 (49.6%) |
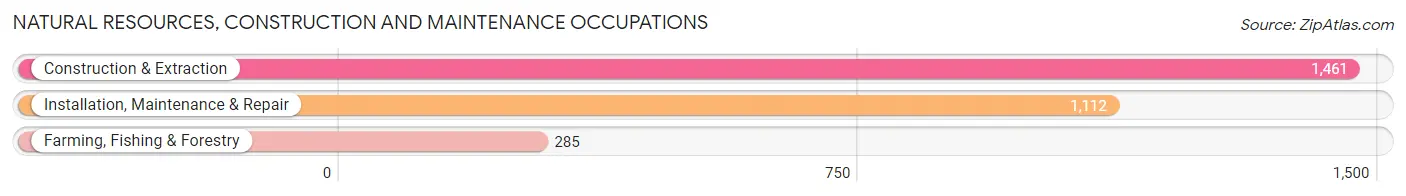
Natural Resources, Construction and Maintenance Occupations
The most common Natural Resources, Construction and Maintenance occupations in Bellingham are Construction & Extraction (1,461 | 2.9%), Installation, Maintenance & Repair (1,112 | 2.2%), and Farming, Fishing & Forestry (285 | 0.6%).
Natural Resources, Construction and Maintenance Occupations by Sex
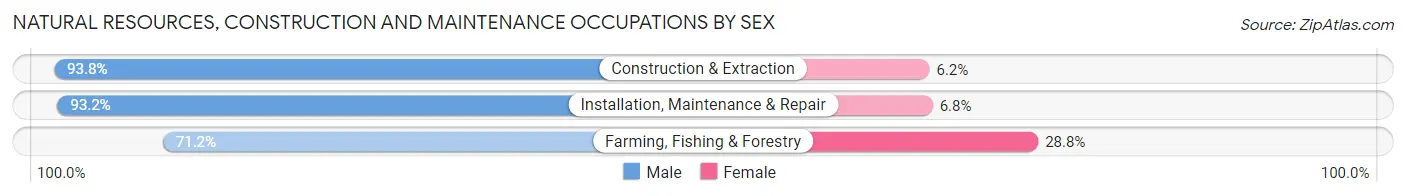
| Occupation | Male | Female |
| Farming, Fishing & Forestry | 203 (71.2%) | 82 (28.8%) |
| Construction & Extraction | 1,371 (93.8%) | 90 (6.2%) |
| Installation, Maintenance & Repair | 1,036 (93.2%) | 76 (6.8%) |
| Total (Category) | 2,610 (91.3%) | 248 (8.7%) |
| Total (Overall) | 25,074 (50.4%) | 24,654 (49.6%) |
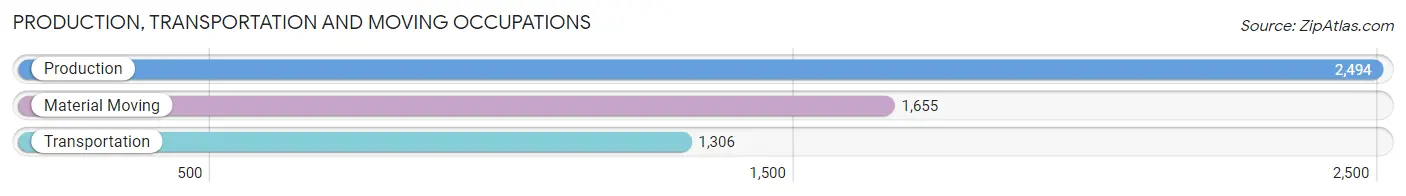
Production, Transportation and Moving Occupations
The most common Production, Transportation and Moving occupations in Bellingham are Production (2,494 | 5.0%), Material Moving (1,655 | 3.3%), and Transportation (1,306 | 2.6%).
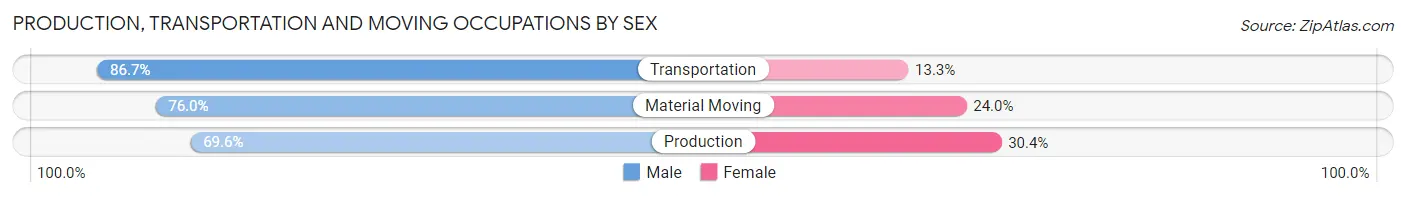
Production, Transportation and Moving Occupations by Sex
| Occupation | Male | Female |
| Production | 1,736 (69.6%) | 758 (30.4%) |
| Transportation | 1,132 (86.7%) | 174 (13.3%) |
| Material Moving | 1,258 (76.0%) | 397 (24.0%) |
| Total (Category) | 4,126 (75.6%) | 1,329 (24.4%) |
| Total (Overall) | 25,074 (50.4%) | 24,654 (49.6%) |
Employment Industries by Sex in Bellingham
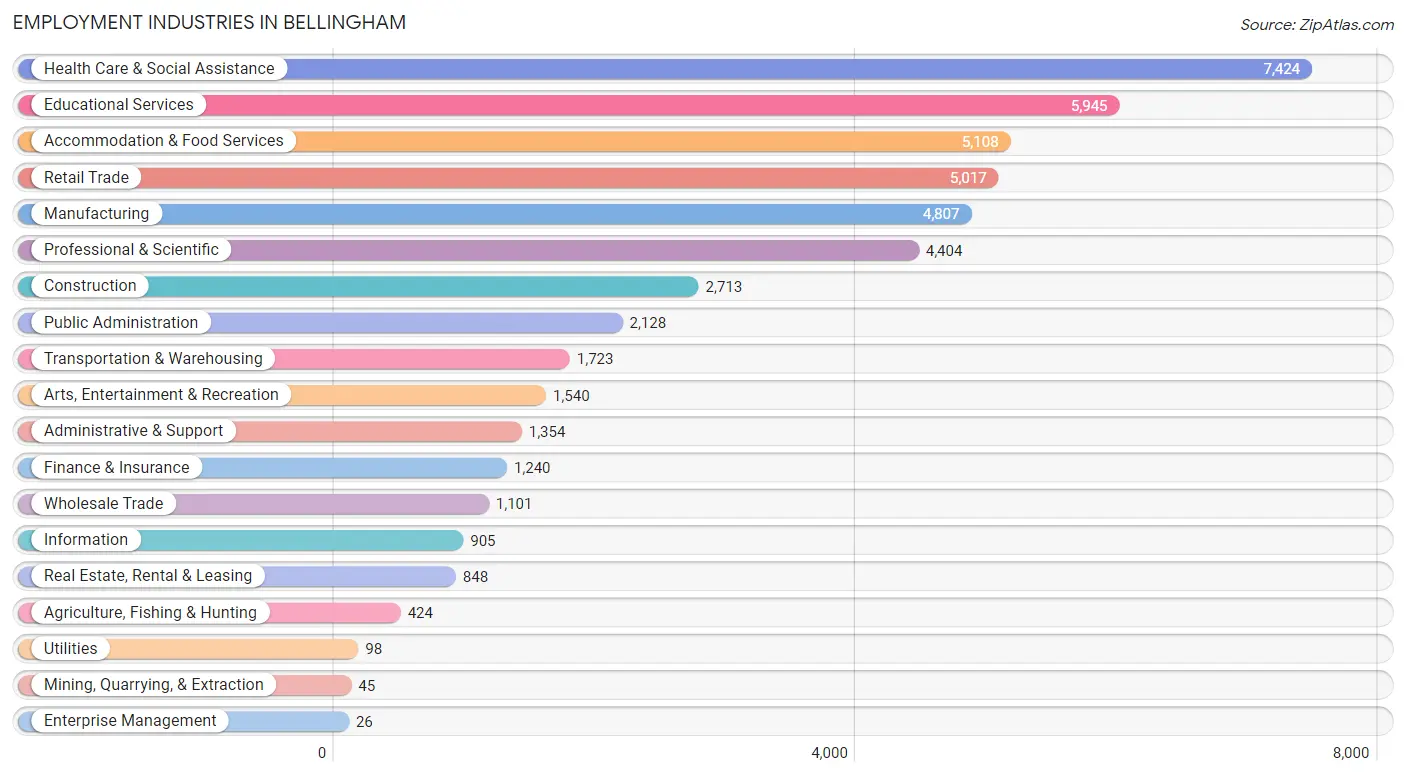
Employment Industries in Bellingham
The major employment industries in Bellingham include Health Care & Social Assistance (7,424 | 14.9%), Educational Services (5,945 | 12.0%), Accommodation & Food Services (5,108 | 10.3%), Retail Trade (5,017 | 10.1%), and Manufacturing (4,807 | 9.7%).
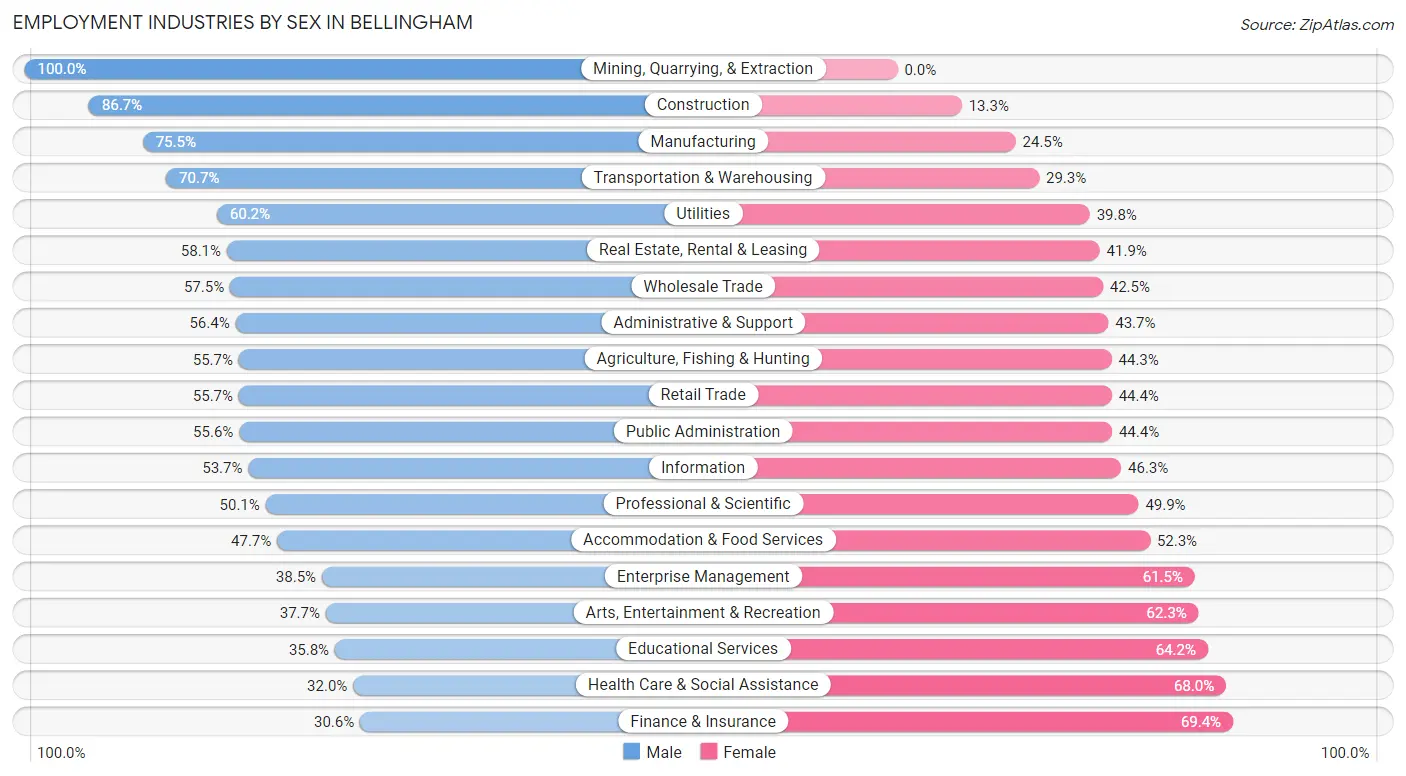
Employment Industries by Sex in Bellingham
The Bellingham industries that see more men than women are Mining, Quarrying, & Extraction (100.0%), Construction (86.7%), and Manufacturing (75.5%), whereas the industries that tend to have a higher number of women are Finance & Insurance (69.4%), Health Care & Social Assistance (68.0%), and Educational Services (64.2%).
| Industry | Male | Female |
| Agriculture, Fishing & Hunting | 236 (55.7%) | 188 (44.3%) |
| Mining, Quarrying, & Extraction | 45 (100.0%) | 0 (0.0%) |
| Construction | 2,352 (86.7%) | 361 (13.3%) |
| Manufacturing | 3,631 (75.5%) | 1,176 (24.5%) |
| Wholesale Trade | 633 (57.5%) | 468 (42.5%) |
| Retail Trade | 2,792 (55.6%) | 2,225 (44.4%) |
| Transportation & Warehousing | 1,218 (70.7%) | 505 (29.3%) |
| Utilities | 59 (60.2%) | 39 (39.8%) |
| Information | 486 (53.7%) | 419 (46.3%) |
| Finance & Insurance | 379 (30.6%) | 861 (69.4%) |
| Real Estate, Rental & Leasing | 493 (58.1%) | 355 (41.9%) |
| Professional & Scientific | 2,207 (50.1%) | 2,197 (49.9%) |
| Enterprise Management | 10 (38.5%) | 16 (61.5%) |
| Administrative & Support | 763 (56.4%) | 591 (43.6%) |
| Educational Services | 2,126 (35.8%) | 3,819 (64.2%) |
| Health Care & Social Assistance | 2,375 (32.0%) | 5,049 (68.0%) |
| Arts, Entertainment & Recreation | 580 (37.7%) | 960 (62.3%) |
| Accommodation & Food Services | 2,438 (47.7%) | 2,670 (52.3%) |
| Public Administration | 1,183 (55.6%) | 945 (44.4%) |
| Total | 25,074 (50.4%) | 24,654 (49.6%) |
Education in Bellingham
School Enrollment in Bellingham
The most common levels of schooling among the 25,681 students in Bellingham are college / undergraduate (14,558 | 56.7%), high school (2,997 | 11.7%), and elementary school (2,965 | 11.6%).
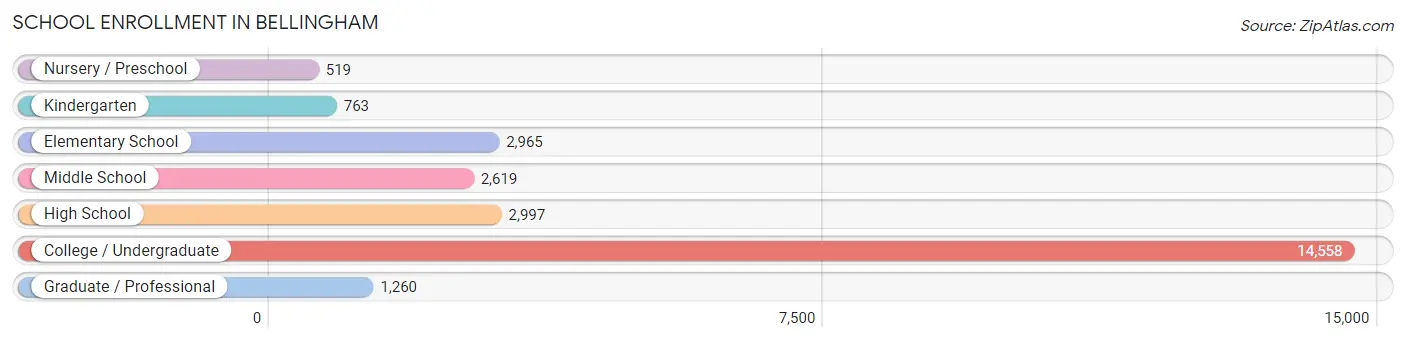
| School Level | # Students | % Students |
| Nursery / Preschool | 519 | 2.0% |
| Kindergarten | 763 | 3.0% |
| Elementary School | 2,965 | 11.6% |
| Middle School | 2,619 | 10.2% |
| High School | 2,997 | 11.7% |
| College / Undergraduate | 14,558 | 56.7% |
| Graduate / Professional | 1,260 | 4.9% |
| Total | 25,681 | 100.0% |
School Enrollment by Age by Funding Source in Bellingham
Out of a total of 25,681 students who are enrolled in schools in Bellingham, 2,183 (8.5%) attend a private institution, while the remaining 23,498 (91.5%) are enrolled in public schools. The age group of 3 to 4 year olds has the highest likelihood of being enrolled in private schools, with 185 (42.1% in the age bracket) enrolled. Conversely, the age group of 18 to 19 year olds has the lowest likelihood of being enrolled in a private school, with 3,856 (98.1% in the age bracket) attending a public institution.
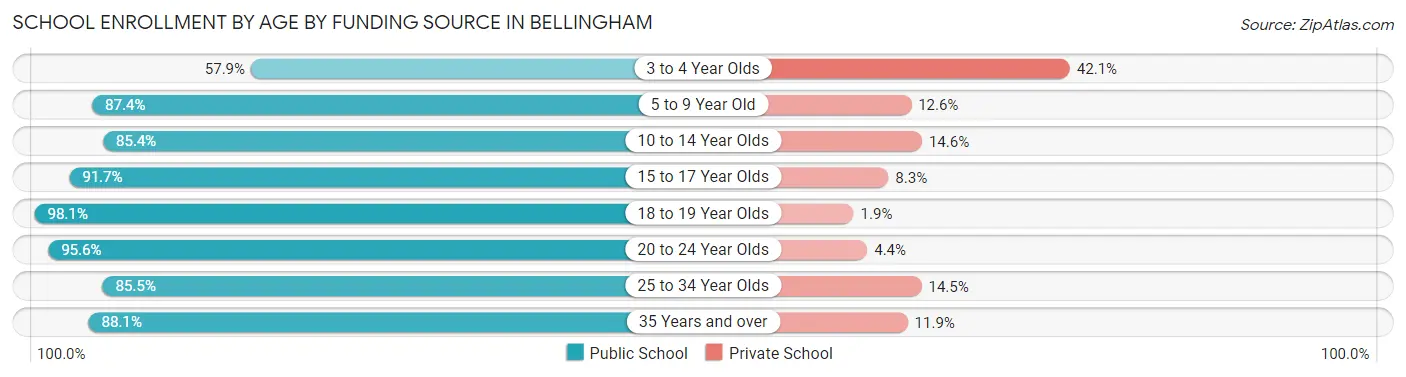
| Age Bracket | Public School | Private School |
| 3 to 4 Year Olds | 254 (57.9%) | 185 (42.1%) |
| 5 to 9 Year Old | 2,871 (87.4%) | 413 (12.6%) |
| 10 to 14 Year Olds | 2,793 (85.4%) | 477 (14.6%) |
| 15 to 17 Year Olds | 2,180 (91.7%) | 198 (8.3%) |
| 18 to 19 Year Olds | 3,856 (98.1%) | 73 (1.9%) |
| 20 to 24 Year Olds | 8,711 (95.6%) | 401 (4.4%) |
| 25 to 34 Year Olds | 1,891 (85.5%) | 321 (14.5%) |
| 35 Years and over | 931 (88.1%) | 126 (11.9%) |
| Total | 23,498 (91.5%) | 2,183 (8.5%) |
Educational Attainment by Field of Study in Bellingham
Social sciences (3,408 | 11.3%), education (3,133 | 10.4%), bio, nature & agricultural (2,967 | 9.8%), business (2,960 | 9.8%), and literature & languages (2,537 | 8.4%) are the most common fields of study among 30,198 individuals in Bellingham who have obtained a bachelor's degree or higher.
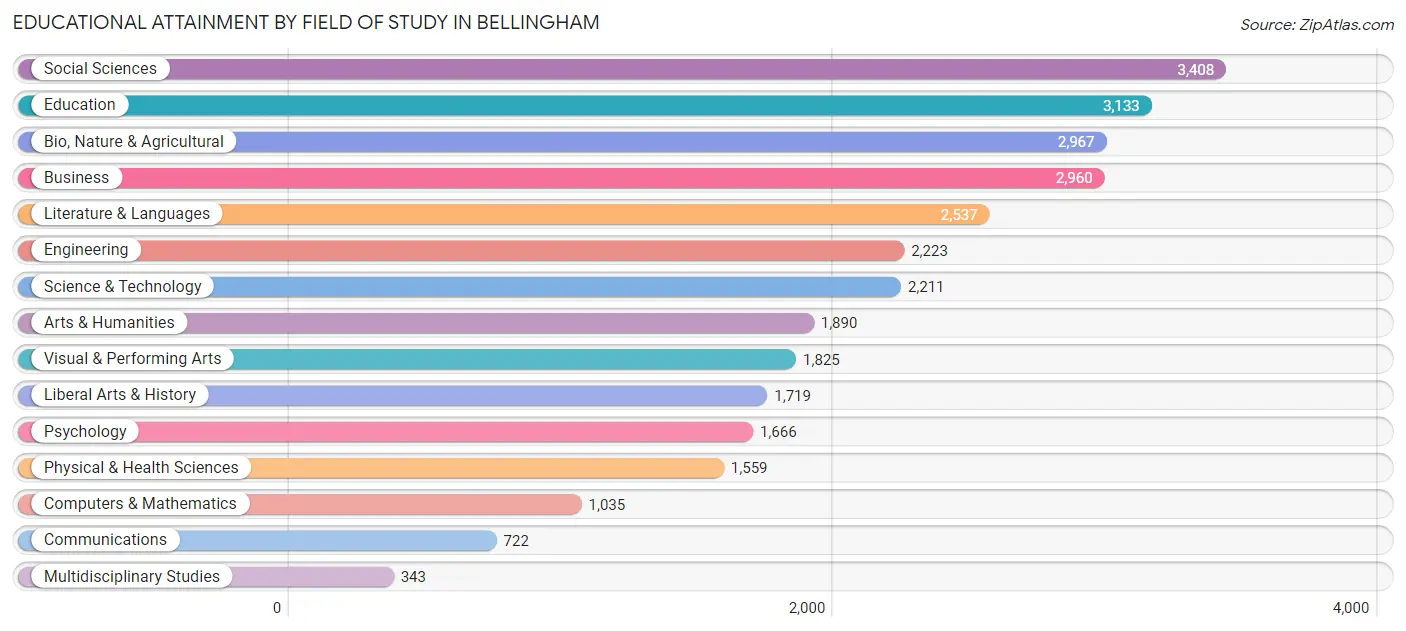
| Field of Study | # Graduates | % Graduates |
| Computers & Mathematics | 1,035 | 3.4% |
| Bio, Nature & Agricultural | 2,967 | 9.8% |
| Physical & Health Sciences | 1,559 | 5.2% |
| Psychology | 1,666 | 5.5% |
| Social Sciences | 3,408 | 11.3% |
| Engineering | 2,223 | 7.4% |
| Multidisciplinary Studies | 343 | 1.1% |
| Science & Technology | 2,211 | 7.3% |
| Business | 2,960 | 9.8% |
| Education | 3,133 | 10.4% |
| Literature & Languages | 2,537 | 8.4% |
| Liberal Arts & History | 1,719 | 5.7% |
| Visual & Performing Arts | 1,825 | 6.0% |
| Communications | 722 | 2.4% |
| Arts & Humanities | 1,890 | 6.3% |
| Total | 30,198 | 100.0% |
Transportation & Commute in Bellingham
Vehicle Availability by Sex in Bellingham
The most prevalent vehicle ownership categories in Bellingham are males with 2 vehicles (10,384, accounting for 42.6%) and females with 2 vehicles (9,361, making up 44.1%).
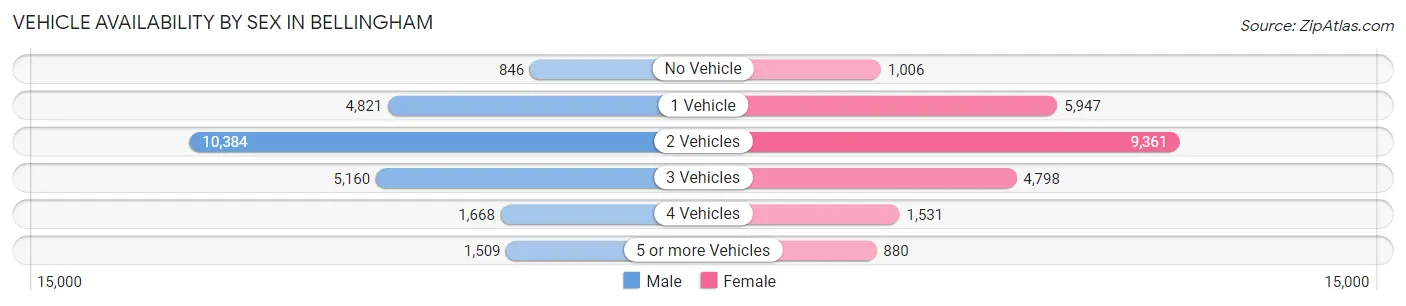
| Vehicles Available | Male | Female |
| No Vehicle | 846 (3.5%) | 1,006 (4.3%) |
| 1 Vehicle | 4,821 (19.8%) | 5,947 (25.3%) |
| 2 Vehicles | 10,384 (42.6%) | 9,361 (39.8%) |
| 3 Vehicles | 5,160 (21.2%) | 4,798 (20.4%) |
| 4 Vehicles | 1,668 (6.8%) | 1,531 (6.5%) |
| 5 or more Vehicles | 1,509 (6.2%) | 880 (3.7%) |
| Total | 24,388 (100.0%) | 23,523 (100.0%) |
Commute Time in Bellingham
The most frequently occuring commute durations in Bellingham are 10 to 14 minutes (10,309 commuters, 24.2%), 15 to 19 minutes (9,711 commuters, 22.8%), and 5 to 9 minutes (7,238 commuters, 17.0%).
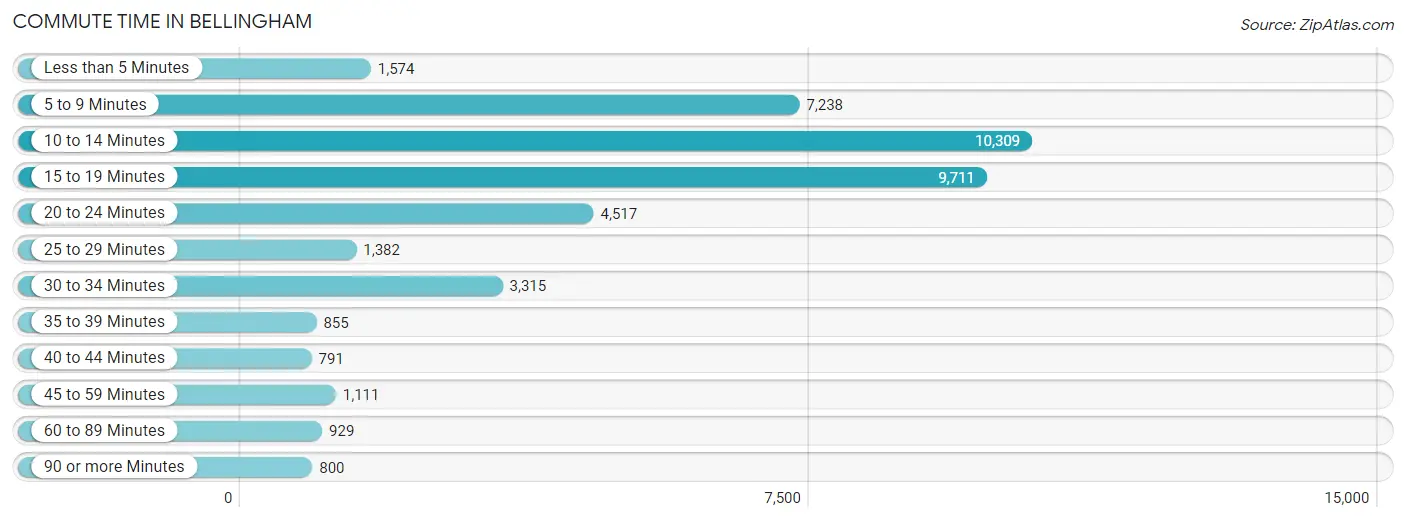
| Commute Time | # Commuters | % Commuters |
| Less than 5 Minutes | 1,574 | 3.7% |
| 5 to 9 Minutes | 7,238 | 17.0% |
| 10 to 14 Minutes | 10,309 | 24.2% |
| 15 to 19 Minutes | 9,711 | 22.8% |
| 20 to 24 Minutes | 4,517 | 10.6% |
| 25 to 29 Minutes | 1,382 | 3.3% |
| 30 to 34 Minutes | 3,315 | 7.8% |
| 35 to 39 Minutes | 855 | 2.0% |
| 40 to 44 Minutes | 791 | 1.9% |
| 45 to 59 Minutes | 1,111 | 2.6% |
| 60 to 89 Minutes | 929 | 2.2% |
| 90 or more Minutes | 800 | 1.9% |
Commute Time by Sex in Bellingham
The most common commute times in Bellingham are 10 to 14 minutes (5,022 commuters, 23.0%) for males and 10 to 14 minutes (5,287 commuters, 25.6%) for females.
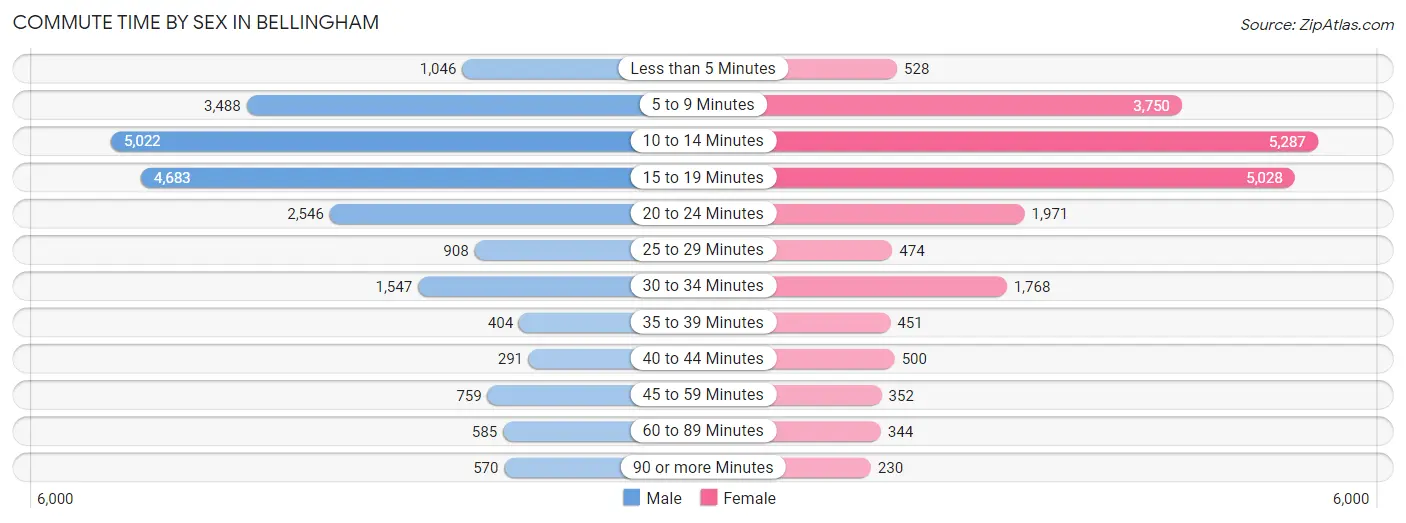
| Commute Time | Male | Female |
| Less than 5 Minutes | 1,046 (4.8%) | 528 (2.5%) |
| 5 to 9 Minutes | 3,488 (16.0%) | 3,750 (18.1%) |
| 10 to 14 Minutes | 5,022 (23.0%) | 5,287 (25.6%) |
| 15 to 19 Minutes | 4,683 (21.4%) | 5,028 (24.3%) |
| 20 to 24 Minutes | 2,546 (11.7%) | 1,971 (9.5%) |
| 25 to 29 Minutes | 908 (4.2%) | 474 (2.3%) |
| 30 to 34 Minutes | 1,547 (7.1%) | 1,768 (8.6%) |
| 35 to 39 Minutes | 404 (1.8%) | 451 (2.2%) |
| 40 to 44 Minutes | 291 (1.3%) | 500 (2.4%) |
| 45 to 59 Minutes | 759 (3.5%) | 352 (1.7%) |
| 60 to 89 Minutes | 585 (2.7%) | 344 (1.7%) |
| 90 or more Minutes | 570 (2.6%) | 230 (1.1%) |
Time of Departure to Work by Sex in Bellingham
The most frequent times of departure to work in Bellingham are 7:30 AM to 7:59 AM (3,612, 16.5%) for males and 7:30 AM to 7:59 AM (3,075, 14.9%) for females.
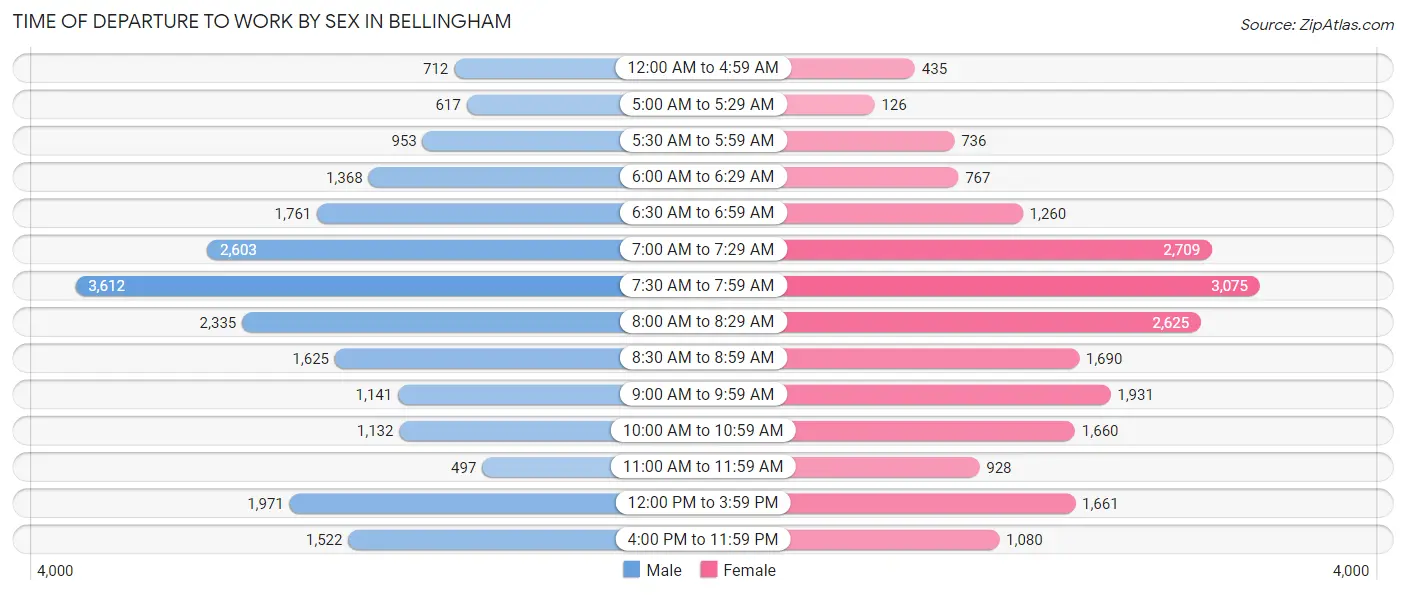
| Time of Departure | Male | Female |
| 12:00 AM to 4:59 AM | 712 (3.3%) | 435 (2.1%) |
| 5:00 AM to 5:29 AM | 617 (2.8%) | 126 (0.6%) |
| 5:30 AM to 5:59 AM | 953 (4.4%) | 736 (3.6%) |
| 6:00 AM to 6:29 AM | 1,368 (6.3%) | 767 (3.7%) |
| 6:30 AM to 6:59 AM | 1,761 (8.1%) | 1,260 (6.1%) |
| 7:00 AM to 7:29 AM | 2,603 (11.9%) | 2,709 (13.1%) |
| 7:30 AM to 7:59 AM | 3,612 (16.5%) | 3,075 (14.9%) |
| 8:00 AM to 8:29 AM | 2,335 (10.7%) | 2,625 (12.7%) |
| 8:30 AM to 8:59 AM | 1,625 (7.4%) | 1,690 (8.2%) |
| 9:00 AM to 9:59 AM | 1,141 (5.2%) | 1,931 (9.3%) |
| 10:00 AM to 10:59 AM | 1,132 (5.2%) | 1,660 (8.0%) |
| 11:00 AM to 11:59 AM | 497 (2.3%) | 928 (4.5%) |
| 12:00 PM to 3:59 PM | 1,971 (9.0%) | 1,661 (8.0%) |
| 4:00 PM to 11:59 PM | 1,522 (7.0%) | 1,080 (5.2%) |
| Total | 21,849 (100.0%) | 20,683 (100.0%) |
Housing Occupancy in Bellingham
Occupancy by Ownership in Bellingham
Of the total 40,085 dwellings in Bellingham, owner-occupied units account for 18,264 (45.6%), while renter-occupied units make up 21,821 (54.4%).
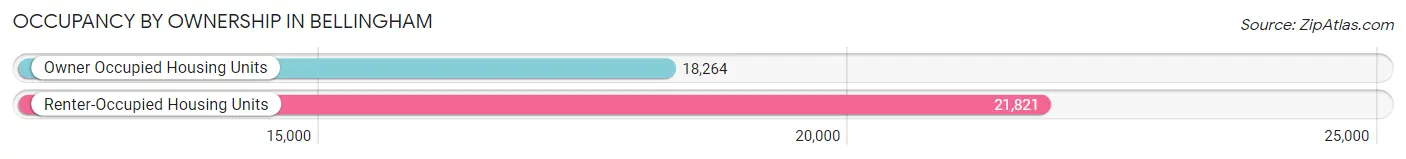
| Occupancy | # Housing Units | % Housing Units |
| Owner Occupied Housing Units | 18,264 | 45.6% |
| Renter-Occupied Housing Units | 21,821 | 54.4% |
| Total Occupied Housing Units | 40,085 | 100.0% |
Occupancy by Household Size in Bellingham
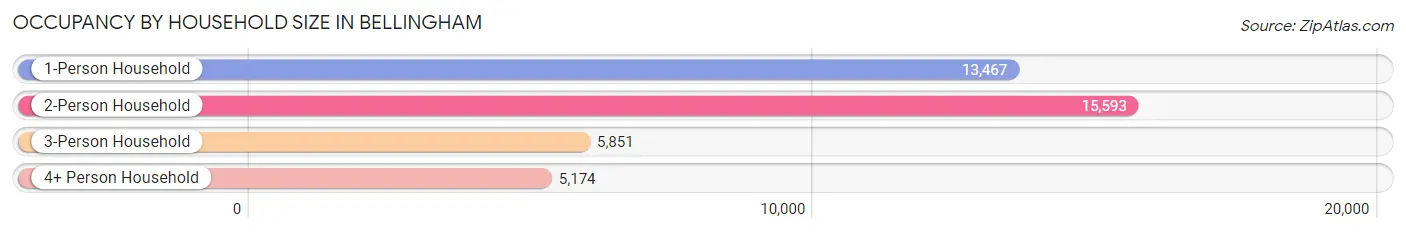
| Household Size | # Housing Units | % Housing Units |
| 1-Person Household | 13,467 | 33.6% |
| 2-Person Household | 15,593 | 38.9% |
| 3-Person Household | 5,851 | 14.6% |
| 4+ Person Household | 5,174 | 12.9% |
| Total Housing Units | 40,085 | 100.0% |
Occupancy by Ownership by Household Size in Bellingham
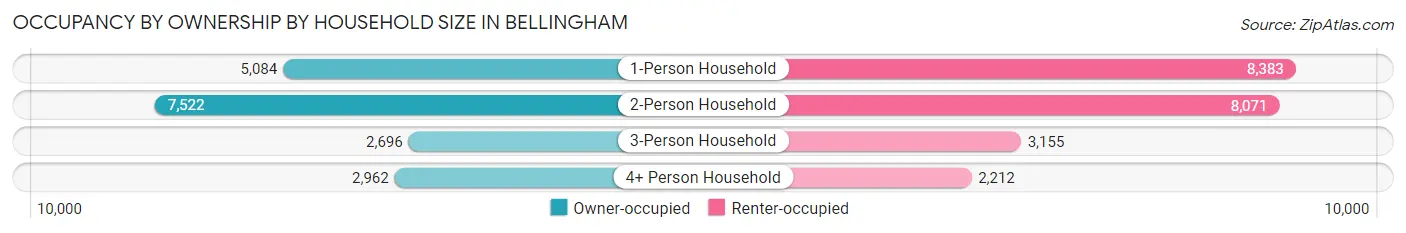
| Household Size | Owner-occupied | Renter-occupied |
| 1-Person Household | 5,084 (37.8%) | 8,383 (62.3%) |
| 2-Person Household | 7,522 (48.2%) | 8,071 (51.8%) |
| 3-Person Household | 2,696 (46.1%) | 3,155 (53.9%) |
| 4+ Person Household | 2,962 (57.3%) | 2,212 (42.7%) |
| Total Housing Units | 18,264 (45.6%) | 21,821 (54.4%) |
Occupancy by Educational Attainment in Bellingham
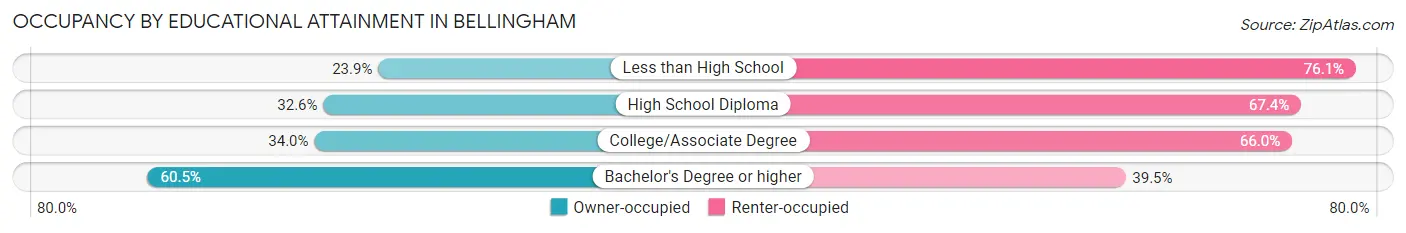
| Household Size | Owner-occupied | Renter-occupied |
| Less than High School | 385 (23.9%) | 1,225 (76.1%) |
| High School Diploma | 1,902 (32.6%) | 3,931 (67.4%) |
| College/Associate Degree | 4,845 (34.0%) | 9,390 (66.0%) |
| Bachelor's Degree or higher | 11,132 (60.5%) | 7,275 (39.5%) |
Occupancy by Age of Householder in Bellingham
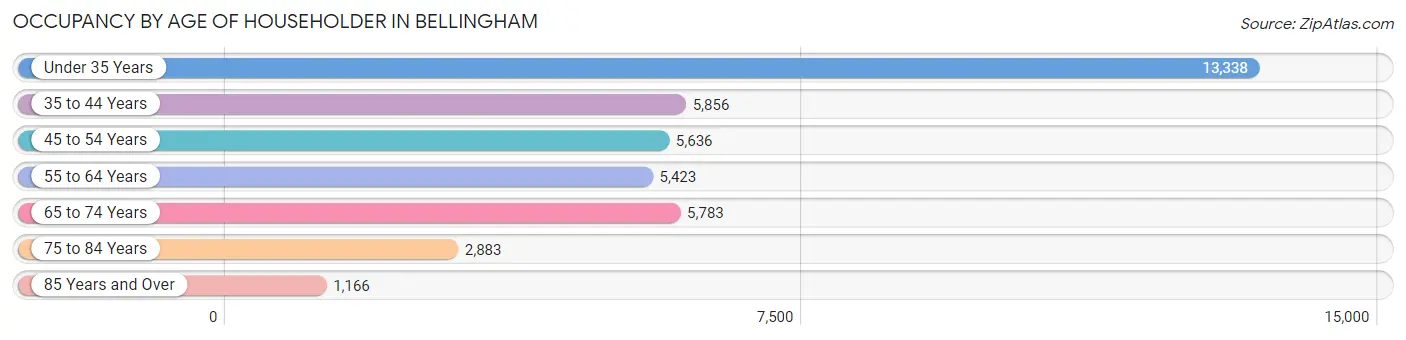
| Age Bracket | # Households | % Households |
| Under 35 Years | 13,338 | 33.3% |
| 35 to 44 Years | 5,856 | 14.6% |
| 45 to 54 Years | 5,636 | 14.1% |
| 55 to 64 Years | 5,423 | 13.5% |
| 65 to 74 Years | 5,783 | 14.4% |
| 75 to 84 Years | 2,883 | 7.2% |
| 85 Years and Over | 1,166 | 2.9% |
| Total | 40,085 | 100.0% |
Housing Finances in Bellingham
Median Income by Occupancy in Bellingham
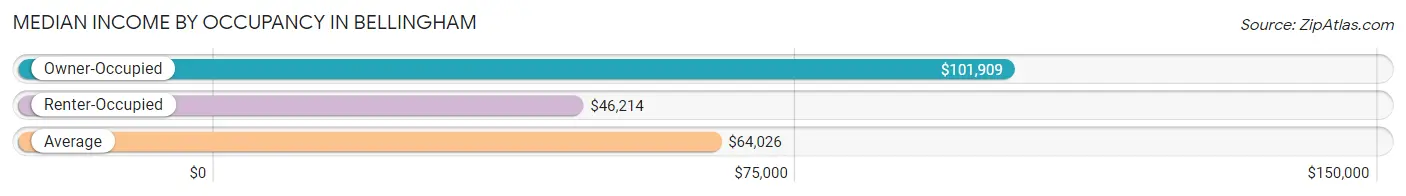
| Occupancy Type | # Households | Median Income |
| Owner-Occupied | 18,264 (45.6%) | $101,909 |
| Renter-Occupied | 21,821 (54.4%) | $46,214 |
| Average | 40,085 (100.0%) | $64,026 |
Occupancy by Householder Income Bracket in Bellingham
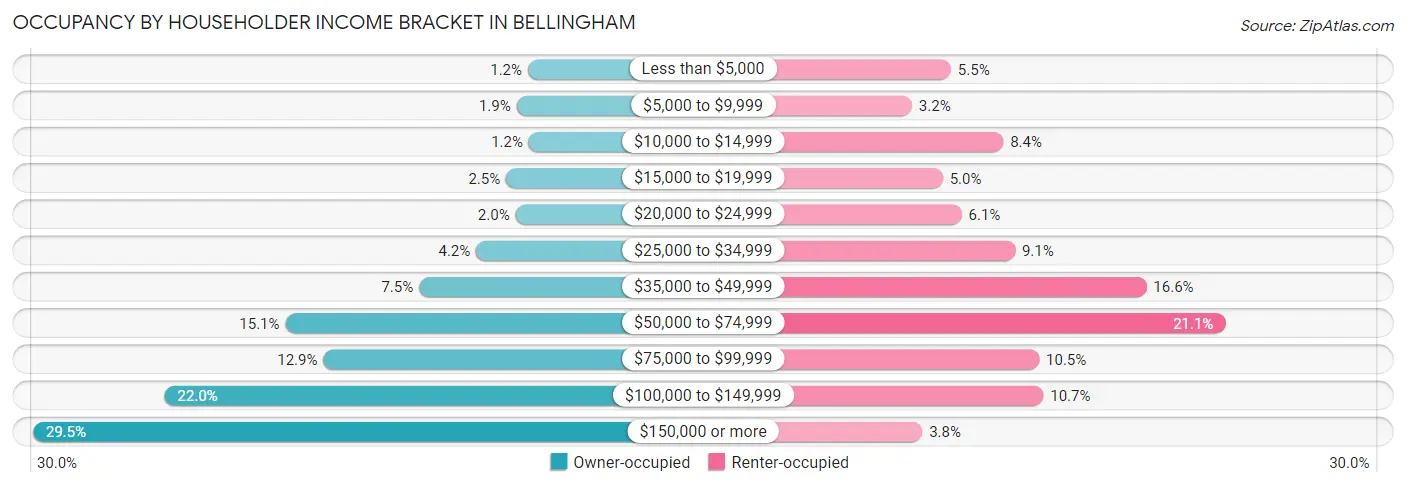
| Income Bracket | Owner-occupied | Renter-occupied |
| Less than $5,000 | 226 (1.2%) | 1,189 (5.4%) |
| $5,000 to $9,999 | 346 (1.9%) | 702 (3.2%) |
| $10,000 to $14,999 | 218 (1.2%) | 1,841 (8.4%) |
| $15,000 to $19,999 | 455 (2.5%) | 1,086 (5.0%) |
| $20,000 to $24,999 | 357 (1.9%) | 1,322 (6.1%) |
| $25,000 to $34,999 | 767 (4.2%) | 1,987 (9.1%) |
| $35,000 to $49,999 | 1,363 (7.5%) | 3,626 (16.6%) |
| $50,000 to $74,999 | 2,758 (15.1%) | 4,608 (21.1%) |
| $75,000 to $99,999 | 2,361 (12.9%) | 2,288 (10.5%) |
| $100,000 to $149,999 | 4,020 (22.0%) | 2,341 (10.7%) |
| $150,000 or more | 5,393 (29.5%) | 831 (3.8%) |
| Total | 18,264 (100.0%) | 21,821 (100.0%) |
Monthly Housing Cost Tiers in Bellingham
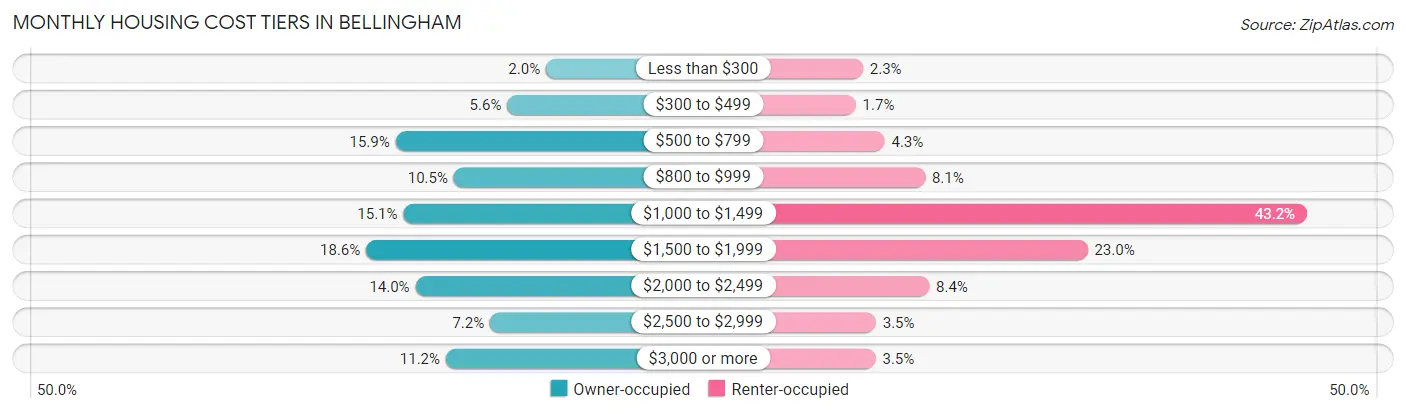
| Monthly Cost | Owner-occupied | Renter-occupied |
| Less than $300 | 366 (2.0%) | 511 (2.3%) |
| $300 to $499 | 1,018 (5.6%) | 366 (1.7%) |
| $500 to $799 | 2,895 (15.9%) | 947 (4.3%) |
| $800 to $999 | 1,916 (10.5%) | 1,758 (8.1%) |
| $1,000 to $1,499 | 2,764 (15.1%) | 9,430 (43.2%) |
| $1,500 to $1,999 | 3,390 (18.6%) | 5,024 (23.0%) |
| $2,000 to $2,499 | 2,561 (14.0%) | 1,841 (8.4%) |
| $2,500 to $2,999 | 1,305 (7.1%) | 771 (3.5%) |
| $3,000 or more | 2,049 (11.2%) | 767 (3.5%) |
| Total | 18,264 (100.0%) | 21,821 (100.0%) |
Physical Housing Characteristics in Bellingham
Housing Structures in Bellingham
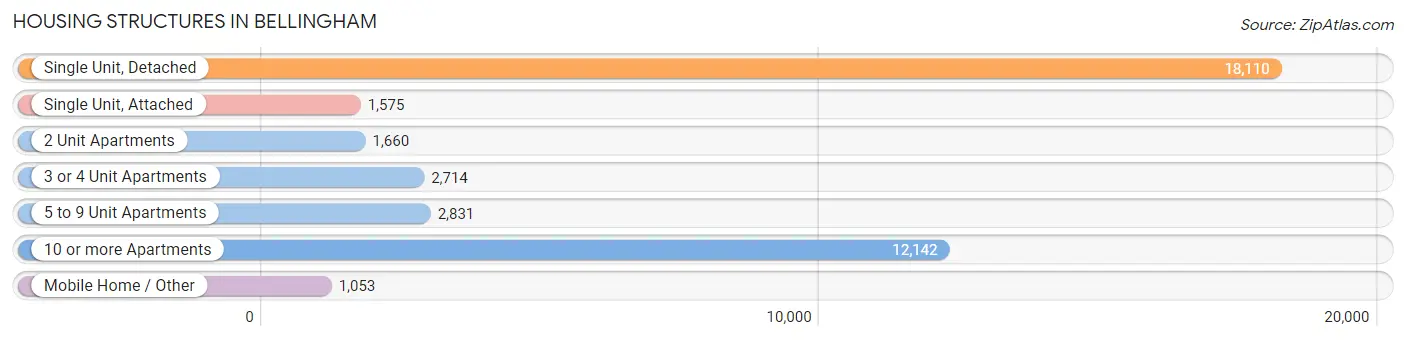
| Structure Type | # Housing Units | % Housing Units |
| Single Unit, Detached | 18,110 | 45.2% |
| Single Unit, Attached | 1,575 | 3.9% |
| 2 Unit Apartments | 1,660 | 4.1% |
| 3 or 4 Unit Apartments | 2,714 | 6.8% |
| 5 to 9 Unit Apartments | 2,831 | 7.1% |
| 10 or more Apartments | 12,142 | 30.3% |
| Mobile Home / Other | 1,053 | 2.6% |
| Total | 40,085 | 100.0% |
Housing Structures by Occupancy in Bellingham
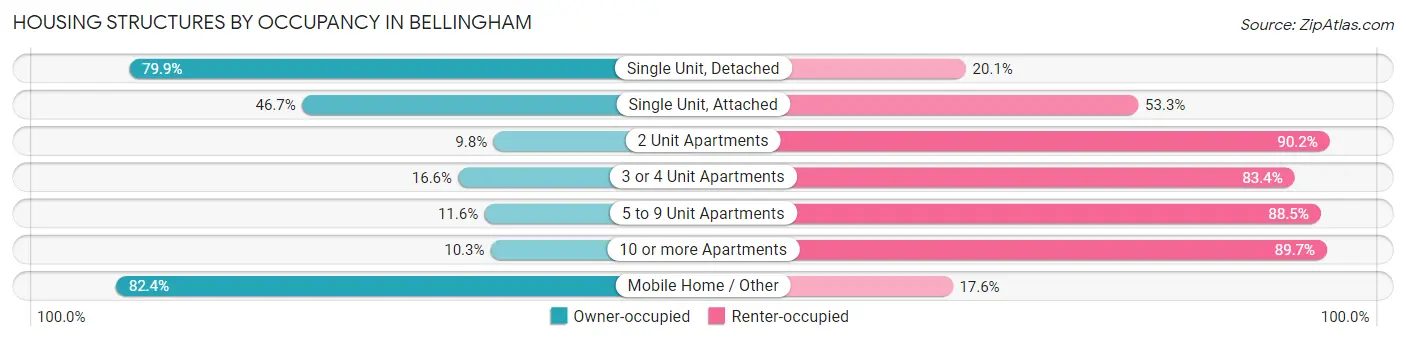
| Structure Type | Owner-occupied | Renter-occupied |
| Single Unit, Detached | 14,466 (79.9%) | 3,644 (20.1%) |
| Single Unit, Attached | 735 (46.7%) | 840 (53.3%) |
| 2 Unit Apartments | 163 (9.8%) | 1,497 (90.2%) |
| 3 or 4 Unit Apartments | 450 (16.6%) | 2,264 (83.4%) |
| 5 to 9 Unit Apartments | 327 (11.6%) | 2,504 (88.4%) |
| 10 or more Apartments | 1,255 (10.3%) | 10,887 (89.7%) |
| Mobile Home / Other | 868 (82.4%) | 185 (17.6%) |
| Total | 18,264 (45.6%) | 21,821 (54.4%) |
Housing Structures by Number of Rooms in Bellingham
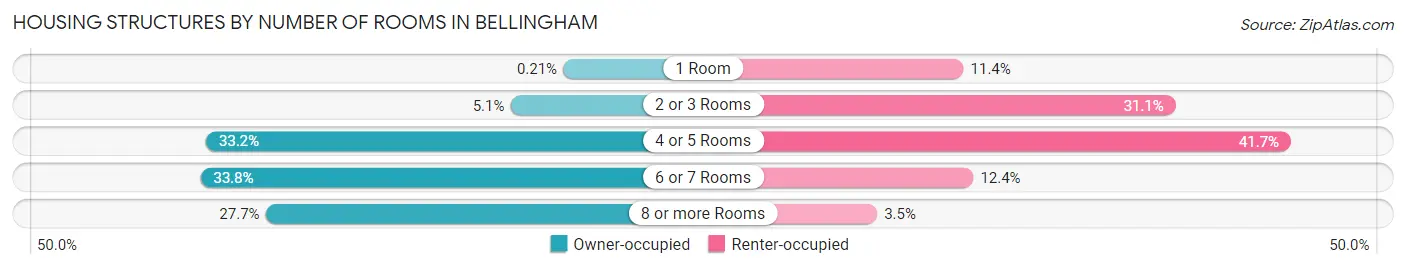
| Number of Rooms | Owner-occupied | Renter-occupied |
| 1 Room | 38 (0.2%) | 2,497 (11.4%) |
| 2 or 3 Rooms | 927 (5.1%) | 6,776 (31.0%) |
| 4 or 5 Rooms | 6,070 (33.2%) | 9,102 (41.7%) |
| 6 or 7 Rooms | 6,164 (33.8%) | 2,694 (12.3%) |
| 8 or more Rooms | 5,065 (27.7%) | 752 (3.5%) |
| Total | 18,264 (100.0%) | 21,821 (100.0%) |
Housing Structure by Heating Type in Bellingham
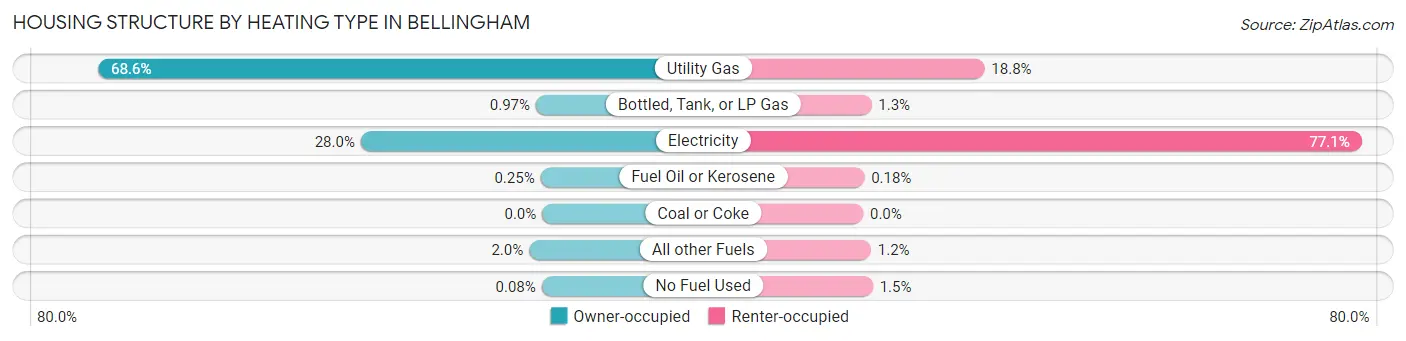
| Heating Type | Owner-occupied | Renter-occupied |
| Utility Gas | 12,537 (68.6%) | 4,094 (18.8%) |
| Bottled, Tank, or LP Gas | 177 (1.0%) | 280 (1.3%) |
| Electricity | 5,121 (28.0%) | 16,815 (77.1%) |
| Fuel Oil or Kerosene | 45 (0.3%) | 40 (0.2%) |
| Coal or Coke | 0 (0.0%) | 0 (0.0%) |
| All other Fuels | 369 (2.0%) | 264 (1.2%) |
| No Fuel Used | 15 (0.1%) | 328 (1.5%) |
| Total | 18,264 (100.0%) | 21,821 (100.0%) |
Household Vehicle Usage in Bellingham
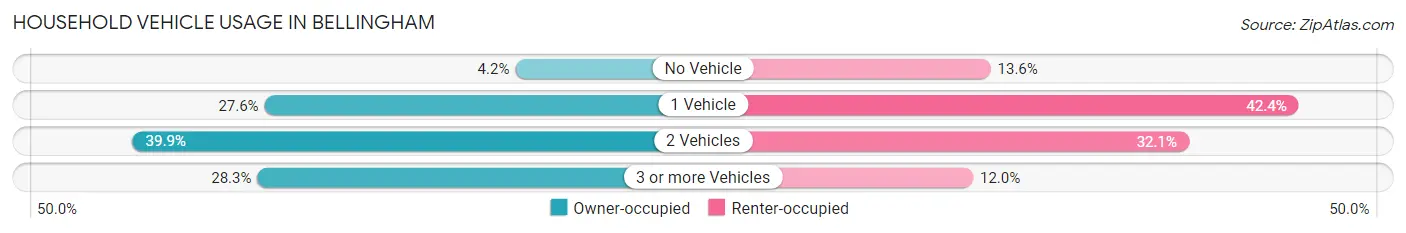
| Vehicles per Household | Owner-occupied | Renter-occupied |
| No Vehicle | 768 (4.2%) | 2,968 (13.6%) |
| 1 Vehicle | 5,042 (27.6%) | 9,242 (42.3%) |
| 2 Vehicles | 7,289 (39.9%) | 7,002 (32.1%) |
| 3 or more Vehicles | 5,165 (28.3%) | 2,609 (12.0%) |
| Total | 18,264 (100.0%) | 21,821 (100.0%) |
Real Estate & Mortgages in Bellingham
Real Estate and Mortgage Overview in Bellingham
| Characteristic | Without Mortgage | With Mortgage |
| Housing Units | 6,972 | 11,292 |
| Median Property Value | $497,500 | $543,000 |
| Median Household Income | $87,500 | $4,012 |
| Monthly Housing Costs | $734 | $2,041 |
| Real Estate Taxes | $3,824 | $131 |
Property Value by Mortgage Status in Bellingham
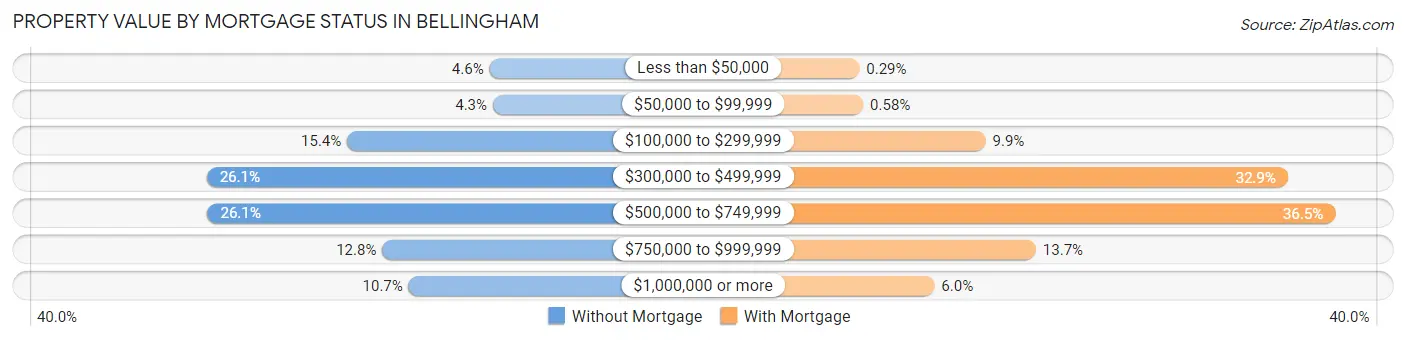
| Property Value | Without Mortgage | With Mortgage |
| Less than $50,000 | 319 (4.6%) | 33 (0.3%) |
| $50,000 to $99,999 | 301 (4.3%) | 65 (0.6%) |
| $100,000 to $299,999 | 1,076 (15.4%) | 1,119 (9.9%) |
| $300,000 to $499,999 | 1,821 (26.1%) | 3,719 (32.9%) |
| $500,000 to $749,999 | 1,817 (26.1%) | 4,126 (36.5%) |
| $750,000 to $999,999 | 889 (12.8%) | 1,551 (13.7%) |
| $1,000,000 or more | 749 (10.7%) | 679 (6.0%) |
| Total | 6,972 (100.0%) | 11,292 (100.0%) |
Household Income by Mortgage Status in Bellingham
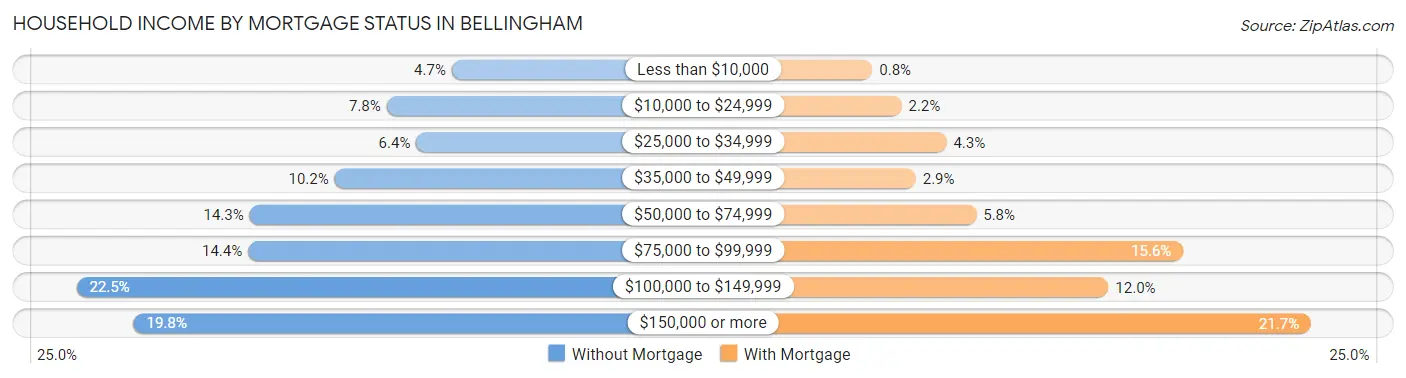
| Household Income | Without Mortgage | With Mortgage |
| Less than $10,000 | 325 (4.7%) | 90 (0.8%) |
| $10,000 to $24,999 | 541 (7.8%) | 247 (2.2%) |
| $25,000 to $34,999 | 443 (6.4%) | 489 (4.3%) |
| $35,000 to $49,999 | 714 (10.2%) | 324 (2.9%) |
| $50,000 to $74,999 | 996 (14.3%) | 649 (5.8%) |
| $75,000 to $99,999 | 1,001 (14.4%) | 1,762 (15.6%) |
| $100,000 to $149,999 | 1,571 (22.5%) | 1,360 (12.0%) |
| $150,000 or more | 1,381 (19.8%) | 2,449 (21.7%) |
| Total | 6,972 (100.0%) | 11,292 (100.0%) |
Property Value to Household Income Ratio in Bellingham
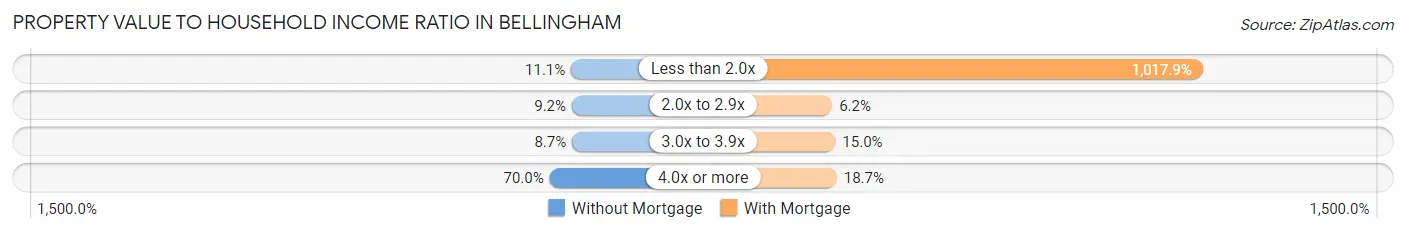
| Value-to-Income Ratio | Without Mortgage | With Mortgage |
| Less than 2.0x | 776 (11.1%) | 114,944 (1,017.9%) |
| 2.0x to 2.9x | 639 (9.2%) | 705 (6.2%) |
| 3.0x to 3.9x | 607 (8.7%) | 1,691 (15.0%) |
| 4.0x or more | 4,879 (70.0%) | 2,106 (18.6%) |
| Total | 6,972 (100.0%) | 11,292 (100.0%) |
Real Estate Taxes by Mortgage Status in Bellingham
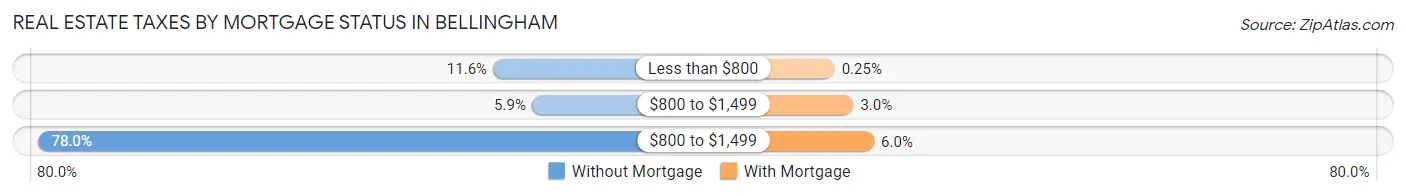
| Property Taxes | Without Mortgage | With Mortgage |
| Less than $800 | 807 (11.6%) | 28 (0.3%) |
| $800 to $1,499 | 411 (5.9%) | 338 (3.0%) |
| $800 to $1,499 | 5,435 (77.9%) | 679 (6.0%) |
| Total | 6,972 (100.0%) | 11,292 (100.0%) |
Health & Disability in Bellingham
Health Insurance Coverage by Age in Bellingham
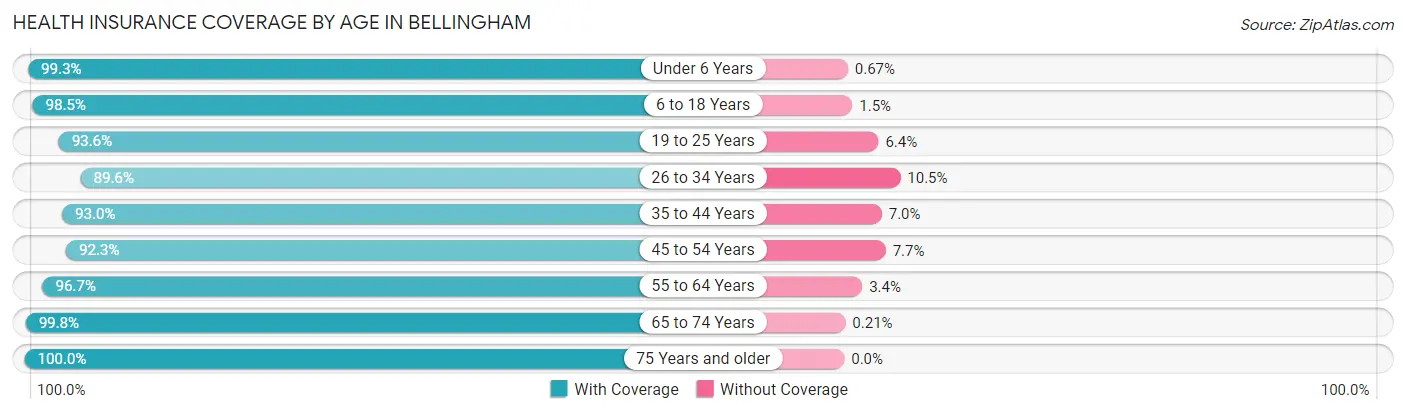
| Age Bracket | With Coverage | Without Coverage |
| Under 6 Years | 3,585 (99.3%) | 24 (0.7%) |
| 6 to 18 Years | 10,474 (98.5%) | 159 (1.5%) |
| 19 to 25 Years | 18,968 (93.6%) | 1,290 (6.4%) |
| 26 to 34 Years | 11,270 (89.5%) | 1,315 (10.4%) |
| 35 to 44 Years | 9,545 (93.0%) | 717 (7.0%) |
| 45 to 54 Years | 8,405 (92.3%) | 704 (7.7%) |
| 55 to 64 Years | 8,823 (96.7%) | 306 (3.4%) |
| 65 to 74 Years | 8,727 (99.8%) | 18 (0.2%) |
| 75 Years and older | 5,822 (100.0%) | 0 (0.0%) |
| Total | 85,619 (95.0%) | 4,533 (5.0%) |
Health Insurance Coverage by Citizenship Status in Bellingham
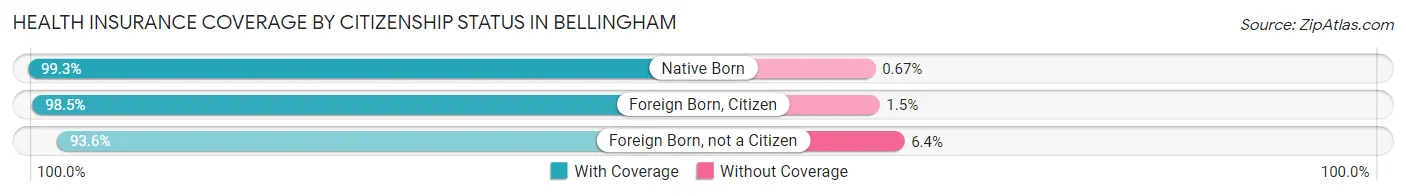
| Citizenship Status | With Coverage | Without Coverage |
| Native Born | 3,585 (99.3%) | 24 (0.7%) |
| Foreign Born, Citizen | 10,474 (98.5%) | 159 (1.5%) |
| Foreign Born, not a Citizen | 18,968 (93.6%) | 1,290 (6.4%) |
Health Insurance Coverage by Household Income in Bellingham
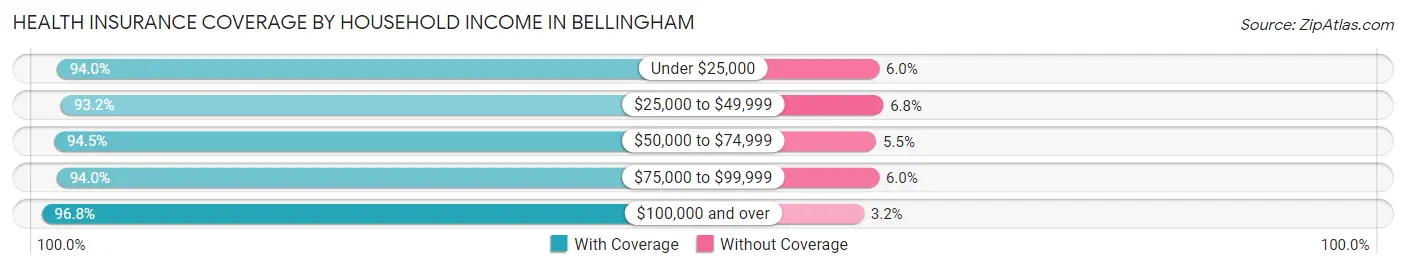
| Household Income | With Coverage | Without Coverage |
| Under $25,000 | 11,162 (94.0%) | 718 (6.0%) |
| $25,000 to $49,999 | 13,838 (93.2%) | 1,015 (6.8%) |
| $50,000 to $74,999 | 14,136 (94.5%) | 823 (5.5%) |
| $75,000 to $99,999 | 9,728 (94.0%) | 623 (6.0%) |
| $100,000 and over | 33,894 (96.8%) | 1,121 (3.2%) |
Public vs Private Health Insurance Coverage by Age in Bellingham
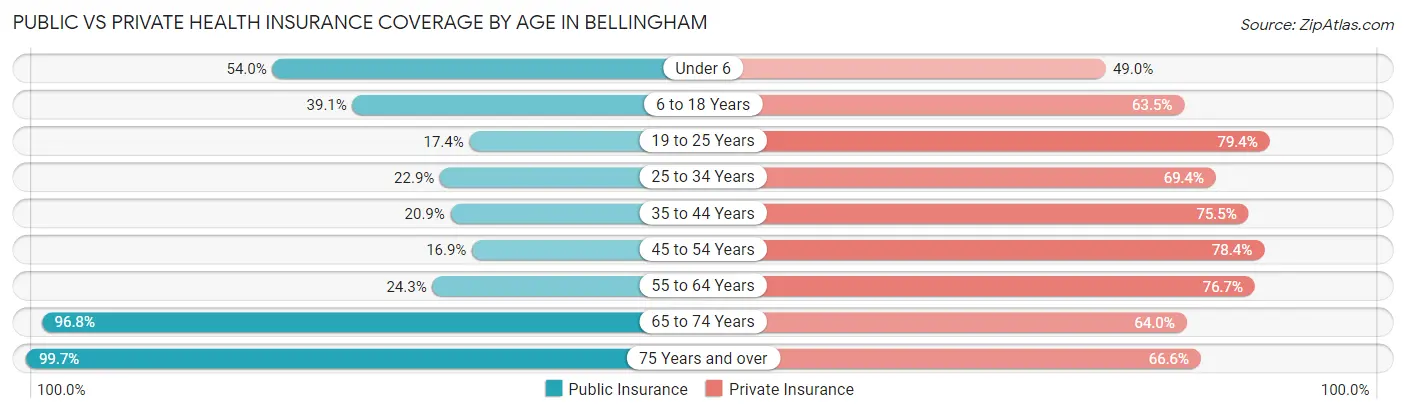
| Age Bracket | Public Insurance | Private Insurance |
| Under 6 | 1,948 (54.0%) | 1,770 (49.0%) |
| 6 to 18 Years | 4,160 (39.1%) | 6,756 (63.5%) |
| 19 to 25 Years | 3,526 (17.4%) | 16,082 (79.4%) |
| 25 to 34 Years | 2,878 (22.9%) | 8,736 (69.4%) |
| 35 to 44 Years | 2,148 (20.9%) | 7,748 (75.5%) |
| 45 to 54 Years | 1,541 (16.9%) | 7,138 (78.4%) |
| 55 to 64 Years | 2,217 (24.3%) | 6,998 (76.7%) |
| 65 to 74 Years | 8,469 (96.8%) | 5,596 (64.0%) |
| 75 Years and over | 5,807 (99.7%) | 3,880 (66.6%) |
| Total | 32,694 (36.3%) | 64,704 (71.8%) |
Disability Status by Sex by Age in Bellingham
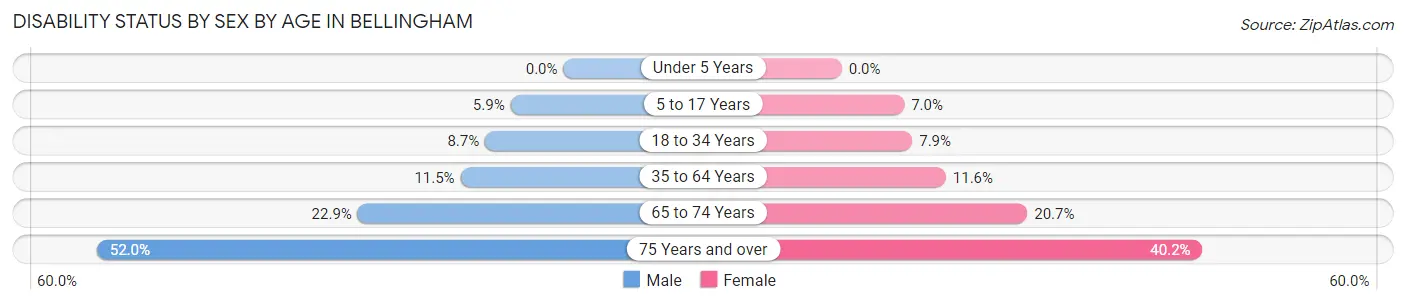
| Age Bracket | Male | Female |
| Under 5 Years | 0 (0.0%) | 0 (0.0%) |
| 5 to 17 Years | 263 (5.9%) | 336 (7.0%) |
| 18 to 34 Years | 1,506 (8.7%) | 1,371 (7.9%) |
| 35 to 64 Years | 1,600 (11.5%) | 1,685 (11.6%) |
| 65 to 74 Years | 929 (22.9%) | 969 (20.7%) |
| 75 Years and over | 1,154 (52.0%) | 1,446 (40.2%) |
Disability Class by Sex by Age in Bellingham
Disability Class: Hearing Difficulty
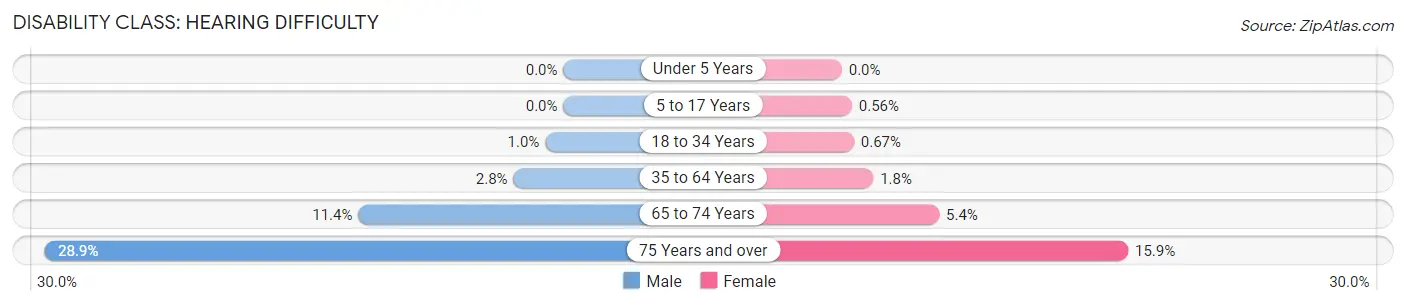
| Age Bracket | Male | Female |
| Under 5 Years | 0 (0.0%) | 0 (0.0%) |
| 5 to 17 Years | 0 (0.0%) | 27 (0.6%) |
| 18 to 34 Years | 175 (1.0%) | 117 (0.7%) |
| 35 to 64 Years | 388 (2.8%) | 254 (1.8%) |
| 65 to 74 Years | 463 (11.4%) | 254 (5.4%) |
| 75 Years and over | 641 (28.9%) | 574 (15.9%) |
Disability Class: Vision Difficulty
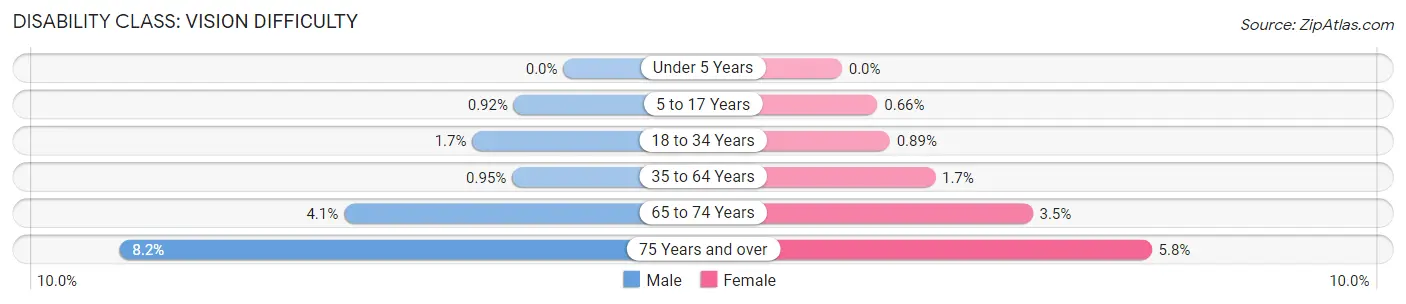
| Age Bracket | Male | Female |
| Under 5 Years | 0 (0.0%) | 0 (0.0%) |
| 5 to 17 Years | 41 (0.9%) | 32 (0.7%) |
| 18 to 34 Years | 291 (1.7%) | 155 (0.9%) |
| 35 to 64 Years | 133 (0.9%) | 252 (1.7%) |
| 65 to 74 Years | 165 (4.1%) | 166 (3.5%) |
| 75 Years and over | 183 (8.2%) | 207 (5.8%) |
Disability Class: Cognitive Difficulty
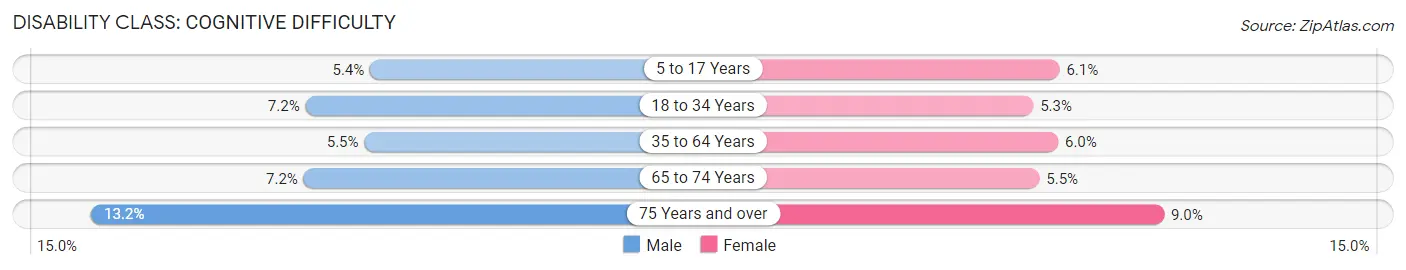
| Age Bracket | Male | Female |
| 5 to 17 Years | 240 (5.4%) | 293 (6.1%) |
| 18 to 34 Years | 1,240 (7.2%) | 931 (5.3%) |
| 35 to 64 Years | 773 (5.5%) | 876 (6.0%) |
| 65 to 74 Years | 293 (7.2%) | 258 (5.5%) |
| 75 Years and over | 292 (13.2%) | 323 (9.0%) |
Disability Class: Ambulatory Difficulty
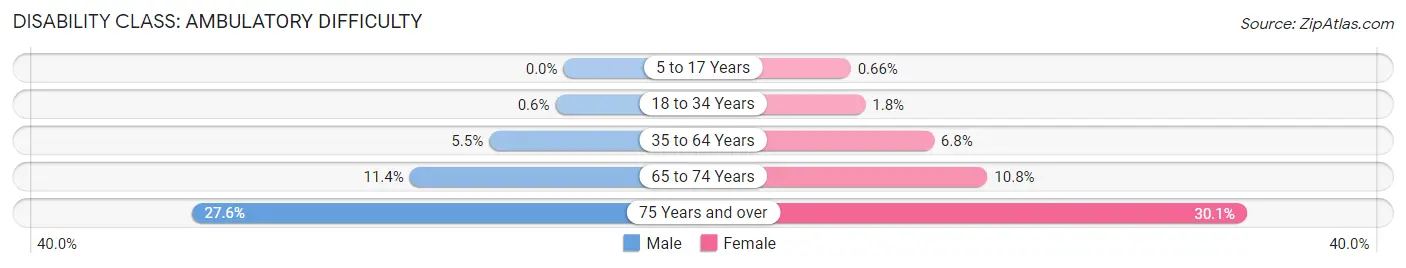
| Age Bracket | Male | Female |
| 5 to 17 Years | 0 (0.0%) | 32 (0.7%) |
| 18 to 34 Years | 103 (0.6%) | 306 (1.8%) |
| 35 to 64 Years | 770 (5.5%) | 994 (6.8%) |
| 65 to 74 Years | 463 (11.4%) | 507 (10.8%) |
| 75 Years and over | 613 (27.6%) | 1,082 (30.0%) |
Disability Class: Self-Care Difficulty
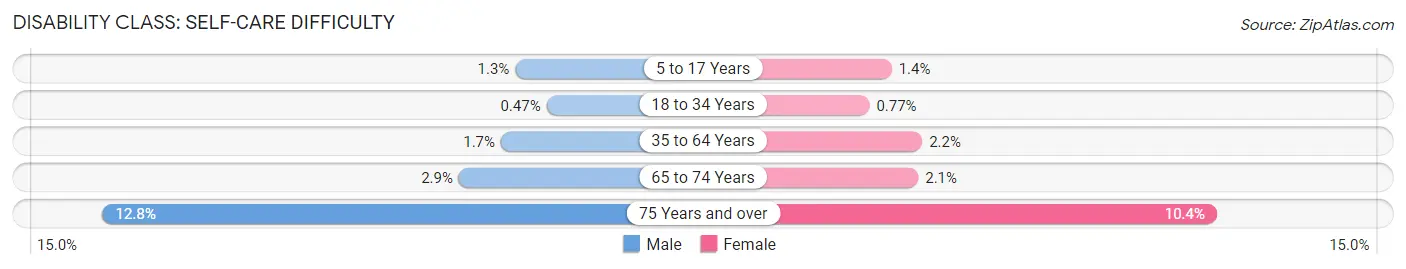
| Age Bracket | Male | Female |
| 5 to 17 Years | 60 (1.3%) | 67 (1.4%) |
| 18 to 34 Years | 81 (0.5%) | 134 (0.8%) |
| 35 to 64 Years | 243 (1.7%) | 326 (2.2%) |
| 65 to 74 Years | 118 (2.9%) | 100 (2.1%) |
| 75 Years and over | 285 (12.8%) | 376 (10.4%) |
Technology Access in Bellingham
Computing Device Access in Bellingham
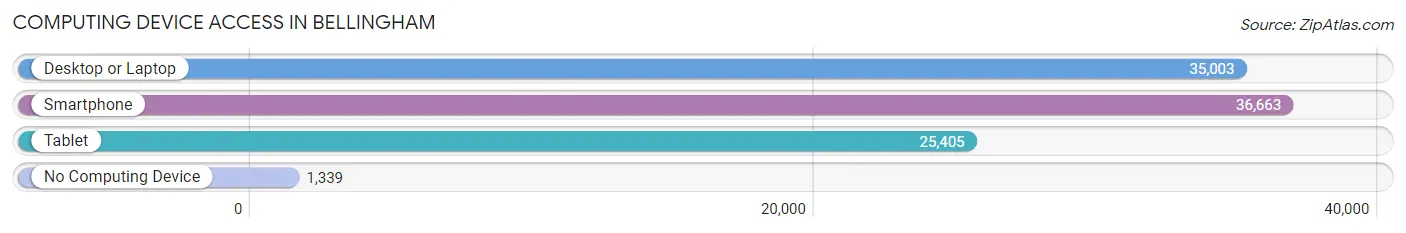
| Device Type | # Households | % Households |
| Desktop or Laptop | 35,003 | 87.3% |
| Smartphone | 36,663 | 91.5% |
| Tablet | 25,405 | 63.4% |
| No Computing Device | 1,339 | 3.3% |
| Total | 40,085 | 100.0% |
Internet Access in Bellingham
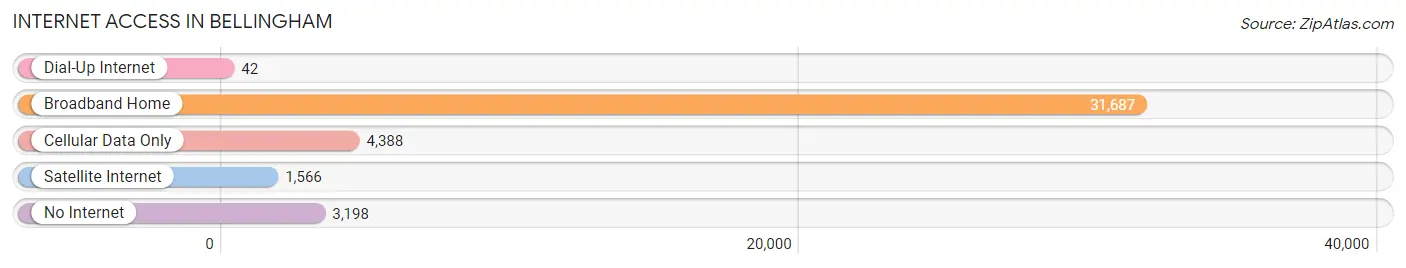
| Internet Type | # Households | % Households |
| Dial-Up Internet | 42 | 0.1% |
| Broadband Home | 31,687 | 79.0% |
| Cellular Data Only | 4,388 | 11.0% |
| Satellite Internet | 1,566 | 3.9% |
| No Internet | 3,198 | 8.0% |
| Total | 40,085 | 100.0% |
Bellingham Summary
Bellingham, Washington is a city located in the northwest corner of the United States, in Whatcom County. It is the county seat and the largest city in the county, with a population of approximately 80,000 people. Bellingham is situated on Bellingham Bay, which is part of the Salish Sea, and is surrounded by the Cascade Mountains to the east and the Olympic Mountains to the west. The city is known for its natural beauty, outdoor recreation opportunities, and vibrant arts and culture scene.
History
The area that is now Bellingham was first inhabited by the Lummi and Nooksack Native American tribes. The first European settlers arrived in the area in the late 1800s, and the city was officially incorporated in 1903. The city was named after George Vancouver’s assistant, William Bellingham, who explored the area in 1792.
In the early 1900s, Bellingham was a major lumber and fishing port, and the city’s economy was largely based on these industries. In the mid-1900s, the city’s economy shifted to focus on manufacturing, and the city became home to several large companies, including Georgia-Pacific and Alcoa.
In the late 1900s, the city’s economy shifted again to focus on technology and services. The city is now home to several large technology companies, including Microsoft, Amazon, and Google.
Geography
Bellingham is located in the northwest corner of the United States, in Whatcom County. It is situated on Bellingham Bay, which is part of the Salish Sea, and is surrounded by the Cascade Mountains to the east and the Olympic Mountains to the west. The city is located approximately 90 miles north of Seattle and 60 miles south of Vancouver, British Columbia.
The city has a total area of 27.5 square miles, of which 24.3 square miles is land and 3.2 square miles is water. The city is located at an elevation of approximately 20 feet above sea level.
Economy
Bellingham’s economy is largely based on technology, services, and tourism. The city is home to several large technology companies, including Microsoft, Amazon, and Google. The city is also home to several large service-based companies, including PeaceHealth and Western Washington University.
The city’s tourism industry is also a major contributor to the local economy. Bellingham is known for its natural beauty, outdoor recreation opportunities, and vibrant arts and culture scene. The city is home to several popular attractions, including the Whatcom Museum, the Bellingham Cruise Terminal, and the Bellingham International Airport.
Demographics
As of the 2020 census, the population of Bellingham was approximately 80,000 people. The city has a diverse population, with the largest racial/ethnic groups being White (63.2%), Hispanic or Latino (14.2%), Asian (9.2%), and Black or African American (4.2%).
The median household income in Bellingham is $60,845, and the median home value is $372,400. The city has a high rate of homeownership, with approximately 63% of residents owning their homes.
Bellingham is a vibrant and diverse city with a rich history and a bright future. The city’s economy is largely based on technology, services, and tourism, and the city is home to several large companies and popular attractions. The city has a diverse population and a high rate of homeownership, and is known for its natural beauty, outdoor recreation opportunities, and vibrant arts and culture scene.
Common Questions
What is Per Capita Income in Bellingham?
Per Capita income in Bellingham is $40,287.
What is the Median Family Income in Bellingham?
Median Family Income in Bellingham is $100,228.
What is the Median Household income in Bellingham?
Median Household Income in Bellingham is $64,026.
What is Income or Wage Gap in Bellingham?
Income or Wage Gap in Bellingham is 27.3%.
Women in Bellingham earn 72.7 cents for every dollar earned by a man.
What is Family Income Deficit in Bellingham?
Family Income Deficit in Bellingham is $9,486.
Families that are below poverty line in Bellingham earn $9,486 less on average than the poverty threshold level.
What is Inequality or Gini Index in Bellingham?
Inequality or Gini Index in Bellingham is 0.47.
What is the Total Population of Bellingham?
Total Population of Bellingham is 91,353.
What is the Total Male Population of Bellingham?
Total Male Population of Bellingham is 44,130.
What is the Total Female Population of Bellingham?
Total Female Population of Bellingham is 47,223.
What is the Ratio of Males per 100 Females in Bellingham?
There are 93.45 Males per 100 Females in Bellingham.
What is the Ratio of Females per 100 Males in Bellingham?
There are 107.01 Females per 100 Males in Bellingham.
What is the Median Population Age in Bellingham?
Median Population Age in Bellingham is 33.7 Years.
What is the Average Family Size in Bellingham
Average Family Size in Bellingham is 2.8 People.
What is the Average Household Size in Bellingham
Average Household Size in Bellingham is 2.2 People.
How Large is the Labor Force in Bellingham?
There are 52,467 People in the Labor Forcein in Bellingham.
What is the Percentage of People in the Labor Force in Bellingham?
65.3% of People are in the Labor Force in Bellingham.
What is the Unemployment Rate in Bellingham?
Unemployment Rate in Bellingham is 4.8%.