Cities with the Highest Percentage of Indian (Asian) Population in Illinois
RELATED REPORTS & OPTIONS
Indian (Asian)
Illinois
Compare Cities
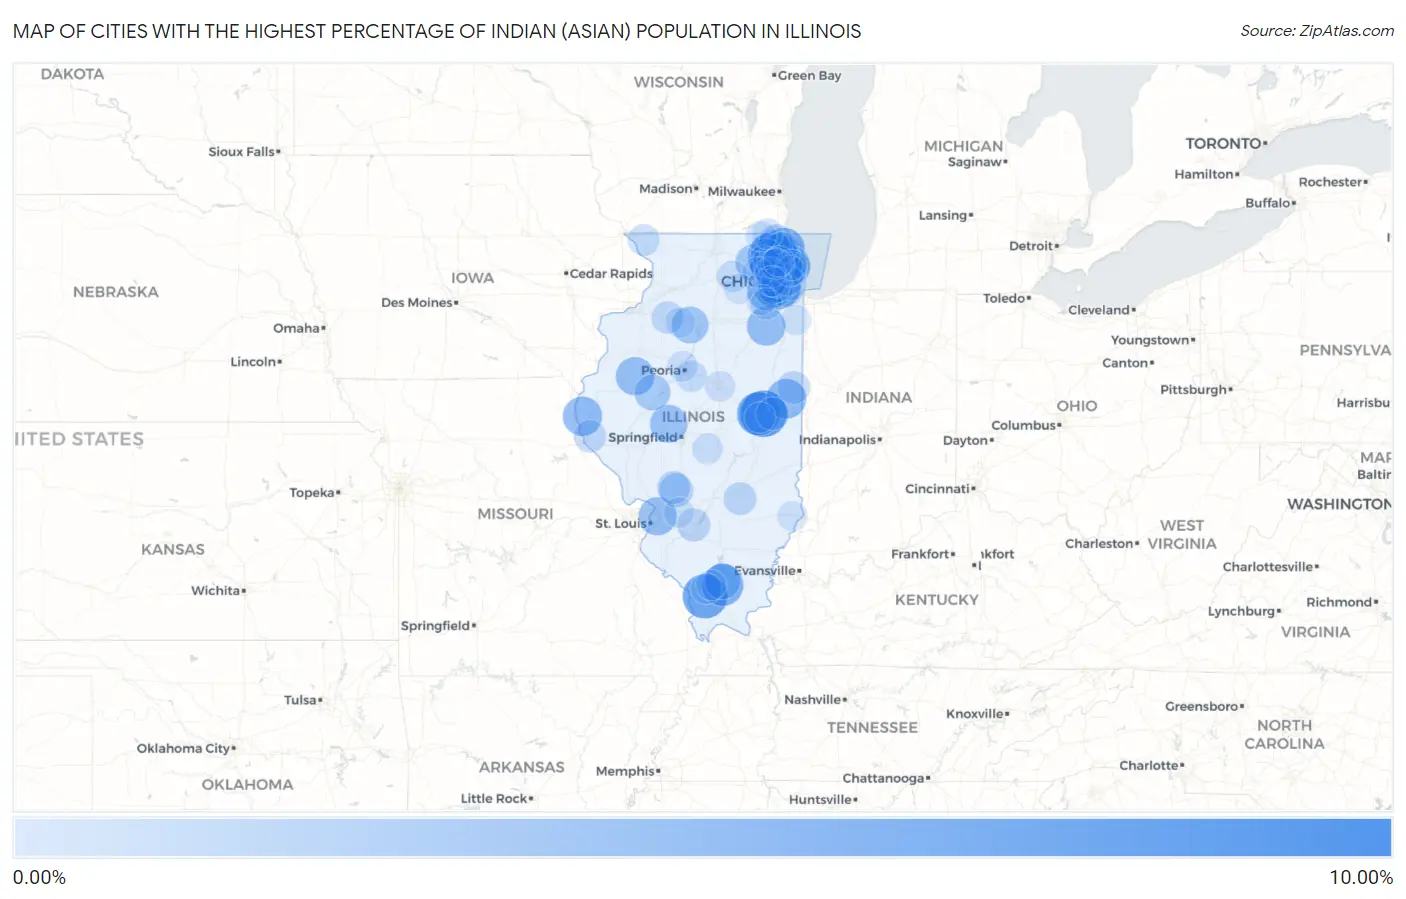
Map of Cities with the Highest Percentage of Indian (Asian) Population in Illinois
0.00%
10.00%
Cities with the Highest Percentage of Indian (Asian) Population in Illinois
| City | Indian (Asian) | vs State | vs National | |
| 1. | Kildeer | 9.32% | 1.22%(+8.09)#1 | 1.61%(+7.71)#332 |
| 2. | Lincolnshire | 8.16% | 1.22%(+6.93)#2 | 1.61%(+6.55)#400 |
| 3. | Urbana | 8.07% | 1.22%(+6.84)#3 | 1.61%(+6.46)#408 |
| 4. | Makanda | 7.20% | 1.22%(+5.98)#4 | 1.61%(+5.59)#466 |
| 5. | Champaign | 6.69% | 1.22%(+5.46)#5 | 1.61%(+5.08)#508 |
| 6. | Hinsdale | 6.67% | 1.22%(+5.45)#6 | 1.61%(+5.07)#509 |
| 7. | Long Grove | 6.66% | 1.22%(+5.43)#7 | 1.61%(+5.05)#511 |
| 8. | Lake Bluff | 6.15% | 1.22%(+4.93)#8 | 1.61%(+4.54)#572 |
| 9. | Spillertown | 6.03% | 1.22%(+4.81)#9 | 1.61%(+4.42)#589 |
| 10. | Wilmette | 5.36% | 1.22%(+4.14)#10 | 1.61%(+3.75)#682 |
| 11. | Potomac | 5.24% | 1.22%(+4.01)#11 | 1.61%(+3.63)#705 |
| 12. | Northfield | 5.13% | 1.22%(+3.91)#12 | 1.61%(+3.53)#729 |
| 13. | Vernon Hills | 5.09% | 1.22%(+3.86)#13 | 1.61%(+3.48)#736 |
| 14. | Ursa | 5.02% | 1.22%(+3.79)#14 | 1.61%(+3.41)#750 |
| 15. | Oak Brook | 4.80% | 1.22%(+3.57)#15 | 1.61%(+3.19)#789 |
| 16. | Lakewood Shores | 4.73% | 1.22%(+3.50)#16 | 1.61%(+3.12)#803 |
| 17. | Naperville | 4.65% | 1.22%(+3.43)#17 | 1.61%(+3.04)#817 |
| 18. | Pontoon Beach | 4.60% | 1.22%(+3.38)#18 | 1.61%(+2.99)#830 |
| 19. | Prairie City | 4.58% | 1.22%(+3.36)#19 | 1.61%(+2.98)#841 |
| 20. | Lake Petersburg | 4.33% | 1.22%(+3.10)#20 | 1.61%(+2.72)#898 |
| 21. | North Barrington | 4.20% | 1.22%(+2.98)#21 | 1.61%(+2.59)#919 |
| 22. | Northbrook | 4.17% | 1.22%(+2.94)#22 | 1.61%(+2.56)#922 |
| 23. | Tiskilwa | 4.02% | 1.22%(+2.80)#23 | 1.61%(+2.41)#956 |
| 24. | Gilberts | 3.90% | 1.22%(+2.68)#24 | 1.61%(+2.29)#989 |
| 25. | Buffalo Grove | 3.86% | 1.22%(+2.63)#25 | 1.61%(+2.25)#1,004 |
| 26. | Westmont | 3.76% | 1.22%(+2.54)#26 | 1.61%(+2.15)#1,026 |
| 27. | Johnston City | 3.67% | 1.22%(+2.45)#27 | 1.61%(+2.06)#1,055 |
| 28. | Hawthorn Woods | 3.65% | 1.22%(+2.43)#28 | 1.61%(+2.05)#1,059 |
| 29. | Evanston | 3.60% | 1.22%(+2.38)#29 | 1.61%(+1.99)#1,074 |
| 30. | Lewistown | 3.56% | 1.22%(+2.34)#30 | 1.61%(+1.95)#1,083 |
| 31. | Barrington | 3.50% | 1.22%(+2.27)#31 | 1.61%(+1.89)#1,105 |
| 32. | Riverwoods | 3.39% | 1.22%(+2.17)#32 | 1.61%(+1.79)#1,144 |
| 33. | Glenview | 3.24% | 1.22%(+2.02)#33 | 1.61%(+1.64)#1,196 |
| 34. | Lisle | 3.18% | 1.22%(+1.95)#34 | 1.61%(+1.57)#1,218 |
| 35. | Bannockburn | 3.10% | 1.22%(+1.87)#35 | 1.61%(+1.49)#1,254 |
| 36. | Itasca | 2.88% | 1.22%(+1.65)#36 | 1.61%(+1.27)#1,348 |
| 37. | Skokie | 2.78% | 1.22%(+1.56)#37 | 1.61%(+1.18)#1,393 |
| 38. | Mount Olive | 2.75% | 1.22%(+1.53)#38 | 1.61%(+1.14)#1,414 |
| 39. | Grandwood Park | 2.71% | 1.22%(+1.48)#39 | 1.61%(+1.10)#1,441 |
| 40. | Wauconda | 2.57% | 1.22%(+1.35)#40 | 1.61%(+0.962)#1,522 |
| 41. | Lake Zurich | 2.57% | 1.22%(+1.34)#41 | 1.61%(+0.958)#1,527 |
| 42. | Chicago | 2.50% | 1.22%(+1.27)#42 | 1.61%(+0.888)#1,582 |
| 43. | Eagarville | 2.45% | 1.22%(+1.23)#43 | 1.61%(+0.842)#1,604 |
| 44. | Mason | 2.43% | 1.22%(+1.20)#44 | 1.61%(+0.817)#1,622 |
| 45. | Beckemeyer | 2.40% | 1.22%(+1.17)#45 | 1.61%(+0.790)#1,643 |
| 46. | Lake Forest | 2.39% | 1.22%(+1.17)#46 | 1.61%(+0.784)#1,647 |
| 47. | St Joseph | 2.34% | 1.22%(+1.12)#47 | 1.61%(+0.732)#1,692 |
| 48. | Hoopeston | 2.33% | 1.22%(+1.10)#48 | 1.61%(+0.719)#1,701 |
| 49. | Hoffman Estates | 2.30% | 1.22%(+1.07)#49 | 1.61%(+0.687)#1,722 |
| 50. | South Barrington | 2.28% | 1.22%(+1.06)#50 | 1.61%(+0.671)#1,739 |
| 51. | Payson | 2.19% | 1.22%(+0.970)#51 | 1.61%(+0.586)#1,792 |
| 52. | Libertyville | 2.18% | 1.22%(+0.960)#52 | 1.61%(+0.576)#1,798 |
| 53. | Green Oaks | 2.17% | 1.22%(+0.948)#53 | 1.61%(+0.564)#1,808 |
| 54. | Annawan | 2.15% | 1.22%(+0.927)#54 | 1.61%(+0.543)#1,825 |
| 55. | Darien | 2.14% | 1.22%(+0.912)#55 | 1.61%(+0.528)#1,842 |
| 56. | Morton Grove | 2.14% | 1.22%(+0.911)#56 | 1.61%(+0.527)#1,845 |
| 57. | Elk Grove Village | 2.08% | 1.22%(+0.856)#57 | 1.61%(+0.471)#1,878 |
| 58. | Woodridge | 2.07% | 1.22%(+0.850)#58 | 1.61%(+0.466)#1,879 |
| 59. | Schaumburg | 2.02% | 1.22%(+0.796)#59 | 1.61%(+0.411)#1,921 |
| 60. | Bridgeview | 2.01% | 1.22%(+0.783)#60 | 1.61%(+0.398)#1,937 |
| 61. | Clarendon Hills | 1.99% | 1.22%(+0.762)#61 | 1.61%(+0.378)#1,961 |
| 62. | Downers Grove | 1.96% | 1.22%(+0.732)#62 | 1.61%(+0.347)#1,994 |
| 63. | The Galena Territory | 1.93% | 1.22%(+0.706)#63 | 1.61%(+0.321)#2,017 |
| 64. | Crystal Lawns | 1.84% | 1.22%(+0.615)#64 | 1.61%(+0.231)#2,109 |
| 65. | Mount Prospect | 1.80% | 1.22%(+0.578)#65 | 1.61%(+0.194)#2,150 |
| 66. | Bartlett | 1.79% | 1.22%(+0.568)#66 | 1.61%(+0.184)#2,161 |
| 67. | Morton | 1.78% | 1.22%(+0.559)#67 | 1.61%(+0.174)#2,169 |
| 68. | Grayslake | 1.77% | 1.22%(+0.545)#68 | 1.61%(+0.160)#2,184 |
| 69. | Dekalb | 1.76% | 1.22%(+0.540)#69 | 1.61%(+0.155)#2,190 |
| 70. | North Chicago | 1.74% | 1.22%(+0.511)#70 | 1.61%(+0.126)#2,235 |
| 71. | Oak Park | 1.73% | 1.22%(+0.503)#71 | 1.61%(+0.119)#2,238 |
| 72. | Inverness | 1.71% | 1.22%(+0.485)#72 | 1.61%(+0.101)#2,265 |
| 73. | Rolling Meadows | 1.70% | 1.22%(+0.476)#73 | 1.61%(+0.092)#2,279 |
| 74. | Barrington Hills | 1.70% | 1.22%(+0.472)#74 | 1.61%(+0.088)#2,286 |
| 75. | Lombard | 1.60% | 1.22%(+0.371)#75 | 1.61%(-0.013)#2,405 |
| 76. | Bloomingdale | 1.56% | 1.22%(+0.331)#76 | 1.61%(-0.053)#2,448 |
| 77. | Palatine | 1.54% | 1.22%(+0.314)#77 | 1.61%(-0.071)#2,473 |
| 78. | Lincolnwood | 1.53% | 1.22%(+0.306)#78 | 1.61%(-0.079)#2,487 |
| 79. | Stonington | 1.51% | 1.22%(+0.287)#79 | 1.61%(-0.098)#2,515 |
| 80. | Tower Lakes | 1.48% | 1.22%(+0.258)#80 | 1.61%(-0.127)#2,563 |
| 81. | Carbondale | 1.48% | 1.22%(+0.255)#81 | 1.61%(-0.130)#2,567 |
| 82. | Kenilworth | 1.46% | 1.22%(+0.234)#82 | 1.61%(-0.150)#2,602 |
| 83. | Lake Catherine | 1.45% | 1.22%(+0.225)#83 | 1.61%(-0.159)#2,620 |
| 84. | Savoy | 1.44% | 1.22%(+0.215)#84 | 1.61%(-0.169)#2,635 |
| 85. | Roselle | 1.43% | 1.22%(+0.207)#85 | 1.61%(-0.177)#2,649 |
| 86. | Peoria | 1.42% | 1.22%(+0.199)#86 | 1.61%(-0.186)#2,660 |
| 87. | South Elgin | 1.42% | 1.22%(+0.198)#87 | 1.61%(-0.187)#2,662 |
| 88. | Bloomington | 1.42% | 1.22%(+0.197)#88 | 1.61%(-0.187)#2,664 |
| 89. | Oakbrook Terrace | 1.41% | 1.22%(+0.186)#89 | 1.61%(-0.199)#2,685 |
| 90. | Highland | 1.41% | 1.22%(+0.185)#90 | 1.61%(-0.199)#2,687 |
| 91. | Arlington Heights | 1.41% | 1.22%(+0.181)#91 | 1.61%(-0.204)#2,695 |
| 92. | Spring Grove | 1.39% | 1.22%(+0.163)#92 | 1.61%(-0.221)#2,721 |
| 93. | Glen Ellyn | 1.36% | 1.22%(+0.139)#93 | 1.61%(-0.245)#2,757 |
| 94. | Wheeling | 1.35% | 1.22%(+0.123)#94 | 1.61%(-0.262)#2,774 |
| 95. | Plainfield | 1.35% | 1.22%(+0.122)#95 | 1.61%(-0.263)#2,776 |
| 96. | Lawrenceville | 1.33% | 1.22%(+0.106)#96 | 1.61%(-0.279)#2,803 |
| 97. | Buda | 1.32% | 1.22%(+0.099)#97 | 1.61%(-0.286)#2,808 |
| 98. | Hinckley | 1.30% | 1.22%(+0.075)#98 | 1.61%(-0.309)#2,847 |
| 99. | Cambria | 1.30% | 1.22%(+0.075)#99 | 1.61%(-0.309)#2,848 |
| 100. | Beecher | 1.29% | 1.22%(+0.069)#100 | 1.61%(-0.315)#2,855 |
Common Questions
What are the Top 10 Cities with the Highest Percentage of Indian (Asian) Population in Illinois?
Top 10 Cities with the Highest Percentage of Indian (Asian) Population in Illinois are:
#1
9.32%
#2
8.16%
#3
8.07%
#4
7.20%
#5
6.69%
#6
6.67%
#7
6.66%
#8
6.15%
#9
6.03%
#10
5.36%
What city has the Highest Percentage of Indian (Asian) Population in Illinois?
Kildeer has the Highest Percentage of Indian (Asian) Population in Illinois with 9.32%.
What is the Percentage of Indian (Asian) Population in the State of Illinois?
Percentage of Indian (Asian) Population in Illinois is 1.22%.
What is the Percentage of Indian (Asian) Population in the United States?
Percentage of Indian (Asian) Population in the United States is 1.61%.