Cities with the Highest Percentage of Indian (Asian) Population in North Carolina
RELATED REPORTS & OPTIONS
Indian (Asian)
North Carolina
Compare Cities
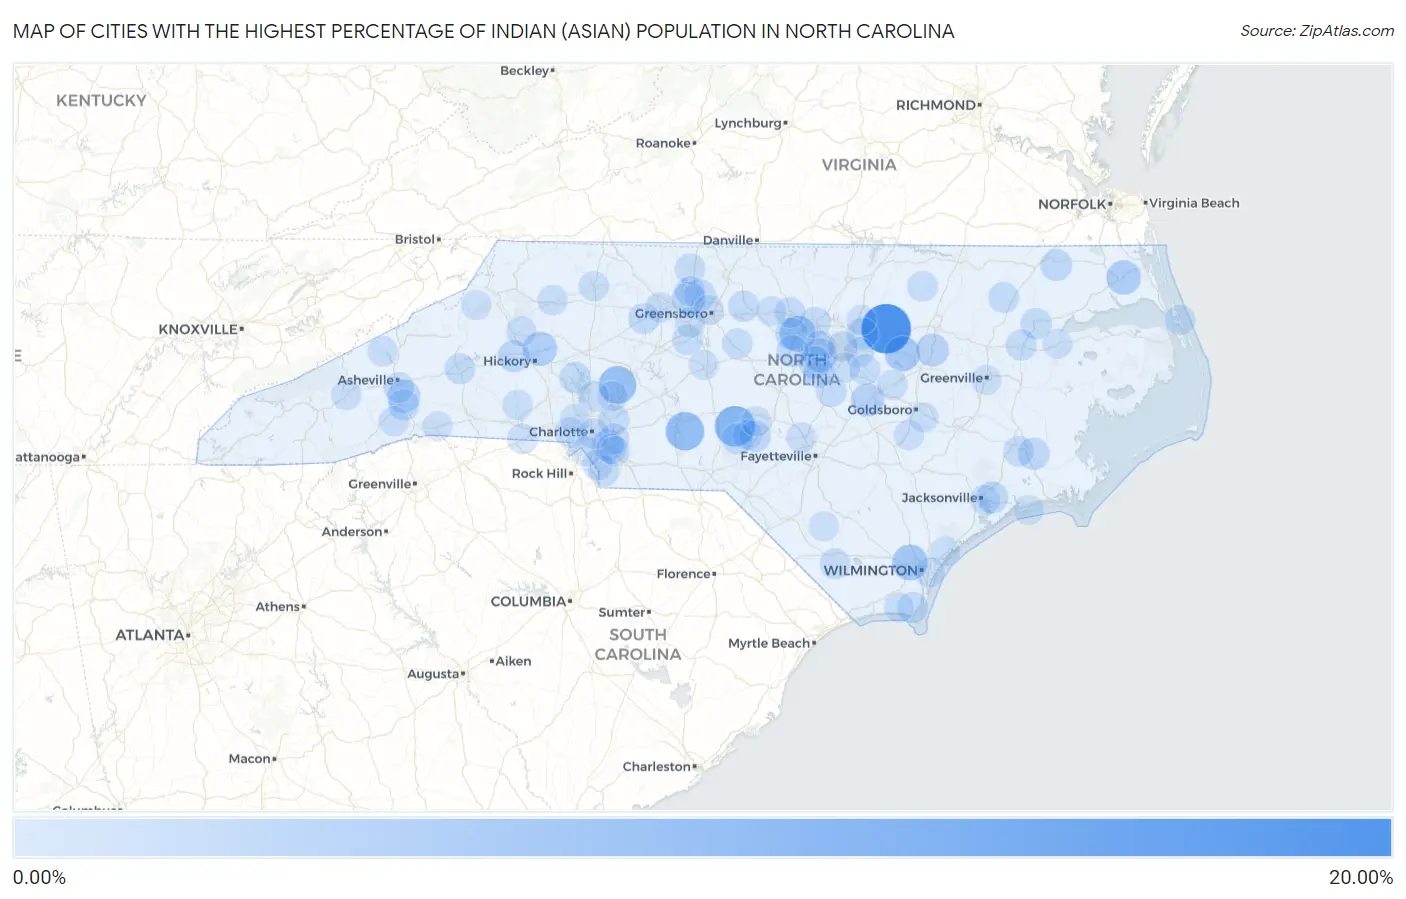
Map of Cities with the Highest Percentage of Indian (Asian) Population in North Carolina
0.00%
20.00%
Cities with the Highest Percentage of Indian (Asian) Population in North Carolina
| City | Indian (Asian) | vs State | vs National | |
| 1. | Bunn | 19.46% | 0.59%(+18.9)#1 | 1.61%(+17.8)#74 |
| 2. | Seven Lakes | 10.42% | 0.59%(+9.82)#2 | 1.61%(+8.81)#278 |
| 3. | Mount Gilead | 8.44% | 0.59%(+7.85)#3 | 1.61%(+6.83)#385 |
| 4. | Landis | 7.70% | 0.59%(+7.11)#4 | 1.61%(+6.09)#431 |
| 5. | Chapel Hill | 5.94% | 0.59%(+5.35)#5 | 1.61%(+4.33)#598 |
| 6. | Navassa | 5.92% | 0.59%(+5.33)#6 | 1.61%(+4.31)#601 |
| 7. | Bailey | 5.45% | 0.59%(+4.85)#7 | 1.61%(+3.84)#665 |
| 8. | Camden | 4.58% | 0.59%(+3.99)#8 | 1.61%(+2.97)#842 |
| 9. | Bethlehem | 4.37% | 0.59%(+3.77)#9 | 1.61%(+2.76)#893 |
| 10. | Cary | 4.25% | 0.59%(+3.66)#10 | 1.61%(+2.64)#909 |
| 11. | Oak Ridge | 3.57% | 0.59%(+2.98)#11 | 1.61%(+1.97)#1,082 |
| 12. | Royal Pines | 3.46% | 0.59%(+2.87)#12 | 1.61%(+1.85)#1,121 |
| 13. | Four Oaks | 3.31% | 0.59%(+2.71)#13 | 1.61%(+1.70)#1,176 |
| 14. | Elm City | 3.20% | 0.59%(+2.61)#14 | 1.61%(+1.59)#1,213 |
| 15. | Apex | 3.12% | 0.59%(+2.53)#15 | 1.61%(+1.51)#1,246 |
| 16. | Briar Chapel | 2.29% | 0.59%(+1.70)#16 | 1.61%(+0.679)#1,730 |
| 17. | Fairfield Harbour | 2.27% | 0.59%(+1.68)#17 | 1.61%(+0.664)#1,745 |
| 18. | Carrboro | 2.22% | 0.59%(+1.62)#18 | 1.61%(+0.609)#1,778 |
| 19. | Fearrington Village | 2.21% | 0.59%(+1.61)#19 | 1.61%(+0.599)#1,783 |
| 20. | Rolesville | 2.20% | 0.59%(+1.60)#20 | 1.61%(+0.588)#1,789 |
| 21. | Gatesville | 2.17% | 0.59%(+1.57)#21 | 1.61%(+0.557)#1,819 |
| 22. | Rutherford College | 2.14% | 0.59%(+1.55)#22 | 1.61%(+0.536)#1,832 |
| 23. | Piney Green | 2.02% | 0.59%(+1.43)#23 | 1.61%(+0.409)#1,925 |
| 24. | Matthews | 2.01% | 0.59%(+1.42)#24 | 1.61%(+0.400)#1,933 |
| 25. | Southern Pines | 1.98% | 0.59%(+1.39)#25 | 1.61%(+0.372)#1,968 |
| 26. | Summerfield | 1.90% | 0.59%(+1.31)#26 | 1.61%(+0.294)#2,045 |
| 27. | Foxfire | 1.70% | 0.59%(+1.11)#27 | 1.61%(+0.091)#2,280 |
| 28. | Windsor | 1.69% | 0.59%(+1.10)#28 | 1.61%(+0.080)#2,295 |
| 29. | Lake Norman Of Catawba | 1.66% | 0.59%(+1.07)#29 | 1.61%(+0.052)#2,328 |
| 30. | Angier | 1.65% | 0.59%(+1.05)#30 | 1.61%(+0.037)#2,349 |
| 31. | Elon | 1.58% | 0.59%(+0.984)#31 | 1.61%(-0.032)#2,425 |
| 32. | Southport | 1.57% | 0.59%(+0.976)#32 | 1.61%(-0.040)#2,440 |
| 33. | Clemmons | 1.54% | 0.59%(+0.948)#33 | 1.61%(-0.067)#2,468 |
| 34. | Durham | 1.54% | 0.59%(+0.947)#34 | 1.61%(-0.069)#2,471 |
| 35. | Williamston | 1.45% | 0.59%(+0.862)#35 | 1.61%(-0.154)#2,606 |
| 36. | Harrisburg | 1.45% | 0.59%(+0.860)#36 | 1.61%(-0.156)#2,614 |
| 37. | Kelford | 1.42% | 0.59%(+0.826)#37 | 1.61%(-0.190)#2,670 |
| 38. | Morrisville | 1.40% | 0.59%(+0.808)#38 | 1.61%(-0.207)#2,702 |
| 39. | Fletcher | 1.40% | 0.59%(+0.807)#39 | 1.61%(-0.209)#2,705 |
| 40. | Marion | 1.39% | 0.59%(+0.792)#40 | 1.61%(-0.224)#2,725 |
| 41. | Governors | 1.29% | 0.59%(+0.698)#41 | 1.61%(-0.318)#2,860 |
| 42. | Hillsborough | 1.27% | 0.59%(+0.676)#42 | 1.61%(-0.340)#2,895 |
| 43. | Brunswick | 1.22% | 0.59%(+0.624)#43 | 1.61%(-0.392)#3,010 |
| 44. | Waxhaw | 1.19% | 0.59%(+0.593)#44 | 1.61%(-0.423)#3,075 |
| 45. | Holly Springs | 1.18% | 0.59%(+0.587)#45 | 1.61%(-0.428)#3,081 |
| 46. | Trent Woods | 1.17% | 0.59%(+0.582)#46 | 1.61%(-0.434)#3,095 |
| 47. | Mint Hill | 1.15% | 0.59%(+0.553)#47 | 1.61%(-0.463)#3,150 |
| 48. | Clayton | 1.13% | 0.59%(+0.540)#48 | 1.61%(-0.476)#3,177 |
| 49. | Liberty | 1.13% | 0.59%(+0.532)#49 | 1.61%(-0.483)#3,193 |
| 50. | Biltmore Forest | 1.12% | 0.59%(+0.525)#50 | 1.61%(-0.491)#3,213 |
| 51. | Madison | 1.10% | 0.59%(+0.505)#51 | 1.61%(-0.510)#3,260 |
| 52. | Belmont | 1.09% | 0.59%(+0.499)#52 | 1.61%(-0.517)#3,279 |
| 53. | Trinity | 1.07% | 0.59%(+0.477)#53 | 1.61%(-0.539)#3,321 |
| 54. | Hollister | 1.06% | 0.59%(+0.470)#54 | 1.61%(-0.546)#3,343 |
| 55. | Charlotte | 1.03% | 0.59%(+0.437)#55 | 1.61%(-0.579)#3,431 |
| 56. | Davidson | 1.01% | 0.59%(+0.420)#56 | 1.61%(-0.596)#3,477 |
| 57. | Grover | 1.00% | 0.59%(+0.410)#57 | 1.61%(-0.605)#3,498 |
| 58. | Marvin | 1.00% | 0.59%(+0.404)#58 | 1.61%(-0.612)#3,515 |
| 59. | Grandy | 0.98% | 0.59%(+0.392)#59 | 1.61%(-0.624)#3,553 |
| 60. | Kill Devil Hills | 0.98% | 0.59%(+0.386)#60 | 1.61%(-0.629)#3,569 |
| 61. | Pineville | 0.89% | 0.59%(+0.300)#61 | 1.61%(-0.716)#3,823 |
| 62. | Stallings | 0.88% | 0.59%(+0.284)#62 | 1.61%(-0.732)#3,874 |
| 63. | Cricket | 0.84% | 0.59%(+0.250)#63 | 1.61%(-0.766)#3,982 |
| 64. | Micro | 0.84% | 0.59%(+0.246)#64 | 1.61%(-0.770)#3,996 |
| 65. | Jacksonville | 0.84% | 0.59%(+0.246)#65 | 1.61%(-0.770)#3,997 |
| 66. | High Point | 0.83% | 0.59%(+0.234)#66 | 1.61%(-0.782)#4,044 |
| 67. | Raleigh | 0.83% | 0.59%(+0.232)#67 | 1.61%(-0.783)#4,053 |
| 68. | Mount Olive | 0.82% | 0.59%(+0.224)#68 | 1.61%(-0.792)#4,080 |
| 69. | Winston Salem | 0.82% | 0.59%(+0.224)#69 | 1.61%(-0.792)#4,081 |
| 70. | Marshall | 0.81% | 0.59%(+0.219)#70 | 1.61%(-0.797)#4,094 |
| 71. | Governors Club | 0.81% | 0.59%(+0.215)#71 | 1.61%(-0.801)#4,108 |
| 72. | Etowah | 0.81% | 0.59%(+0.213)#72 | 1.61%(-0.802)#4,113 |
| 73. | Elkin | 0.79% | 0.59%(+0.202)#73 | 1.61%(-0.814)#4,141 |
| 74. | Kannapolis | 0.77% | 0.59%(+0.176)#74 | 1.61%(-0.840)#4,232 |
| 75. | Stokesdale | 0.76% | 0.59%(+0.170)#75 | 1.61%(-0.846)#4,250 |
| 76. | Waynesville | 0.76% | 0.59%(+0.164)#76 | 1.61%(-0.852)#4,261 |
| 77. | Fallston | 0.75% | 0.59%(+0.153)#77 | 1.61%(-0.863)#4,295 |
| 78. | Cedar Rock | 0.73% | 0.59%(+0.141)#78 | 1.61%(-0.875)#4,345 |
| 79. | Spring Lake | 0.72% | 0.59%(+0.124)#79 | 1.61%(-0.891)#4,401 |
| 80. | Knightdale | 0.68% | 0.59%(+0.087)#80 | 1.61%(-0.929)#4,527 |
| 81. | Mebane | 0.66% | 0.59%(+0.072)#81 | 1.61%(-0.944)#4,594 |
| 82. | Youngsville | 0.66% | 0.59%(+0.068)#82 | 1.61%(-0.948)#4,609 |
| 83. | Hampstead | 0.66% | 0.59%(+0.067)#83 | 1.61%(-0.949)#4,616 |
| 84. | Oak Island | 0.65% | 0.59%(+0.061)#84 | 1.61%(-0.955)#4,641 |
| 85. | Mount Holly | 0.65% | 0.59%(+0.059)#85 | 1.61%(-0.957)#4,648 |
| 86. | Greenville | 0.64% | 0.59%(+0.046)#86 | 1.61%(-0.969)#4,704 |
| 87. | Emerald Isle | 0.62% | 0.59%(+0.027)#87 | 1.61%(-0.989)#4,783 |
| 88. | Sugar Mountain | 0.61% | 0.59%(+0.021)#88 | 1.61%(-0.995)#4,808 |
| 89. | Asheboro | 0.61% | 0.59%(+0.019)#89 | 1.61%(-0.997)#4,811 |
| 90. | Bladenboro | 0.60% | 0.59%(+0.011)#90 | 1.61%(-1.01)#4,848 |
| 91. | Lake Park | 0.60% | 0.59%(+0.006)#91 | 1.61%(-1.01)#4,879 |
| 92. | Pinehurst | 0.59% | 0.59%(+0.002)#92 | 1.61%(-1.01)#4,892 |
| 93. | Wilmington | 0.59% | 0.59%(-0.001)#93 | 1.61%(-1.02)#4,911 |
| 94. | Greensboro | 0.59% | 0.59%(-0.002)#94 | 1.61%(-1.02)#4,914 |
| 95. | Spout Springs | 0.58% | 0.59%(-0.015)#95 | 1.61%(-1.03)#4,969 |
| 96. | Carthage | 0.58% | 0.59%(-0.017)#96 | 1.61%(-1.03)#4,979 |
| 97. | Plymouth | 0.57% | 0.59%(-0.020)#97 | 1.61%(-1.04)#4,996 |
| 98. | Elroy | 0.57% | 0.59%(-0.021)#98 | 1.61%(-1.04)#4,998 |
| 99. | Garner | 0.56% | 0.59%(-0.028)#99 | 1.61%(-1.04)#5,047 |
| 100. | Columbus | 0.55% | 0.59%(-0.041)#100 | 1.61%(-1.06)#5,110 |
Common Questions
What are the Top 10 Cities with the Highest Percentage of Indian (Asian) Population in North Carolina?
Top 10 Cities with the Highest Percentage of Indian (Asian) Population in North Carolina are:
#1
19.46%
#2
10.42%
#3
8.44%
#4
7.70%
#5
5.94%
#6
5.92%
#7
5.45%
#8
4.58%
#9
4.37%
#10
4.25%
What city has the Highest Percentage of Indian (Asian) Population in North Carolina?
Bunn has the Highest Percentage of Indian (Asian) Population in North Carolina with 19.46%.
What is the Percentage of Indian (Asian) Population in the State of North Carolina?
Percentage of Indian (Asian) Population in North Carolina is 0.59%.
What is the Percentage of Indian (Asian) Population in the United States?
Percentage of Indian (Asian) Population in the United States is 1.61%.