Cities with the Highest Percentage of Indian (Asian) Population in Georgia
RELATED REPORTS & OPTIONS
Indian (Asian)
Georgia
Compare Cities
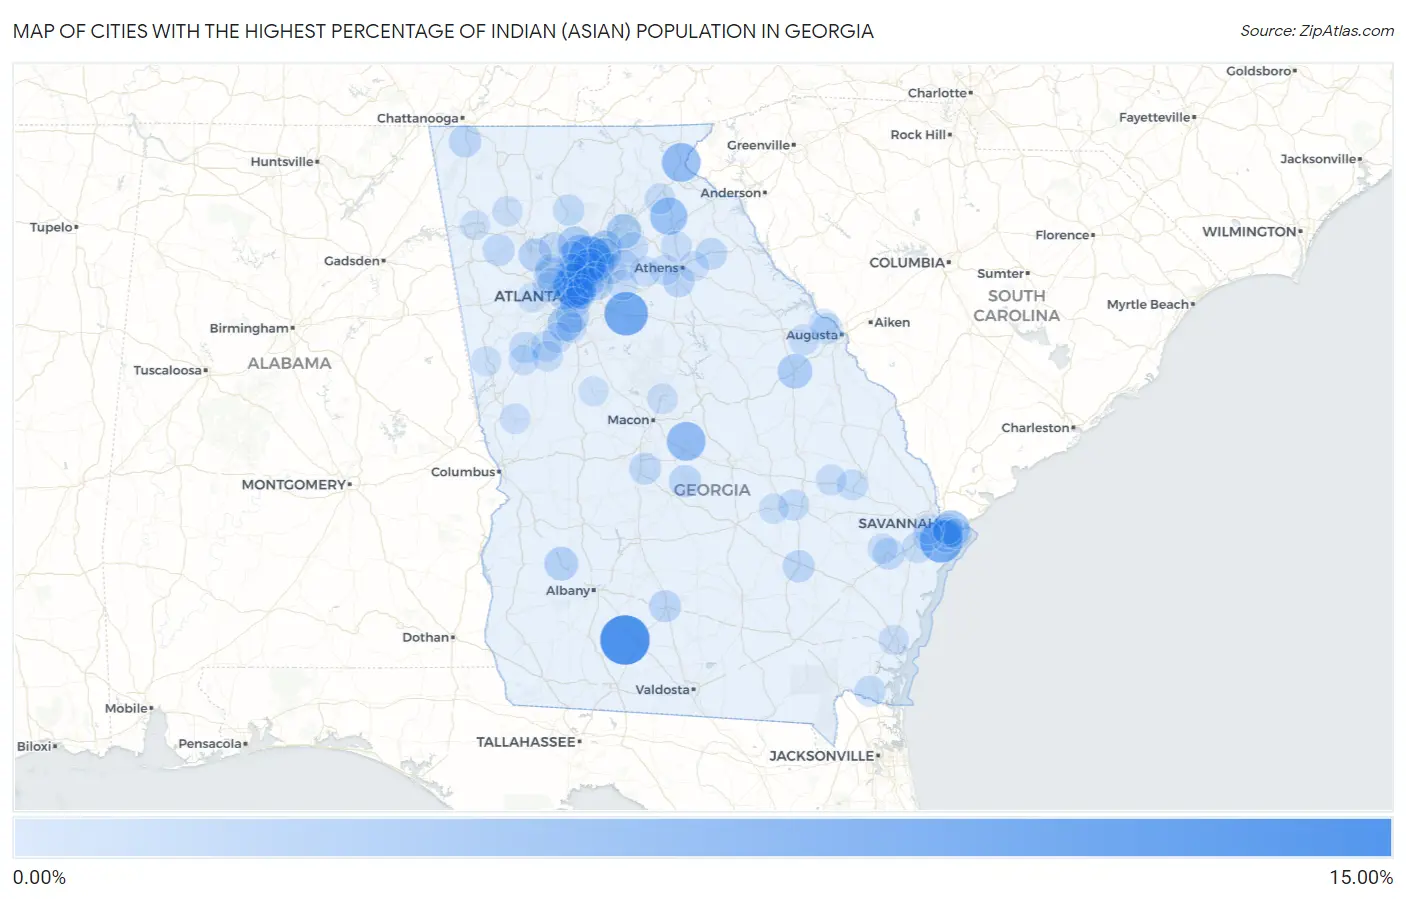
Map of Cities with the Highest Percentage of Indian (Asian) Population in Georgia
0.00%
15.00%
Cities with the Highest Percentage of Indian (Asian) Population in Georgia
| City | Indian (Asian) | vs State | vs National | |
| 1. | Funston | 11.34% | 0.75%(+10.6)#1 | 1.61%(+9.73)#241 |
| 2. | Oxford | 7.82% | 0.75%(+7.07)#2 | 1.61%(+6.21)#422 |
| 3. | Montgomery | 7.40% | 0.75%(+6.65)#3 | 1.61%(+5.79)#449 |
| 4. | Johns Creek | 7.15% | 0.75%(+6.40)#4 | 1.61%(+5.54)#470 |
| 5. | North Druid Hills | 6.36% | 0.75%(+5.61)#5 | 1.61%(+4.75)#549 |
| 6. | Jeffersonville | 5.17% | 0.75%(+4.41)#6 | 1.61%(+3.56)#719 |
| 7. | Tallulah Falls | 5.08% | 0.75%(+4.33)#7 | 1.61%(+3.48)#739 |
| 8. | Homer | 4.34% | 0.75%(+3.59)#8 | 1.61%(+2.73)#895 |
| 9. | Duluth | 4.15% | 0.75%(+3.40)#9 | 1.61%(+2.54)#926 |
| 10. | Whitemarsh Island | 4.01% | 0.75%(+3.26)#10 | 1.61%(+2.40)#963 |
| 11. | Alpharetta | 3.34% | 0.75%(+2.59)#11 | 1.61%(+1.73)#1,162 |
| 12. | North Decatur | 3.33% | 0.75%(+2.58)#12 | 1.61%(+1.73)#1,164 |
| 13. | Berry College | 3.30% | 0.75%(+2.55)#13 | 1.61%(+1.69)#1,179 |
| 14. | Peachtree Corners | 3.26% | 0.75%(+2.51)#14 | 1.61%(+1.65)#1,189 |
| 15. | Dunwoody | 3.16% | 0.75%(+2.41)#15 | 1.61%(+1.55)#1,227 |
| 16. | Riverdale | 3.04% | 0.75%(+2.29)#16 | 1.61%(+1.43)#1,277 |
| 17. | Druid Hills | 3.01% | 0.75%(+2.26)#17 | 1.61%(+1.40)#1,293 |
| 18. | Wrens | 2.86% | 0.75%(+2.11)#18 | 1.61%(+1.25)#1,356 |
| 19. | Milton | 2.82% | 0.75%(+2.07)#19 | 1.61%(+1.22)#1,368 |
| 20. | Doraville | 2.73% | 0.75%(+1.98)#20 | 1.61%(+1.12)#1,427 |
| 21. | Oakwood | 2.71% | 0.75%(+1.96)#21 | 1.61%(+1.10)#1,439 |
| 22. | Chamblee | 2.67% | 0.75%(+1.92)#22 | 1.61%(+1.06)#1,464 |
| 23. | Norcross | 2.61% | 0.75%(+1.86)#23 | 1.61%(+0.998)#1,498 |
| 24. | Sugar Hill | 2.50% | 0.75%(+1.75)#24 | 1.61%(+0.889)#1,581 |
| 25. | Suwanee | 2.49% | 0.75%(+1.74)#25 | 1.61%(+0.882)#1,586 |
| 26. | Dawson | 2.44% | 0.75%(+1.69)#26 | 1.61%(+0.833)#1,610 |
| 27. | Lake City | 2.13% | 0.75%(+1.38)#27 | 1.61%(+0.517)#1,853 |
| 28. | Mountain Park | 2.05% | 0.75%(+1.30)#28 | 1.61%(+0.446)#1,893 |
| 29. | Decatur | 1.97% | 0.75%(+1.22)#29 | 1.61%(+0.361)#1,977 |
| 30. | Berkeley Lake | 1.90% | 0.75%(+1.15)#30 | 1.61%(+0.291)#2,049 |
| 31. | Kennesaw State University | 1.89% | 0.75%(+1.14)#31 | 1.61%(+0.284)#2,053 |
| 32. | Acworth | 1.89% | 0.75%(+1.14)#32 | 1.61%(+0.278)#2,057 |
| 33. | Brookhaven | 1.85% | 0.75%(+1.10)#33 | 1.61%(+0.244)#2,095 |
| 34. | Isle Of Hope | 1.68% | 0.75%(+0.934)#34 | 1.61%(+0.076)#2,298 |
| 35. | Cochran | 1.66% | 0.75%(+0.914)#35 | 1.61%(+0.056)#2,322 |
| 36. | Chickamauga | 1.65% | 0.75%(+0.895)#36 | 1.61%(+0.037)#2,350 |
| 37. | Sandy Springs | 1.57% | 0.75%(+0.824)#37 | 1.61%(-0.034)#2,430 |
| 38. | Atlanta | 1.51% | 0.75%(+0.761)#38 | 1.61%(-0.097)#2,511 |
| 39. | Baxley | 1.49% | 0.75%(+0.738)#39 | 1.61%(-0.120)#2,551 |
| 40. | Watkinsville | 1.47% | 0.75%(+0.717)#40 | 1.61%(-0.141)#2,584 |
| 41. | Fair Oaks | 1.46% | 0.75%(+0.706)#41 | 1.61%(-0.153)#2,605 |
| 42. | Tifton | 1.42% | 0.75%(+0.668)#42 | 1.61%(-0.190)#2,669 |
| 43. | Taylorsville | 1.41% | 0.75%(+0.658)#43 | 1.61%(-0.200)#2,690 |
| 44. | Perry | 1.37% | 0.75%(+0.617)#44 | 1.61%(-0.241)#2,752 |
| 45. | Flemington | 1.33% | 0.75%(+0.581)#45 | 1.61%(-0.278)#2,801 |
| 46. | Comer | 1.27% | 0.75%(+0.520)#46 | 1.61%(-0.338)#2,892 |
| 47. | Bemiss | 1.22% | 0.75%(+0.465)#47 | 1.61%(-0.393)#3,013 |
| 48. | Nelson | 1.16% | 0.75%(+0.412)#48 | 1.61%(-0.446)#3,117 |
| 49. | Newnan | 1.10% | 0.75%(+0.353)#49 | 1.61%(-0.505)#3,250 |
| 50. | Athens-Clarke County Unified Government (Balance) | 1.10% | 0.75%(+0.350)#50 | 1.61%(-0.508)#3,255 |
| 51. | Kingsland | 1.04% | 0.75%(+0.289)#51 | 1.61%(-0.569)#3,403 |
| 52. | Vidalia | 1.03% | 0.75%(+0.284)#52 | 1.61%(-0.574)#3,415 |
| 53. | Richmond Hill | 0.99% | 0.75%(+0.237)#53 | 1.61%(-0.621)#3,545 |
| 54. | Register | 0.96% | 0.75%(+0.206)#54 | 1.61%(-0.652)#3,631 |
| 55. | Peachtree City | 0.94% | 0.75%(+0.189)#55 | 1.61%(-0.669)#3,677 |
| 56. | Braselton | 0.91% | 0.75%(+0.155)#56 | 1.61%(-0.703)#3,788 |
| 57. | Lilburn | 0.90% | 0.75%(+0.152)#57 | 1.61%(-0.707)#3,802 |
| 58. | Martinez | 0.90% | 0.75%(+0.147)#58 | 1.61%(-0.712)#3,811 |
| 59. | Dutch Island | 0.87% | 0.75%(+0.117)#59 | 1.61%(-0.741)#3,911 |
| 60. | Metter | 0.86% | 0.75%(+0.105)#60 | 1.61%(-0.754)#3,946 |
| 61. | Harlem | 0.84% | 0.75%(+0.091)#61 | 1.61%(-0.767)#3,988 |
| 62. | Alto | 0.83% | 0.75%(+0.078)#62 | 1.61%(-0.780)#4,042 |
| 63. | Thunderbolt | 0.82% | 0.75%(+0.072)#63 | 1.61%(-0.786)#4,059 |
| 64. | Nicholson | 0.77% | 0.75%(+0.024)#64 | 1.61%(-0.835)#4,217 |
| 65. | Lawrenceville | 0.77% | 0.75%(+0.018)#65 | 1.61%(-0.841)#4,236 |
| 66. | Wilmington Island | 0.77% | 0.75%(+0.017)#66 | 1.61%(-0.841)#4,238 |
| 67. | Roswell | 0.74% | 0.75%(-0.010)#67 | 1.61%(-0.868)#4,316 |
| 68. | Dacula | 0.74% | 0.75%(-0.012)#68 | 1.61%(-0.870)#4,323 |
| 69. | Cusseta Chattahoochee County Unified Government | 0.71% | 0.75%(-0.038)#69 | 1.61%(-0.896)#4,415 |
| 70. | Scottdale | 0.71% | 0.75%(-0.041)#70 | 1.61%(-0.899)#4,430 |
| 71. | Bogart | 0.71% | 0.75%(-0.045)#71 | 1.61%(-0.903)#4,441 |
| 72. | Fayetteville | 0.70% | 0.75%(-0.046)#72 | 1.61%(-0.904)#4,443 |
| 73. | Senoia | 0.70% | 0.75%(-0.047)#73 | 1.61%(-0.905)#4,446 |
| 74. | Savannah | 0.68% | 0.75%(-0.068)#74 | 1.61%(-0.926)#4,520 |
| 75. | Pine Mountain | 0.68% | 0.75%(-0.072)#75 | 1.61%(-0.930)#4,533 |
| 76. | Gray | 0.67% | 0.75%(-0.077)#76 | 1.61%(-0.935)#4,557 |
| 77. | Bethlehem | 0.67% | 0.75%(-0.082)#77 | 1.61%(-0.940)#4,574 |
| 78. | Moreland | 0.66% | 0.75%(-0.093)#78 | 1.61%(-0.951)#4,622 |
| 79. | Avondale Estates | 0.66% | 0.75%(-0.095)#79 | 1.61%(-0.953)#4,633 |
| 80. | Woodstock | 0.65% | 0.75%(-0.097)#80 | 1.61%(-0.955)#4,639 |
| 81. | Gresham Park | 0.65% | 0.75%(-0.098)#81 | 1.61%(-0.956)#4,644 |
| 82. | Winterville | 0.65% | 0.75%(-0.104)#82 | 1.61%(-0.962)#4,672 |
| 83. | Adairsville | 0.63% | 0.75%(-0.119)#83 | 1.61%(-0.978)#4,743 |
| 84. | Tucker | 0.59% | 0.75%(-0.156)#84 | 1.61%(-1.01)#4,894 |
| 85. | Loganville | 0.57% | 0.75%(-0.177)#85 | 1.61%(-1.03)#4,991 |
| 86. | Jonesboro | 0.57% | 0.75%(-0.184)#86 | 1.61%(-1.04)#5,037 |
| 87. | Fort Stewart | 0.56% | 0.75%(-0.193)#87 | 1.61%(-1.05)#5,086 |
| 88. | Dock Junction | 0.55% | 0.75%(-0.200)#88 | 1.61%(-1.06)#5,121 |
| 89. | Ailey | 0.51% | 0.75%(-0.236)#89 | 1.61%(-1.09)#5,297 |
| 90. | Evans | 0.50% | 0.75%(-0.249)#90 | 1.61%(-1.11)#5,353 |
| 91. | Douglasville | 0.49% | 0.75%(-0.263)#91 | 1.61%(-1.12)#5,431 |
| 92. | Augusta-Richmond County Consolidated Government (Balance) | 0.48% | 0.75%(-0.266)#92 | 1.61%(-1.12)#5,448 |
| 93. | Marietta | 0.46% | 0.75%(-0.286)#93 | 1.61%(-1.14)#5,549 |
| 94. | Georgetown | 0.46% | 0.75%(-0.294)#94 | 1.61%(-1.15)#5,584 |
| 95. | Barnesville | 0.45% | 0.75%(-0.299)#95 | 1.61%(-1.16)#5,612 |
| 96. | Mableton | 0.45% | 0.75%(-0.301)#96 | 1.61%(-1.16)#5,630 |
| 97. | Rome | 0.44% | 0.75%(-0.307)#97 | 1.61%(-1.16)#5,661 |
| 98. | Smyrna | 0.43% | 0.75%(-0.321)#98 | 1.61%(-1.18)#5,753 |
| 99. | Franklin | 0.43% | 0.75%(-0.324)#99 | 1.61%(-1.18)#5,773 |
| 100. | Fairfield Plantation | 0.42% | 0.75%(-0.333)#100 | 1.61%(-1.19)#5,823 |
Common Questions
What are the Top 10 Cities with the Highest Percentage of Indian (Asian) Population in Georgia?
Top 10 Cities with the Highest Percentage of Indian (Asian) Population in Georgia are:
#1
11.34%
#2
7.82%
#3
7.40%
#4
7.15%
#5
6.36%
#6
5.17%
#7
5.08%
#8
4.34%
#9
4.15%
#10
4.01%
What city has the Highest Percentage of Indian (Asian) Population in Georgia?
Funston has the Highest Percentage of Indian (Asian) Population in Georgia with 11.34%.
What is the Percentage of Indian (Asian) Population in the State of Georgia?
Percentage of Indian (Asian) Population in Georgia is 0.75%.
What is the Percentage of Indian (Asian) Population in the United States?
Percentage of Indian (Asian) Population in the United States is 1.61%.