Kittitas, WA Map & Demographics
Kittitas Map
Kittitas Overview
$35,742
PER CAPITA INCOME
$64,750
AVG FAMILY INCOME
$57,063
AVG HOUSEHOLD INCOME
51.5%
WAGE / INCOME GAP [ % ]
48.5¢/ $1
WAGE / INCOME GAP [ $ ]
0.48
INEQUALITY / GINI INDEX
1,281
TOTAL POPULATION
742
MALE POPULATION
539
FEMALE POPULATION
137.66
MALES / 100 FEMALES
72.64
FEMALES / 100 MALES
40.8
MEDIAN AGE
2.5
AVG FAMILY SIZE
1.9
AVG HOUSEHOLD SIZE
630
LABOR FORCE [ PEOPLE ]
60.2%
PERCENT IN LABOR FORCE
3.9%
UNEMPLOYMENT RATE
Kittitas Zip Codes
Kittitas Area Codes
Income in Kittitas
Income Overview in Kittitas
Per Capita Income in Kittitas is $35,742, while median incomes of families and households are $64,750 and $57,063 respectively.
| Characteristic | Number | Measure |
| Per Capita Income | 1,281 | $35,742 |
| Median Family Income | 395 | $64,750 |
| Mean Family Income | 395 | $80,154 |
| Median Household Income | 661 | $57,063 |
| Mean Household Income | 661 | $75,805 |
| Income Deficit | 395 | $0 |
| Wage / Income Gap (%) | 1,281 | 51.53% |
| Wage / Income Gap ($) | 1,281 | 48.47¢ per $1 |
| Gini / Inequality Index | 1,281 | 0.48 |
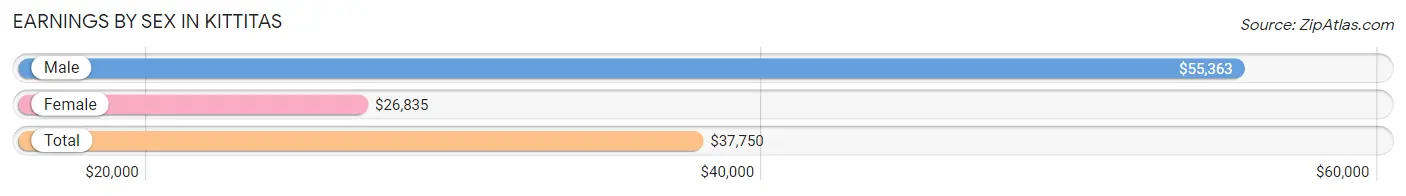
Earnings by Sex in Kittitas
Average Earnings in Kittitas are $37,750, $55,363 for men and $26,835 for women, a difference of 51.5%.
| Sex | Number | Average Earnings |
| Male | 437 (64.8%) | $55,363 |
| Female | 237 (35.2%) | $26,835 |
| Total | 674 (100.0%) | $37,750 |
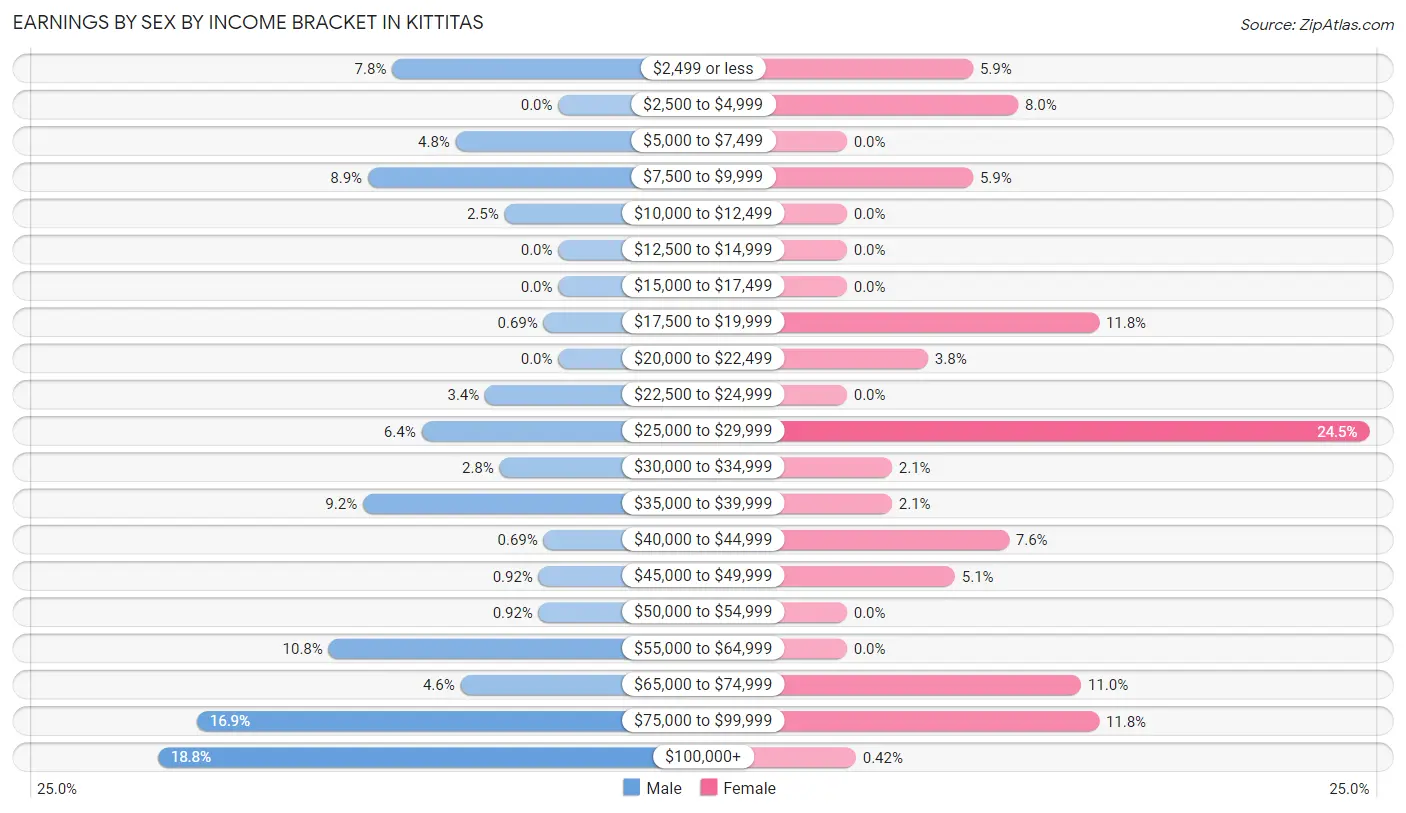
Earnings by Sex by Income Bracket in Kittitas
The most common earnings brackets in Kittitas are $100,000+ for men (82 | 18.8%) and $25,000 to $29,999 for women (58 | 24.5%).
| Income | Male | Female |
| $2,499 or less | 34 (7.8%) | 14 (5.9%) |
| $2,500 to $4,999 | 0 (0.0%) | 19 (8.0%) |
| $5,000 to $7,499 | 21 (4.8%) | 0 (0.0%) |
| $7,500 to $9,999 | 39 (8.9%) | 14 (5.9%) |
| $10,000 to $12,499 | 11 (2.5%) | 0 (0.0%) |
| $12,500 to $14,999 | 0 (0.0%) | 0 (0.0%) |
| $15,000 to $17,499 | 0 (0.0%) | 0 (0.0%) |
| $17,500 to $19,999 | 3 (0.7%) | 28 (11.8%) |
| $20,000 to $22,499 | 0 (0.0%) | 9 (3.8%) |
| $22,500 to $24,999 | 15 (3.4%) | 0 (0.0%) |
| $25,000 to $29,999 | 28 (6.4%) | 58 (24.5%) |
| $30,000 to $34,999 | 12 (2.8%) | 5 (2.1%) |
| $35,000 to $39,999 | 40 (9.1%) | 5 (2.1%) |
| $40,000 to $44,999 | 3 (0.7%) | 18 (7.6%) |
| $45,000 to $49,999 | 4 (0.9%) | 12 (5.1%) |
| $50,000 to $54,999 | 4 (0.9%) | 0 (0.0%) |
| $55,000 to $64,999 | 47 (10.8%) | 0 (0.0%) |
| $65,000 to $74,999 | 20 (4.6%) | 26 (11.0%) |
| $75,000 to $99,999 | 74 (16.9%) | 28 (11.8%) |
| $100,000+ | 82 (18.8%) | 1 (0.4%) |
| Total | 437 (100.0%) | 237 (100.0%) |
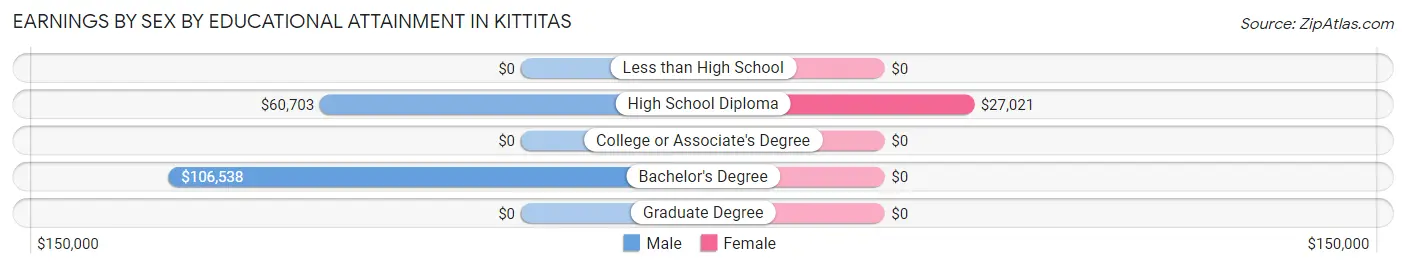
Earnings by Sex by Educational Attainment in Kittitas
Average earnings in Kittitas are $61,406 for men and $26,968 for women, a difference of 56.1%. Men with an educational attainment of bachelor's degree enjoy the highest average annual earnings of $106,538, while those with high school diploma education earn the least with $60,703. Women with an educational attainment of high school diploma earn the most with the average annual earnings of $27,021, while those with high school diploma education have the smallest earnings of $27,021.
| Educational Attainment | Male Income | Female Income |
| Less than High School | - | - |
| High School Diploma | $60,703 | $27,021 |
| College or Associate's Degree | - | - |
| Bachelor's Degree | $106,538 | $0 |
| Graduate Degree | - | - |
| Total | $61,406 | $26,968 |
Family Income in Kittitas
Family Income Brackets in Kittitas
According to the Kittitas family income data, there are 87 families falling into the $50,000 to $74,999 income range, which is the most common income bracket and makes up 22.0% of all families.
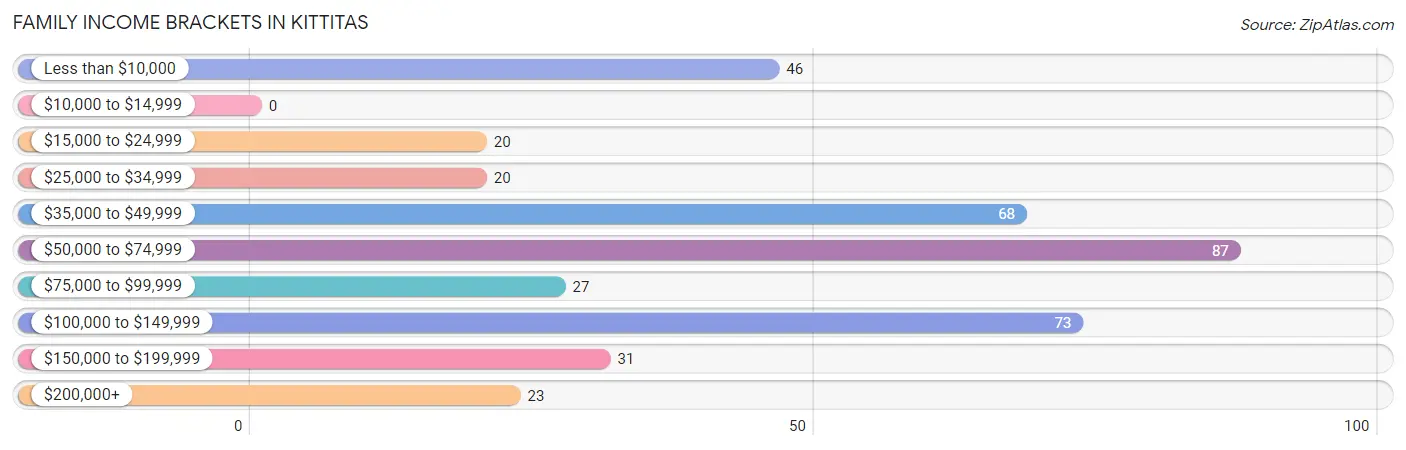
| Income Bracket | # Families | % Families |
| Less than $10,000 | 46 | 11.6% |
| $10,000 to $14,999 | 0 | 0.0% |
| $15,000 to $24,999 | 20 | 5.1% |
| $25,000 to $34,999 | 20 | 5.1% |
| $35,000 to $49,999 | 68 | 17.2% |
| $50,000 to $74,999 | 87 | 22.0% |
| $75,000 to $99,999 | 27 | 6.8% |
| $100,000 to $149,999 | 73 | 18.5% |
| $150,000 to $199,999 | 31 | 7.8% |
| $200,000+ | 23 | 5.8% |
Family Income by Famaliy Size in Kittitas
3-person families (34 | 8.6%) account for the highest median family income in Kittitas with $118,929 per family, while 3-person families (34 | 8.6%) have the highest median income of $39,643 per family member.
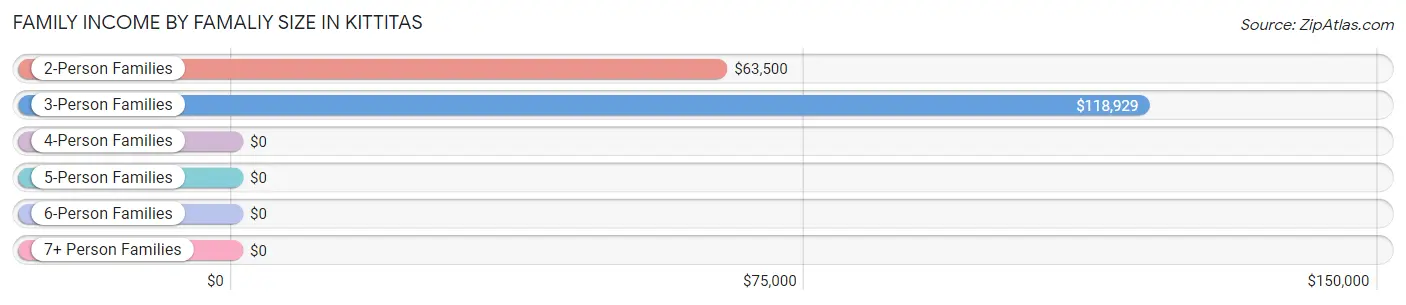
| Income Bracket | # Families | Median Income |
| 2-Person Families | 268 (67.8%) | $63,500 |
| 3-Person Families | 34 (8.6%) | $118,929 |
| 4-Person Families | 58 (14.7%) | $0 |
| 5-Person Families | 29 (7.3%) | $0 |
| 6-Person Families | 6 (1.5%) | $0 |
| 7+ Person Families | 0 (0.0%) | $0 |
| Total | 395 (100.0%) | $64,750 |
Family Income by Number of Earners in Kittitas
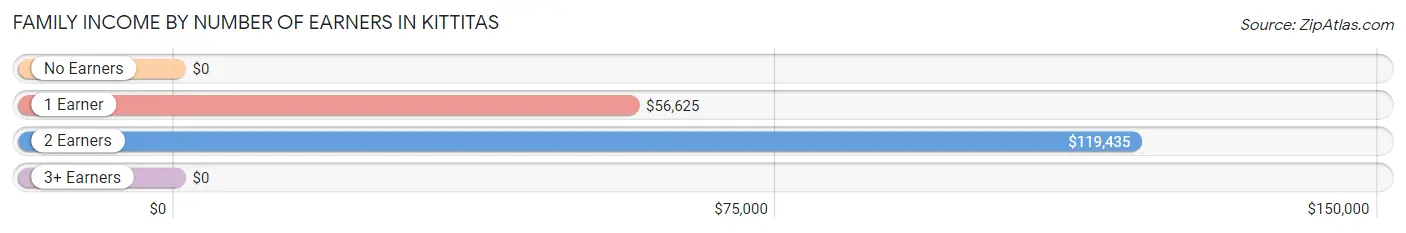
| Number of Earners | # Families | Median Income |
| No Earners | 75 (19.0%) | $0 |
| 1 Earner | 143 (36.2%) | $56,625 |
| 2 Earners | 134 (33.9%) | $119,435 |
| 3+ Earners | 43 (10.9%) | $0 |
| Total | 395 (100.0%) | $64,750 |
Household Income in Kittitas
Household Income Brackets in Kittitas
With 110 households falling in the category, the $50,000 to $74,999 income range is the most frequent in Kittitas, accounting for 16.6% of all households. In contrast, only 12 households (1.8%) fall into the $10,000 to $14,999 income bracket, making it the least populous group.
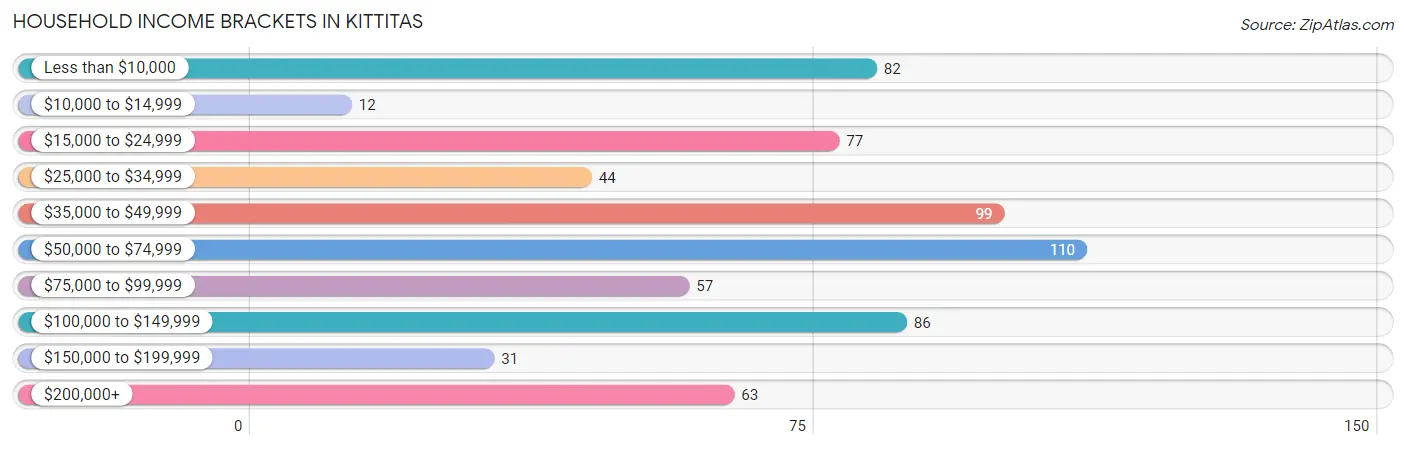
| Income Bracket | # Households | % Households |
| Less than $10,000 | 82 | 12.4% |
| $10,000 to $14,999 | 12 | 1.8% |
| $15,000 to $24,999 | 77 | 11.6% |
| $25,000 to $34,999 | 44 | 6.7% |
| $35,000 to $49,999 | 99 | 15.0% |
| $50,000 to $74,999 | 110 | 16.6% |
| $75,000 to $99,999 | 57 | 8.6% |
| $100,000 to $149,999 | 86 | 13.0% |
| $150,000 to $199,999 | 31 | 4.7% |
| $200,000+ | 63 | 9.5% |
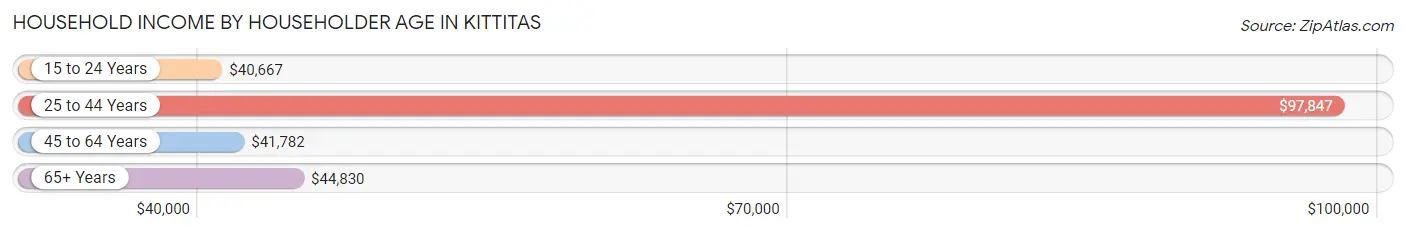
Household Income by Householder Age in Kittitas
The median household income in Kittitas is $57,063, with the highest median household income of $97,847 found in the 25 to 44 years age bracket for the primary householder. A total of 223 households (33.7%) fall into this category. Meanwhile, the 15 to 24 years age bracket for the primary householder has the lowest median household income of $40,667, with 38 households (5.8%) in this group.
| Income Bracket | # Households | Median Income |
| 15 to 24 Years | 38 (5.8%) | $40,667 |
| 25 to 44 Years | 223 (33.7%) | $97,847 |
| 45 to 64 Years | 279 (42.2%) | $41,782 |
| 65+ Years | 121 (18.3%) | $44,830 |
| Total | 661 (100.0%) | $57,063 |
Poverty in Kittitas
Income Below Poverty by Sex and Age in Kittitas
With 19.7% poverty level for males and 19.3% for females among the residents of Kittitas, under 5 year old males and 12 to 14 year old females are the most vulnerable to poverty, with 15 males (100.0%) and 13 females (100.0%) in their respective age groups living below the poverty level.
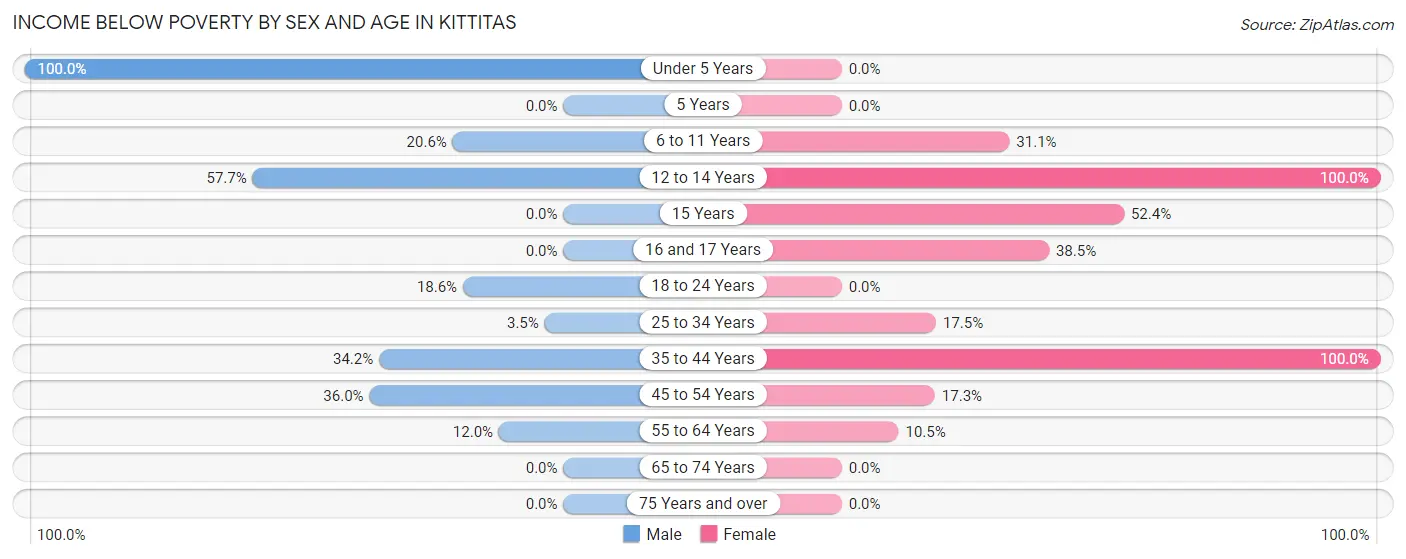
| Age Bracket | Male | Female |
| Under 5 Years | 15 (100.0%) | 0 (0.0%) |
| 5 Years | 0 (0.0%) | 0 (0.0%) |
| 6 to 11 Years | 15 (20.5%) | 14 (31.1%) |
| 12 to 14 Years | 15 (57.7%) | 13 (100.0%) |
| 15 Years | 0 (0.0%) | 11 (52.4%) |
| 16 and 17 Years | 0 (0.0%) | 10 (38.5%) |
| 18 to 24 Years | 11 (18.6%) | 0 (0.0%) |
| 25 to 34 Years | 4 (3.5%) | 14 (17.5%) |
| 35 to 44 Years | 39 (34.2%) | 16 (100.0%) |
| 45 to 54 Years | 36 (36.0%) | 14 (17.3%) |
| 55 to 64 Years | 11 (12.0%) | 12 (10.5%) |
| 65 to 74 Years | 0 (0.0%) | 0 (0.0%) |
| 75 Years and over | 0 (0.0%) | 0 (0.0%) |
| Total | 146 (19.7%) | 104 (19.3%) |
Income Above Poverty by Sex and Age in Kittitas
According to the poverty statistics in Kittitas, males aged 5 years and females aged under 5 years are the age groups that are most secure financially, with 100.0% of males and 100.0% of females in these age groups living above the poverty line.
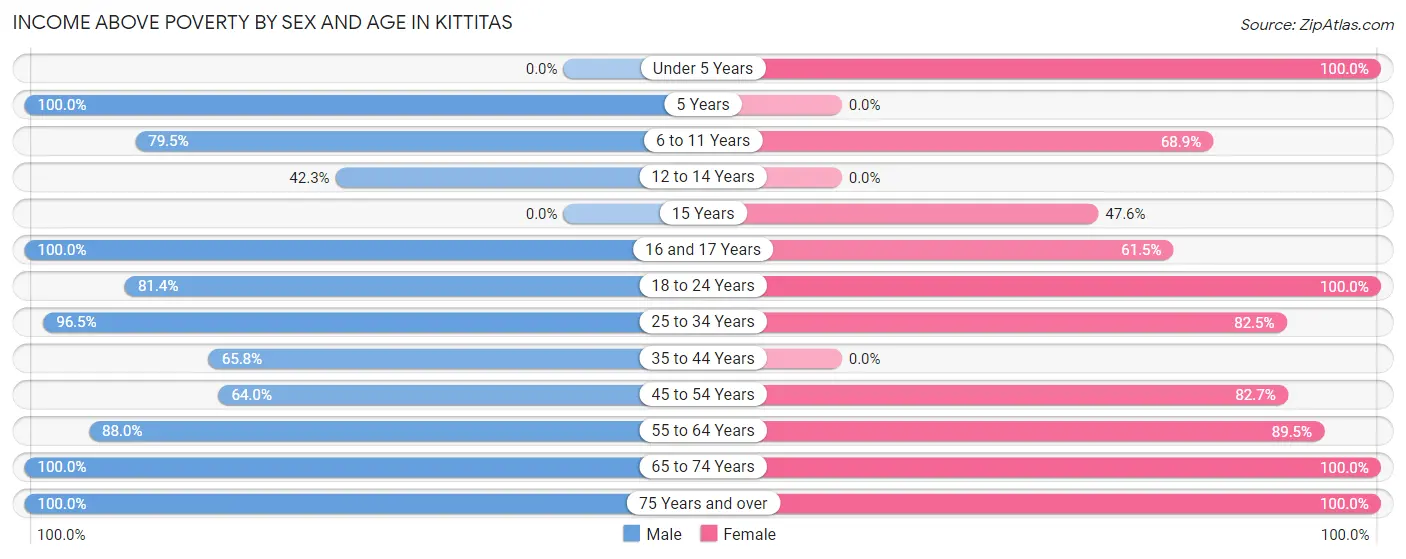
| Age Bracket | Male | Female |
| Under 5 Years | 0 (0.0%) | 28 (100.0%) |
| 5 Years | 14 (100.0%) | 0 (0.0%) |
| 6 to 11 Years | 58 (79.4%) | 31 (68.9%) |
| 12 to 14 Years | 11 (42.3%) | 0 (0.0%) |
| 15 Years | 0 (0.0%) | 10 (47.6%) |
| 16 and 17 Years | 28 (100.0%) | 16 (61.5%) |
| 18 to 24 Years | 48 (81.4%) | 25 (100.0%) |
| 25 to 34 Years | 111 (96.5%) | 66 (82.5%) |
| 35 to 44 Years | 75 (65.8%) | 0 (0.0%) |
| 45 to 54 Years | 64 (64.0%) | 67 (82.7%) |
| 55 to 64 Years | 81 (88.0%) | 102 (89.5%) |
| 65 to 74 Years | 67 (100.0%) | 30 (100.0%) |
| 75 Years and over | 39 (100.0%) | 60 (100.0%) |
| Total | 596 (80.3%) | 435 (80.7%) |
Income Below Poverty Among Married-Couple Families in Kittitas
The poverty statistics for married-couple families in Kittitas show that 8.2% or 20 of the total 244 families live below the poverty line. Families with 1 or 2 children have the highest poverty rate of 24.1%, comprising of 20 families. On the other hand, families with no children have the lowest poverty rate of 0.0%, which includes 0 families.
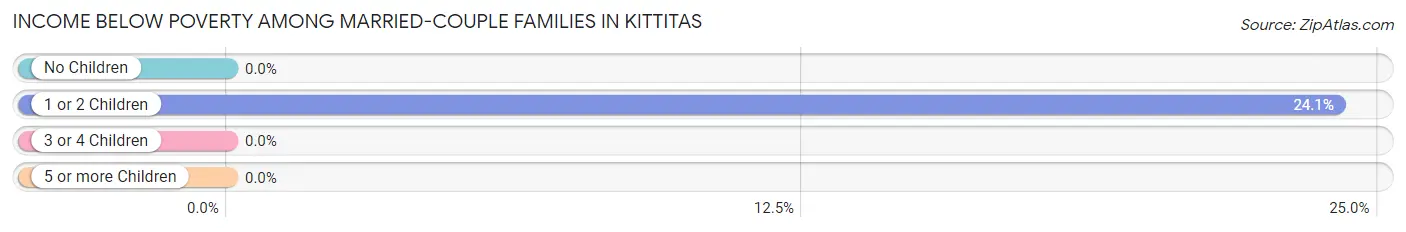
| Children | Above Poverty | Below Poverty |
| No Children | 146 (100.0%) | 0 (0.0%) |
| 1 or 2 Children | 63 (75.9%) | 20 (24.1%) |
| 3 or 4 Children | 15 (100.0%) | 0 (0.0%) |
| 5 or more Children | 0 (0.0%) | 0 (0.0%) |
| Total | 224 (91.8%) | 20 (8.2%) |
Income Below Poverty Among Single-Parent Households in Kittitas
According to the poverty data in Kittitas, 46.2% or 30 single-father households and 34.9% or 30 single-mother households are living below the poverty line. Among single-father households, those with 1 or 2 children have the highest poverty rate, with 19 households (82.6%) experiencing poverty. Likewise, among single-mother households, those with 3 or 4 children have the highest poverty rate, with 14 households (100.0%) falling below the poverty line.
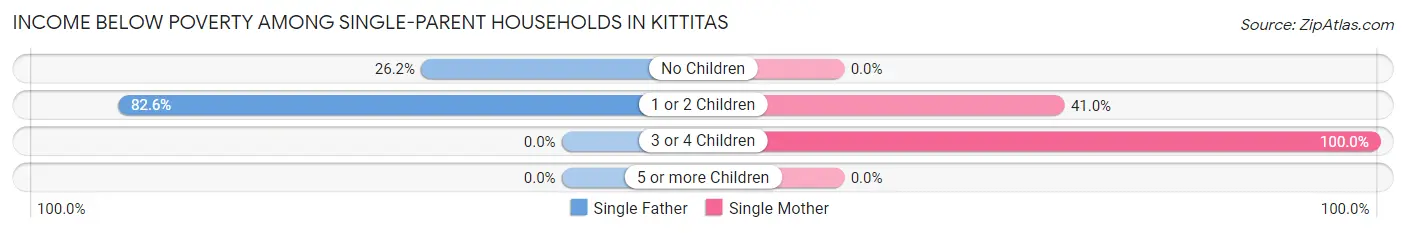
| Children | Single Father | Single Mother |
| No Children | 11 (26.2%) | 0 (0.0%) |
| 1 or 2 Children | 19 (82.6%) | 16 (41.0%) |
| 3 or 4 Children | 0 (0.0%) | 14 (100.0%) |
| 5 or more Children | 0 (0.0%) | 0 (0.0%) |
| Total | 30 (46.2%) | 30 (34.9%) |
Income Below Poverty Among Married-Couple vs Single-Parent Households in Kittitas
The poverty data for Kittitas shows that 20 of the married-couple family households (8.2%) and 60 of the single-parent households (39.7%) are living below the poverty level. Within the married-couple family households, those with 1 or 2 children have the highest poverty rate, with 20 households (24.1%) falling below the poverty line. Among the single-parent households, those with 3 or 4 children have the highest poverty rate, with 14 household (100.0%) living below poverty.
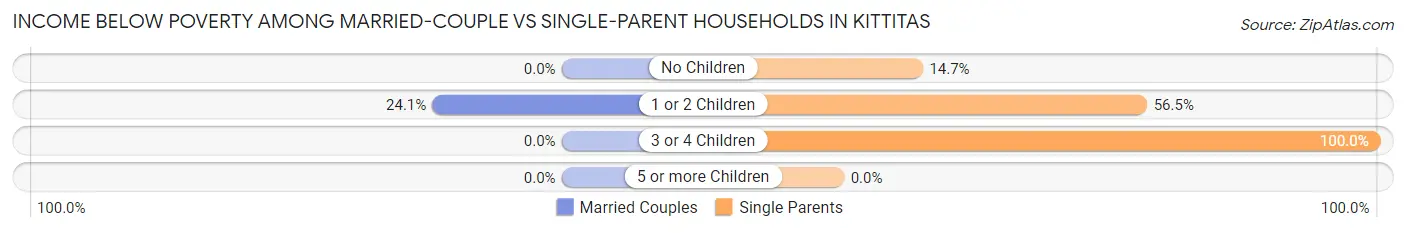
| Children | Married-Couple Families | Single-Parent Households |
| No Children | 0 (0.0%) | 11 (14.7%) |
| 1 or 2 Children | 20 (24.1%) | 35 (56.5%) |
| 3 or 4 Children | 0 (0.0%) | 14 (100.0%) |
| 5 or more Children | 0 (0.0%) | 0 (0.0%) |
| Total | 20 (8.2%) | 60 (39.7%) |
Race in Kittitas
The most populous races in Kittitas are White / Caucasian (886 | 69.2%), Hispanic or Latino (395 | 30.8%), and Some other Race (177 | 13.8%).
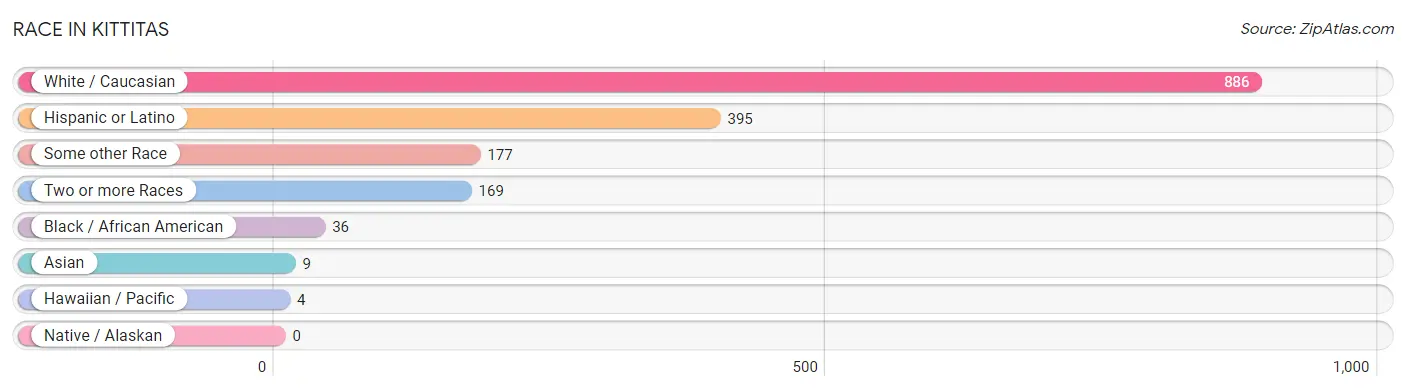
| Race | # Population | % Population |
| Asian | 9 | 0.7% |
| Black / African American | 36 | 2.8% |
| Hawaiian / Pacific | 4 | 0.3% |
| Hispanic or Latino | 395 | 30.8% |
| Native / Alaskan | 0 | 0.0% |
| White / Caucasian | 886 | 69.2% |
| Two or more Races | 169 | 13.2% |
| Some other Race | 177 | 13.8% |
| Total | 1,281 | 100.0% |
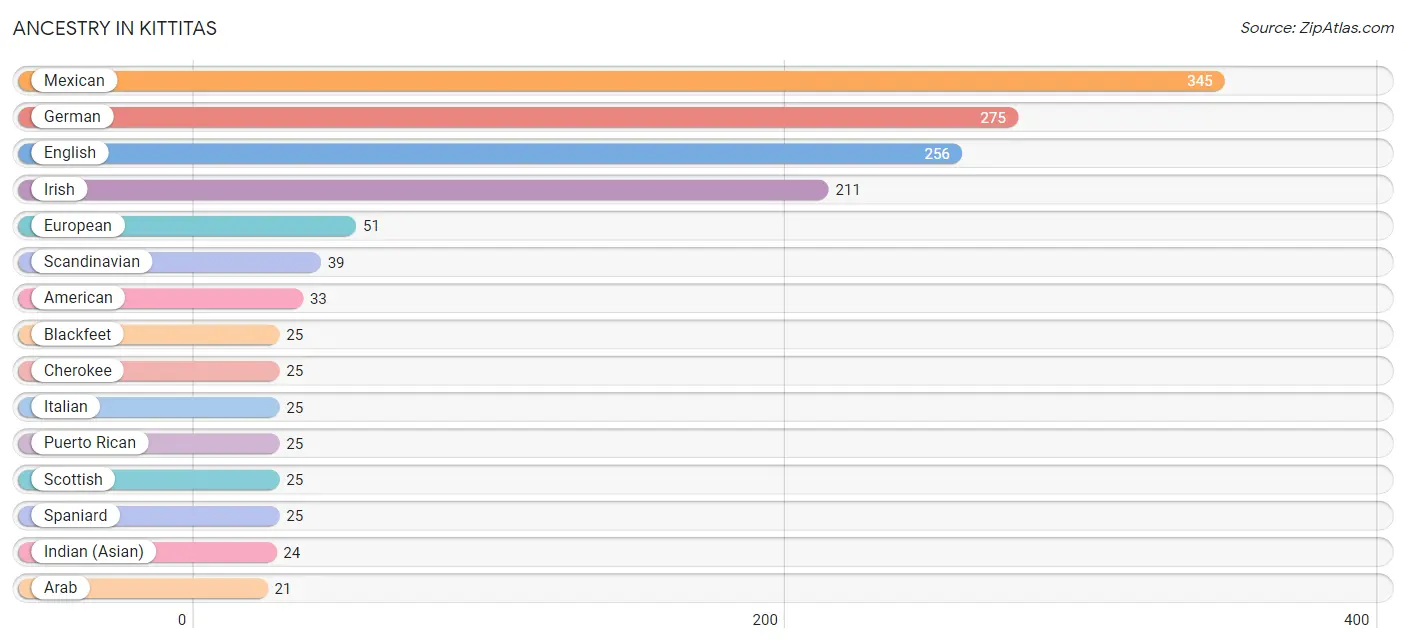
Ancestry in Kittitas
The most populous ancestries reported in Kittitas are Mexican (345 | 26.9%), German (275 | 21.5%), English (256 | 20.0%), Irish (211 | 16.5%), and European (51 | 4.0%), together accounting for 88.8% of all Kittitas residents.
| Ancestry | # Population | % Population |
| American | 33 | 2.6% |
| Arab | 21 | 1.6% |
| Basque | 7 | 0.5% |
| Blackfeet | 25 | 1.9% |
| British | 8 | 0.6% |
| Cherokee | 25 | 1.9% |
| Colville | 8 | 0.6% |
| Danish | 3 | 0.2% |
| Dutch | 8 | 0.6% |
| English | 256 | 20.0% |
| European | 51 | 4.0% |
| French | 12 | 0.9% |
| German | 275 | 21.5% |
| Indian (Asian) | 24 | 1.9% |
| Irish | 211 | 16.5% |
| Italian | 25 | 1.9% |
| Lebanese | 21 | 1.6% |
| Mexican | 345 | 26.9% |
| Native Hawaiian | 11 | 0.9% |
| Norwegian | 2 | 0.2% |
| Polish | 11 | 0.9% |
| Portuguese | 8 | 0.6% |
| Puerto Rican | 25 | 1.9% |
| Scandinavian | 39 | 3.0% |
| Scottish | 25 | 1.9% |
| Spaniard | 25 | 1.9% |
| Swedish | 20 | 1.6% |
| Swiss | 2 | 0.2% |
| Welsh | 14 | 1.1% | View All 29 Rows |
Immigrants in Kittitas
The most numerous immigrant groups reported in Kittitas came from Central America (62 | 4.8%), Latin America (62 | 4.8%), Mexico (62 | 4.8%), Asia (9 | 0.7%), and China (9 | 0.7%), together accounting for 15.9% of all Kittitas residents.
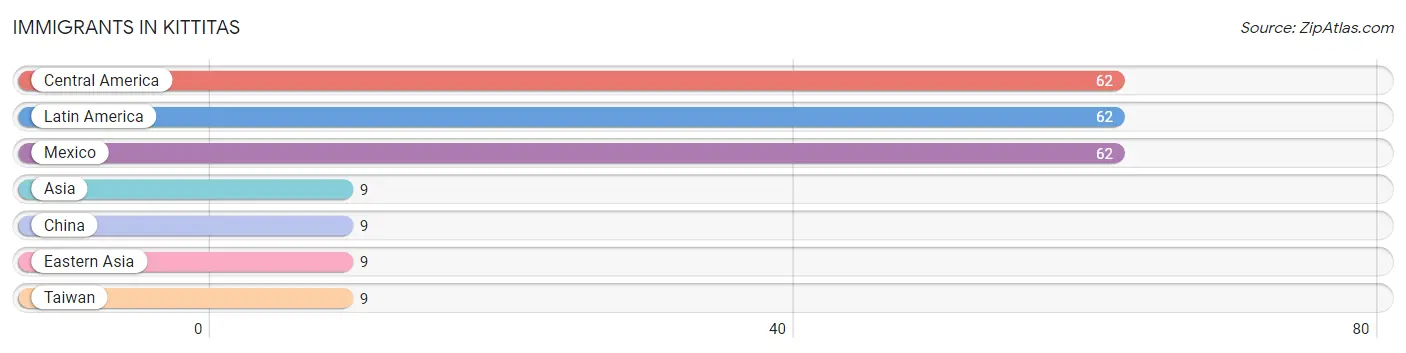
| Immigration Origin | # Population | % Population |
| Asia | 9 | 0.7% |
| Central America | 62 | 4.8% |
| China | 9 | 0.7% |
| Eastern Asia | 9 | 0.7% |
| Latin America | 62 | 4.8% |
| Mexico | 62 | 4.8% |
| Taiwan | 9 | 0.7% | View All 7 Rows |
Sex and Age in Kittitas
Sex and Age in Kittitas
The most populous age groups in Kittitas are 50 to 54 Years (81 | 10.9%) for men and 60 to 64 Years (67 | 12.4%) for women.
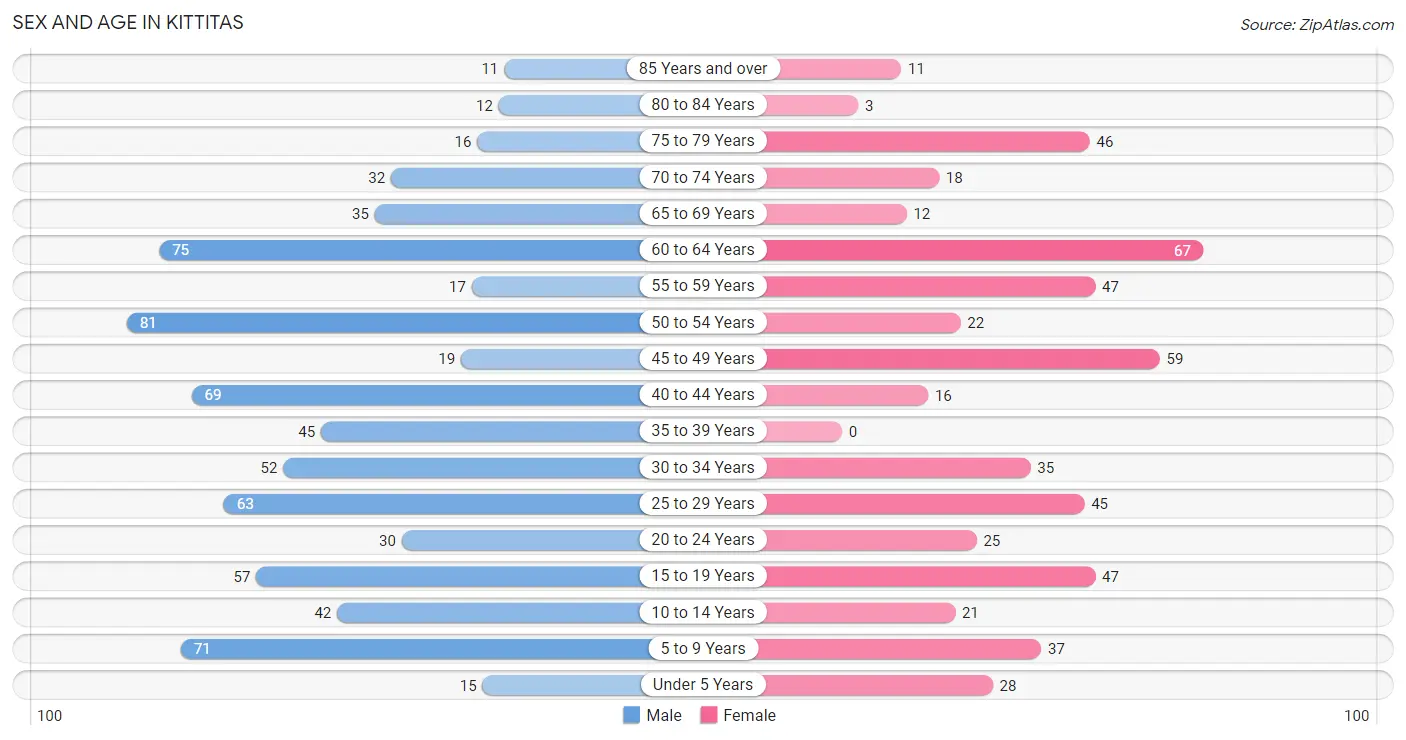
| Age Bracket | Male | Female |
| Under 5 Years | 15 (2.0%) | 28 (5.2%) |
| 5 to 9 Years | 71 (9.6%) | 37 (6.9%) |
| 10 to 14 Years | 42 (5.7%) | 21 (3.9%) |
| 15 to 19 Years | 57 (7.7%) | 47 (8.7%) |
| 20 to 24 Years | 30 (4.0%) | 25 (4.6%) |
| 25 to 29 Years | 63 (8.5%) | 45 (8.4%) |
| 30 to 34 Years | 52 (7.0%) | 35 (6.5%) |
| 35 to 39 Years | 45 (6.1%) | 0 (0.0%) |
| 40 to 44 Years | 69 (9.3%) | 16 (3.0%) |
| 45 to 49 Years | 19 (2.6%) | 59 (11.0%) |
| 50 to 54 Years | 81 (10.9%) | 22 (4.1%) |
| 55 to 59 Years | 17 (2.3%) | 47 (8.7%) |
| 60 to 64 Years | 75 (10.1%) | 67 (12.4%) |
| 65 to 69 Years | 35 (4.7%) | 12 (2.2%) |
| 70 to 74 Years | 32 (4.3%) | 18 (3.3%) |
| 75 to 79 Years | 16 (2.2%) | 46 (8.5%) |
| 80 to 84 Years | 12 (1.6%) | 3 (0.6%) |
| 85 Years and over | 11 (1.5%) | 11 (2.0%) |
| Total | 742 (100.0%) | 539 (100.0%) |
Families and Households in Kittitas
Median Family Size in Kittitas
The median family size in Kittitas is 2.52 persons per family, with married-couple families (244 | 61.8%) accounting for the largest median family size of 2.79 persons per family. On the other hand, single male/father families (65 | 16.5%) represent the smallest median family size with 1.63 persons per family.
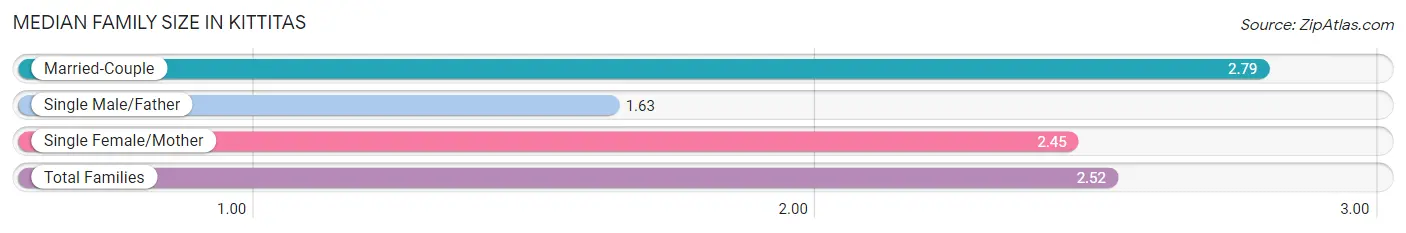
| Family Type | # Families | Family Size |
| Married-Couple | 244 (61.8%) | 2.79 |
| Single Male/Father | 65 (16.5%) | 1.63 |
| Single Female/Mother | 86 (21.8%) | 2.45 |
| Total Families | 395 (100.0%) | 2.52 |
Median Household Size in Kittitas
The median household size in Kittitas is 1.94 persons per household, with married-couple households (244 | 36.9%) accounting for the largest median household size of 2.79 persons per household. non-family households (266 | 40.2%) represent the smallest median household size with 1.06 persons per household.
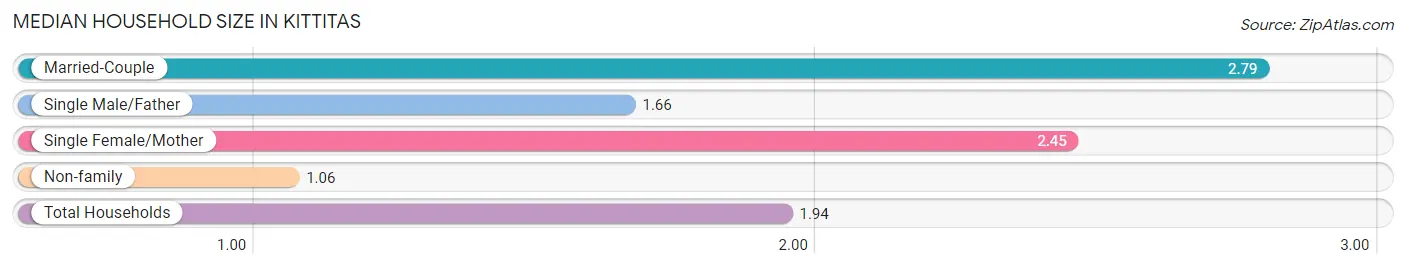
| Household Type | # Households | Household Size |
| Married-Couple | 244 (36.9%) | 2.79 |
| Single Male/Father | 65 (9.8%) | 1.66 |
| Single Female/Mother | 86 (13.0%) | 2.45 |
| Non-family | 266 (40.2%) | 1.06 |
| Total Households | 661 (100.0%) | 1.94 |
Household Size by Marriage Status in Kittitas
Out of a total of 661 households in Kittitas, 395 (59.8%) are family households, while 266 (40.2%) are nonfamily households. The most numerous type of family households are 2-person households, comprising 264, and the most common type of nonfamily households are 1-person households, comprising 213.
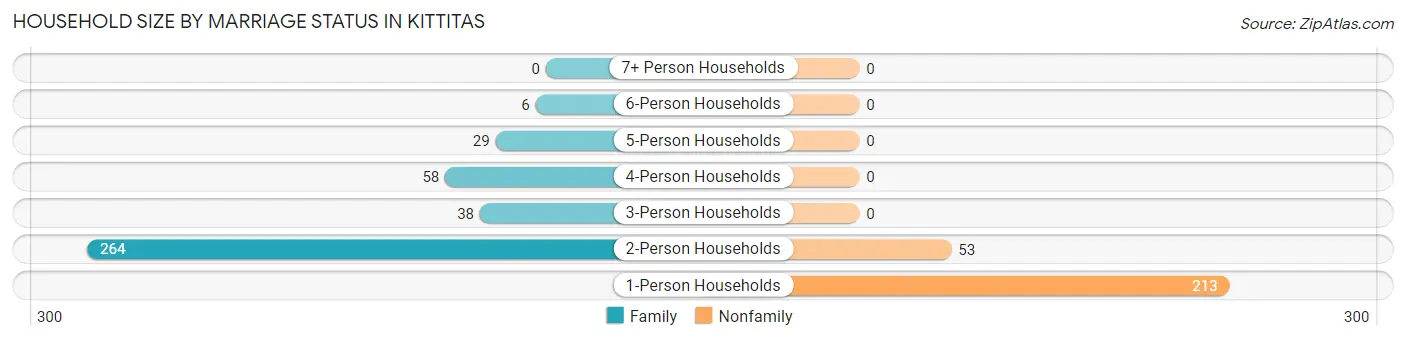
| Household Size | Family Households | Nonfamily Households |
| 1-Person Households | - | 213 (32.2%) |
| 2-Person Households | 264 (39.9%) | 53 (8.0%) |
| 3-Person Households | 38 (5.8%) | 0 (0.0%) |
| 4-Person Households | 58 (8.8%) | 0 (0.0%) |
| 5-Person Households | 29 (4.4%) | 0 (0.0%) |
| 6-Person Households | 6 (0.9%) | 0 (0.0%) |
| 7+ Person Households | 0 (0.0%) | 0 (0.0%) |
| Total | 395 (59.8%) | 266 (40.2%) |
Female Fertility in Kittitas
Fertility by Age in Kittitas
Average fertility rate in Kittitas is 38.0 births per 1,000 women. Women in the age bracket of 20 to 34 years have the highest fertility rate with 86.0 births per 1,000 women. Women in the age bracket of 20 to 34 years acount for 100.0% of all women with births.
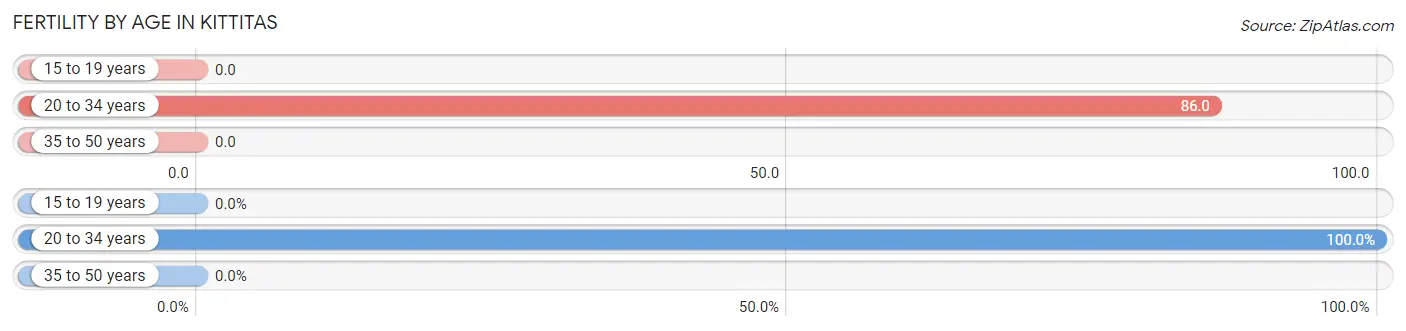
| Age Bracket | Women with Births | Births / 1,000 Women |
| 15 to 19 years | 0 (0.0%) | 0.0 |
| 20 to 34 years | 9 (100.0%) | 86.0 |
| 35 to 50 years | 0 (0.0%) | 0.0 |
| Total | 9 (100.0%) | 38.0 |
Fertility by Age by Marriage Status in Kittitas
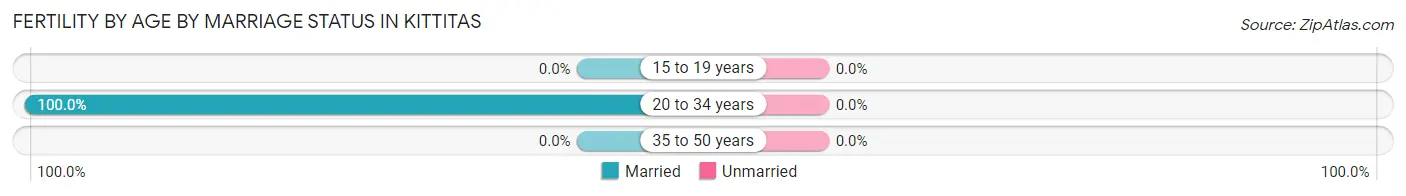
| Age Bracket | Married | Unmarried |
| 15 to 19 years | 0 (0.0%) | 0 (0.0%) |
| 20 to 34 years | 9 (100.0%) | 0 (0.0%) |
| 35 to 50 years | 0 (0.0%) | 0 (0.0%) |
| Total | 9 (100.0%) | 0 (0.0%) |
Fertility by Education in Kittitas
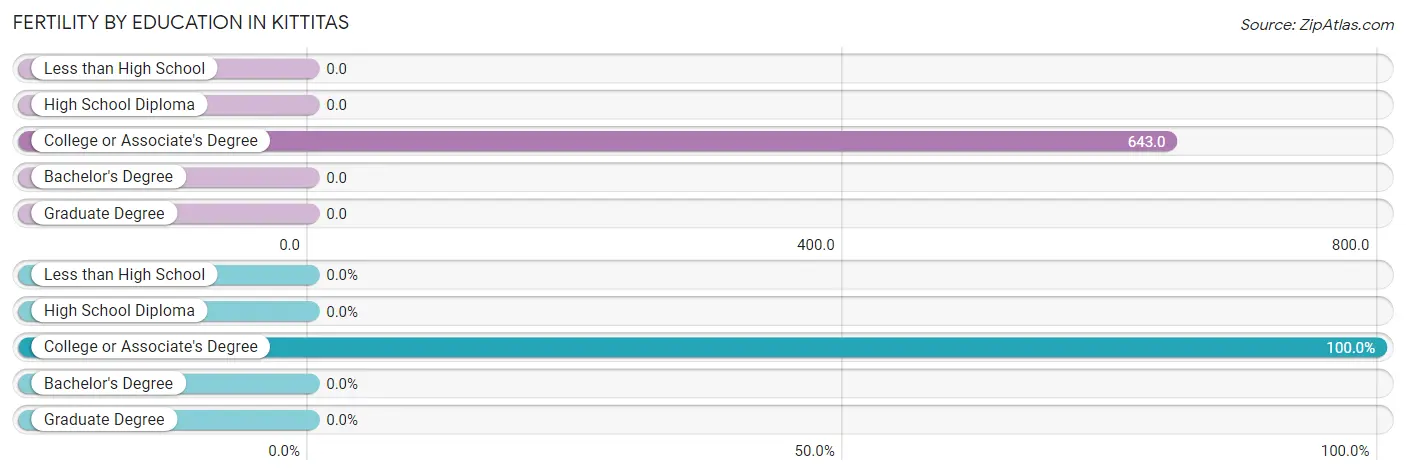
| Educational Attainment | Women with Births | Births / 1,000 Women |
| Less than High School | 0 (0.0%) | 0.0 |
| High School Diploma | 0 (0.0%) | 0.0 |
| College or Associate's Degree | 9 (100.0%) | 643.0 |
| Bachelor's Degree | 0 (0.0%) | 0.0 |
| Graduate Degree | 0 (0.0%) | 0.0 |
| Total | 9 (100.0%) | 38.0 |
Fertility by Education by Marriage Status in Kittitas
| Educational Attainment | Married | Unmarried |
| Less than High School | 0 (0.0%) | 0 (0.0%) |
| High School Diploma | 0 (0.0%) | 0 (0.0%) |
| College or Associate's Degree | 9 (100.0%) | 0 (0.0%) |
| Bachelor's Degree | 0 (0.0%) | 0 (0.0%) |
| Graduate Degree | 0 (0.0%) | 0 (0.0%) |
| Total | 9 (100.0%) | 0 (0.0%) |
Employment Characteristics in Kittitas
Employment by Class of Employer in Kittitas
Among the 571 employed individuals in Kittitas, private company employees (284 | 49.7%), state government employees (75 | 13.1%), and federal government employees (65 | 11.4%) make up the most common classes of employment.
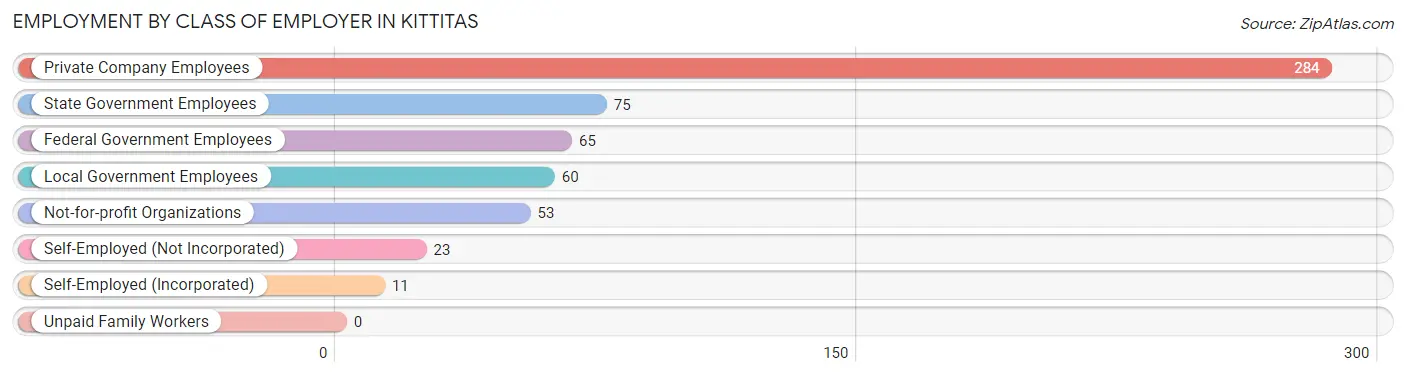
| Employer Class | # Employees | % Employees |
| Private Company Employees | 284 | 49.7% |
| Self-Employed (Incorporated) | 11 | 1.9% |
| Self-Employed (Not Incorporated) | 23 | 4.0% |
| Not-for-profit Organizations | 53 | 9.3% |
| Local Government Employees | 60 | 10.5% |
| State Government Employees | 75 | 13.1% |
| Federal Government Employees | 65 | 11.4% |
| Unpaid Family Workers | 0 | 0.0% |
| Total | 571 | 100.0% |
Employment Status by Age in Kittitas
According to the labor force statistics for Kittitas, out of the total population over 16 years of age (1,046), 60.2% or 630 individuals are in the labor force, with 3.9% or 25 of them unemployed. The age group with the highest labor force participation rate is 55 to 59 years, with 89.1% or 57 individuals in the labor force. Within the labor force, the 60 to 64 years age range has the highest percentage of unemployed individuals, with 37.7% or 20 of them being unemployed.
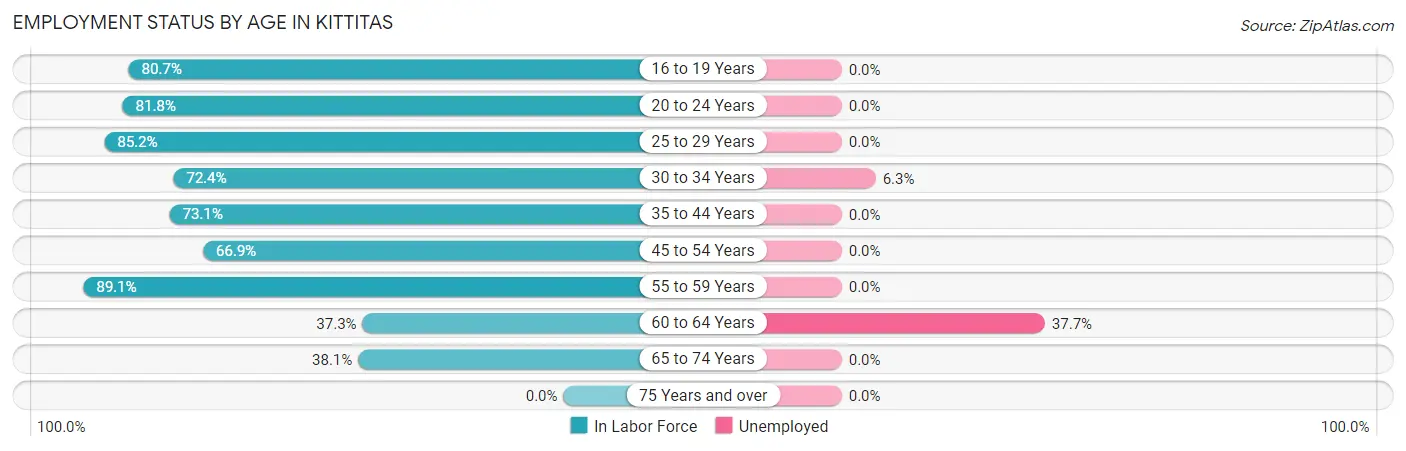
| Age Bracket | In Labor Force | Unemployed |
| 16 to 19 Years | 67 (80.7%) | 0 (0.0%) |
| 20 to 24 Years | 45 (81.8%) | 0 (0.0%) |
| 25 to 29 Years | 92 (85.2%) | 0 (0.0%) |
| 30 to 34 Years | 63 (72.4%) | 4 (6.3%) |
| 35 to 44 Years | 95 (73.1%) | 0 (0.0%) |
| 45 to 54 Years | 121 (66.9%) | 0 (0.0%) |
| 55 to 59 Years | 57 (89.1%) | 0 (0.0%) |
| 60 to 64 Years | 53 (37.3%) | 20 (37.7%) |
| 65 to 74 Years | 37 (38.1%) | 0 (0.0%) |
| 75 Years and over | 0 (0.0%) | 0 (0.0%) |
| Total | 630 (60.2%) | 25 (3.9%) |
Employment Status by Educational Attainment in Kittitas
According to labor force statistics for Kittitas, 67.6% of individuals (481) out of the total population between 25 and 64 years of age (712) are in the labor force, with 5.2% or 25 of them being unemployed. The group with the highest labor force participation rate are those with the educational attainment of bachelor's degree or higher, with 88.1% or 177 individuals in the labor force. Within the labor force, individuals with less than high school education have the highest percentage of unemployment, with 13.3% or 4 of them being unemployed.
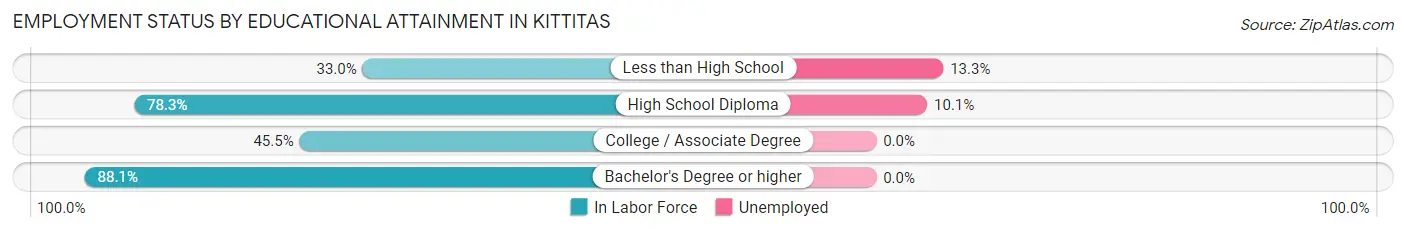
| Educational Attainment | In Labor Force | Unemployed |
| Less than High School | 30 (33.0%) | 12 (13.3%) |
| High School Diploma | 198 (78.3%) | 26 (10.1%) |
| College / Associate Degree | 76 (45.5%) | 0 (0.0%) |
| Bachelor's Degree or higher | 177 (88.1%) | 0 (0.0%) |
| Total | 481 (67.6%) | 37 (5.2%) |
Employment Occupations by Sex in Kittitas
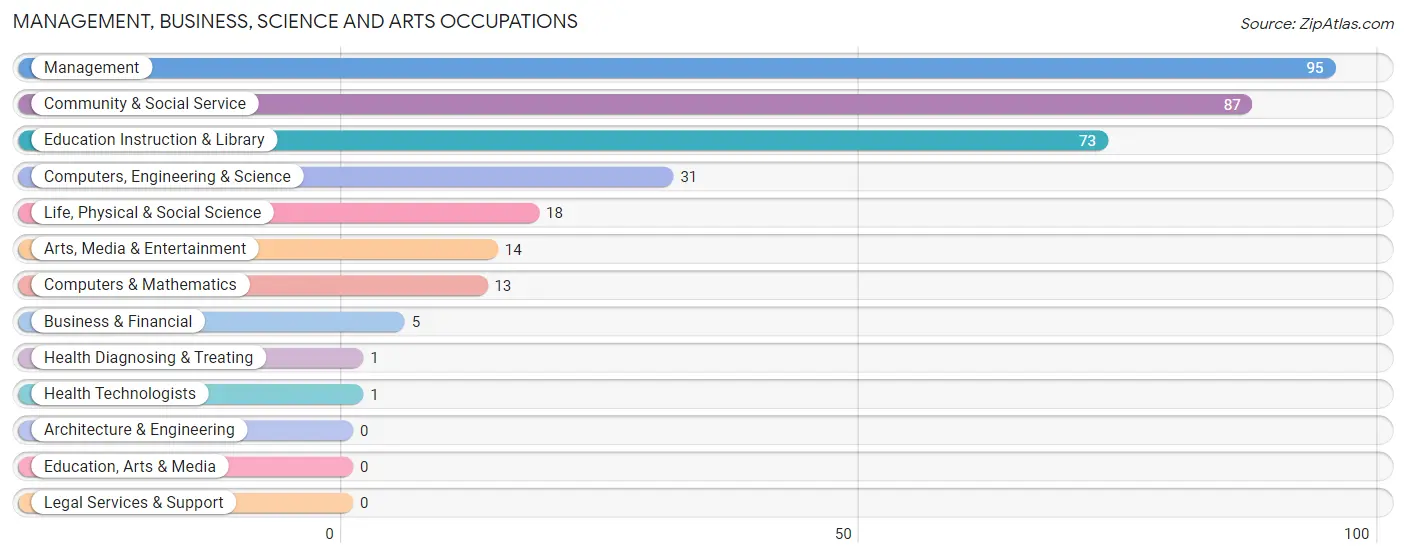
Management, Business, Science and Arts Occupations
The most common Management, Business, Science and Arts occupations in Kittitas are Management (95 | 16.2%), Community & Social Service (87 | 14.8%), Education Instruction & Library (73 | 12.5%), Computers, Engineering & Science (31 | 5.3%), and Life, Physical & Social Science (18 | 3.1%).
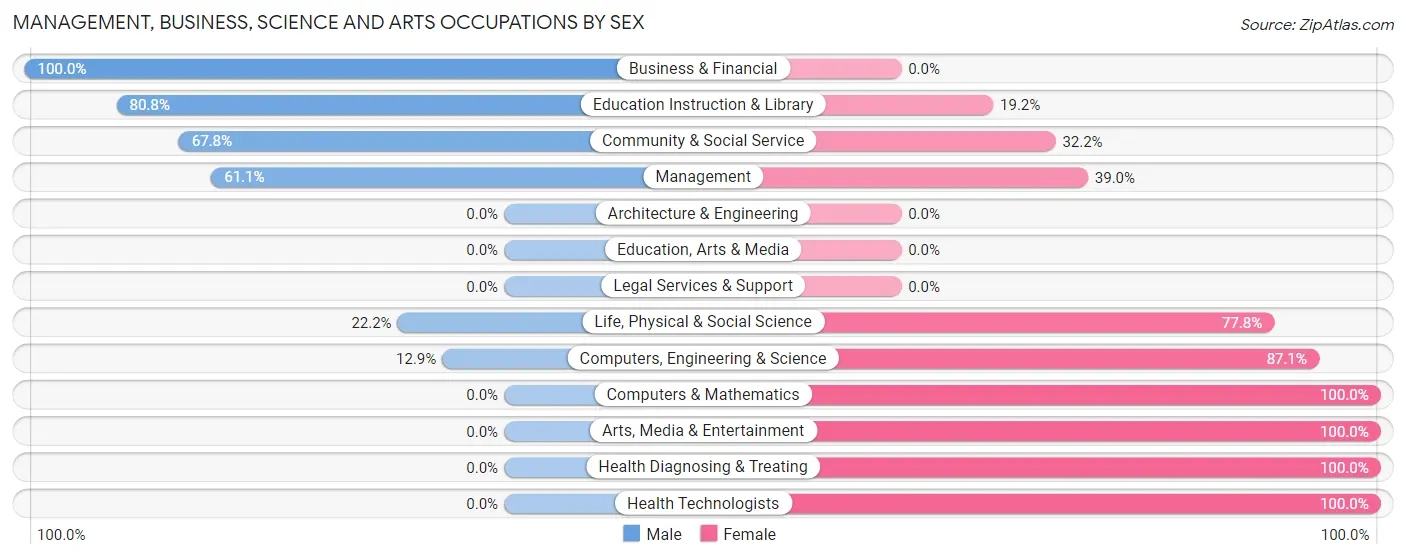
Management, Business, Science and Arts Occupations by Sex
Within the Management, Business, Science and Arts occupations in Kittitas, the most male-oriented occupations are Business & Financial (100.0%), Education Instruction & Library (80.8%), and Community & Social Service (67.8%), while the most female-oriented occupations are Computers & Mathematics (100.0%), Arts, Media & Entertainment (100.0%), and Health Diagnosing & Treating (100.0%).
| Occupation | Male | Female |
| Management | 58 (61.1%) | 37 (39.0%) |
| Business & Financial | 5 (100.0%) | 0 (0.0%) |
| Computers, Engineering & Science | 4 (12.9%) | 27 (87.1%) |
| Computers & Mathematics | 0 (0.0%) | 13 (100.0%) |
| Architecture & Engineering | 0 (0.0%) | 0 (0.0%) |
| Life, Physical & Social Science | 4 (22.2%) | 14 (77.8%) |
| Community & Social Service | 59 (67.8%) | 28 (32.2%) |
| Education, Arts & Media | 0 (0.0%) | 0 (0.0%) |
| Legal Services & Support | 0 (0.0%) | 0 (0.0%) |
| Education Instruction & Library | 59 (80.8%) | 14 (19.2%) |
| Arts, Media & Entertainment | 0 (0.0%) | 14 (100.0%) |
| Health Diagnosing & Treating | 0 (0.0%) | 1 (100.0%) |
| Health Technologists | 0 (0.0%) | 1 (100.0%) |
| Total (Category) | 126 (57.5%) | 93 (42.5%) |
| Total (Overall) | 368 (62.8%) | 218 (37.2%) |
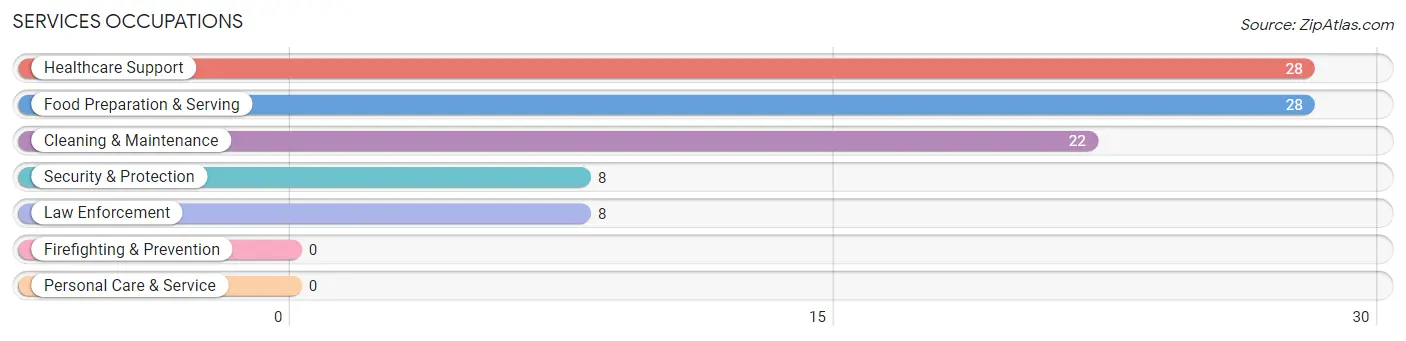
Services Occupations
The most common Services occupations in Kittitas are Healthcare Support (28 | 4.8%), Food Preparation & Serving (28 | 4.8%), Cleaning & Maintenance (22 | 3.7%), Security & Protection (8 | 1.4%), and Law Enforcement (8 | 1.4%).
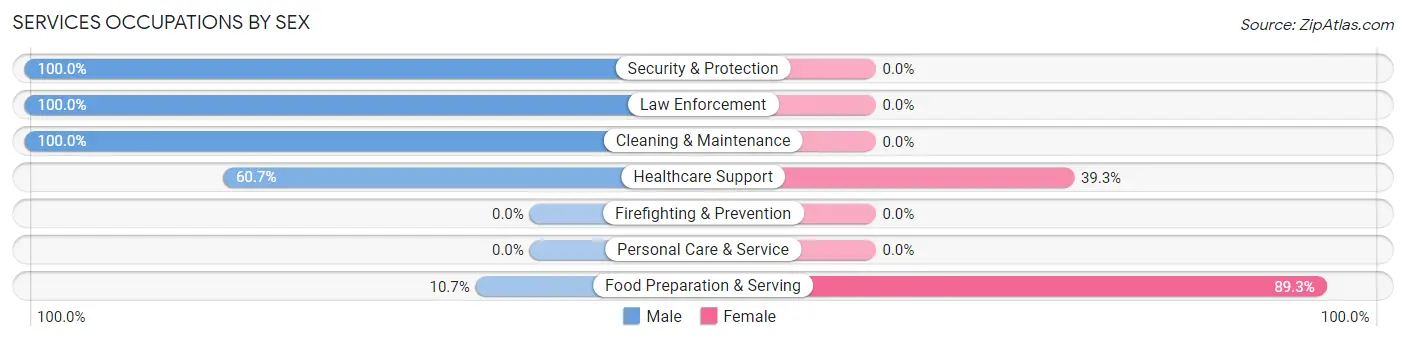
Services Occupations by Sex
Within the Services occupations in Kittitas, the most male-oriented occupations are Security & Protection (100.0%), Law Enforcement (100.0%), and Cleaning & Maintenance (100.0%), while the most female-oriented occupations are Food Preparation & Serving (89.3%), and Healthcare Support (39.3%).
| Occupation | Male | Female |
| Healthcare Support | 17 (60.7%) | 11 (39.3%) |
| Security & Protection | 8 (100.0%) | 0 (0.0%) |
| Firefighting & Prevention | 0 (0.0%) | 0 (0.0%) |
| Law Enforcement | 8 (100.0%) | 0 (0.0%) |
| Food Preparation & Serving | 3 (10.7%) | 25 (89.3%) |
| Cleaning & Maintenance | 22 (100.0%) | 0 (0.0%) |
| Personal Care & Service | 0 (0.0%) | 0 (0.0%) |
| Total (Category) | 50 (58.1%) | 36 (41.9%) |
| Total (Overall) | 368 (62.8%) | 218 (37.2%) |
Sales and Office Occupations
The most common Sales and Office occupations in Kittitas are Sales & Related (36 | 6.1%), and Office & Administration (30 | 5.1%).
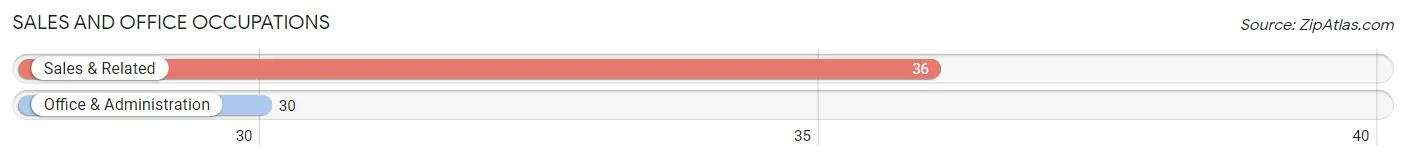
Sales and Office Occupations by Sex
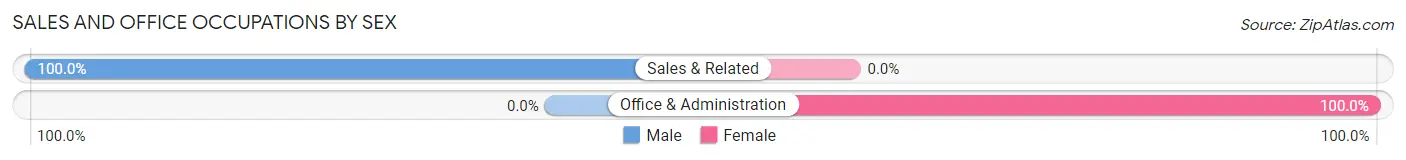
| Occupation | Male | Female |
| Sales & Related | 36 (100.0%) | 0 (0.0%) |
| Office & Administration | 0 (0.0%) | 30 (100.0%) |
| Total (Category) | 36 (54.5%) | 30 (45.5%) |
| Total (Overall) | 368 (62.8%) | 218 (37.2%) |
Natural Resources, Construction and Maintenance Occupations
The most common Natural Resources, Construction and Maintenance occupations in Kittitas are Construction & Extraction (59 | 10.1%), Installation, Maintenance & Repair (36 | 6.1%), and Farming, Fishing & Forestry (33 | 5.6%).
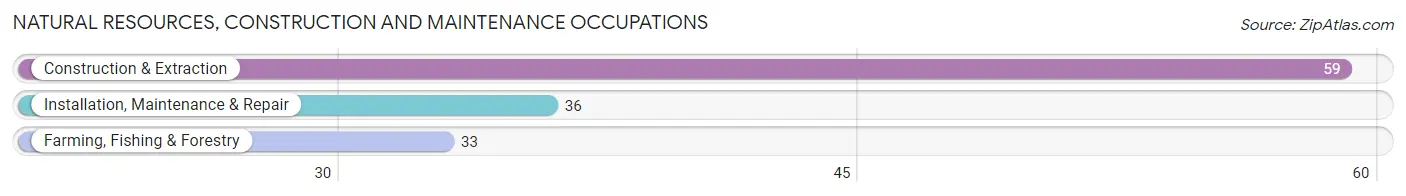
Natural Resources, Construction and Maintenance Occupations by Sex
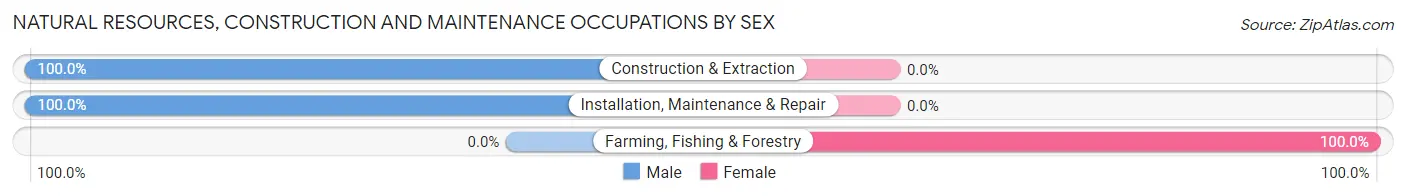
| Occupation | Male | Female |
| Farming, Fishing & Forestry | 0 (0.0%) | 33 (100.0%) |
| Construction & Extraction | 59 (100.0%) | 0 (0.0%) |
| Installation, Maintenance & Repair | 36 (100.0%) | 0 (0.0%) |
| Total (Category) | 95 (74.2%) | 33 (25.8%) |
| Total (Overall) | 368 (62.8%) | 218 (37.2%) |
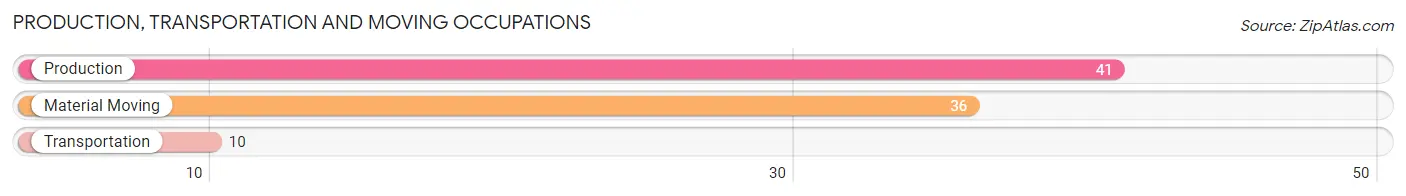
Production, Transportation and Moving Occupations
The most common Production, Transportation and Moving occupations in Kittitas are Production (41 | 7.0%), Material Moving (36 | 6.1%), and Transportation (10 | 1.7%).
Production, Transportation and Moving Occupations by Sex
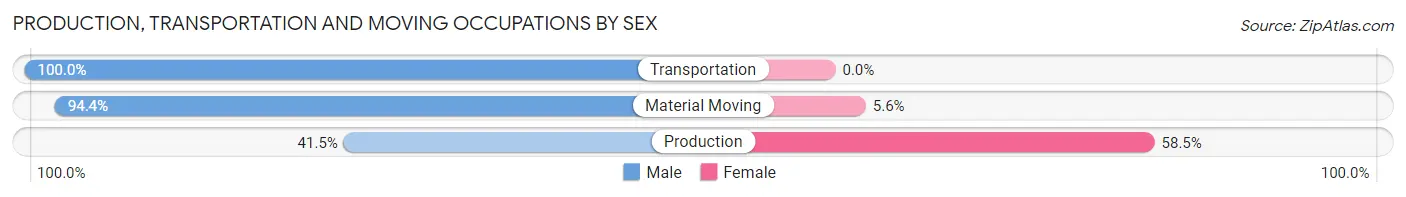
| Occupation | Male | Female |
| Production | 17 (41.5%) | 24 (58.5%) |
| Transportation | 10 (100.0%) | 0 (0.0%) |
| Material Moving | 34 (94.4%) | 2 (5.6%) |
| Total (Category) | 61 (70.1%) | 26 (29.9%) |
| Total (Overall) | 368 (62.8%) | 218 (37.2%) |
Employment Industries by Sex in Kittitas
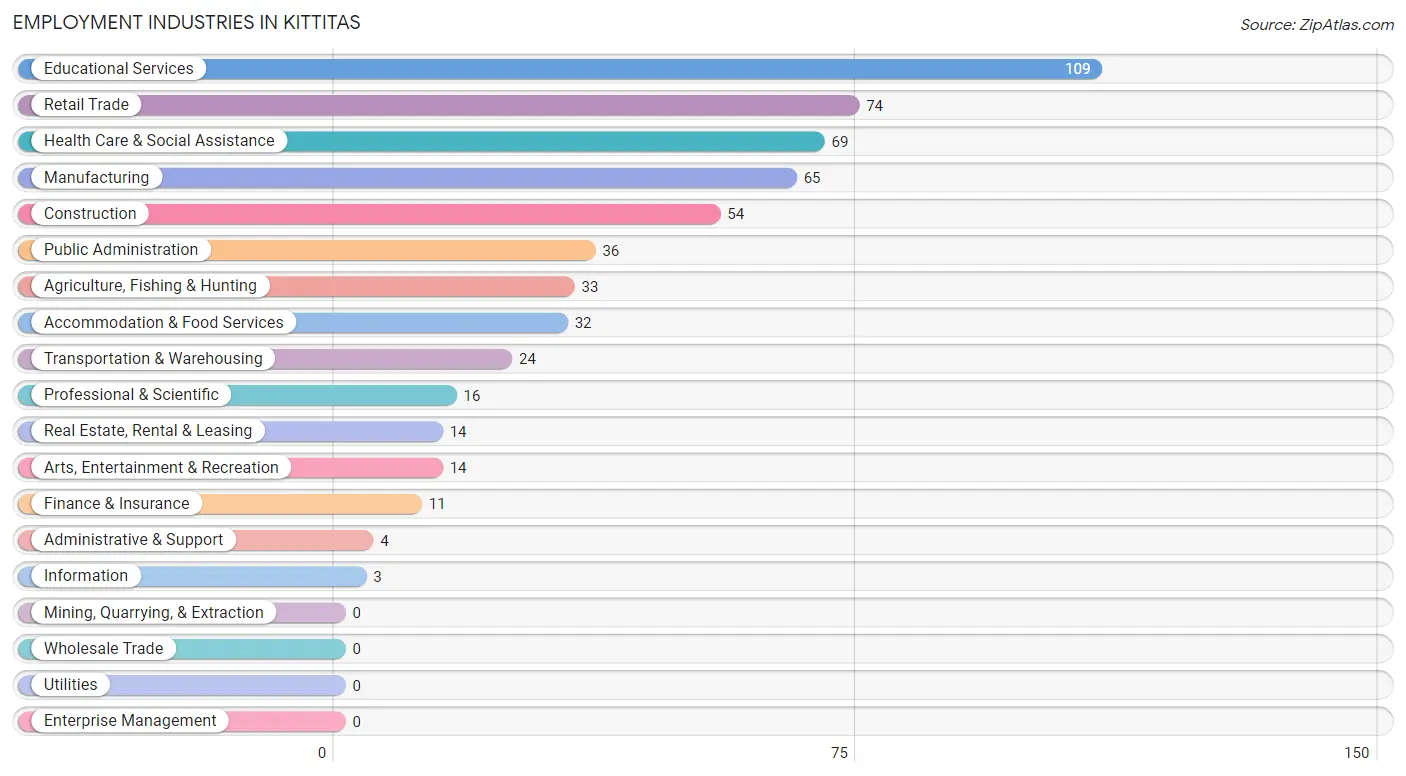
Employment Industries in Kittitas
The major employment industries in Kittitas include Educational Services (109 | 18.6%), Retail Trade (74 | 12.6%), Health Care & Social Assistance (69 | 11.8%), Manufacturing (65 | 11.1%), and Construction (54 | 9.2%).
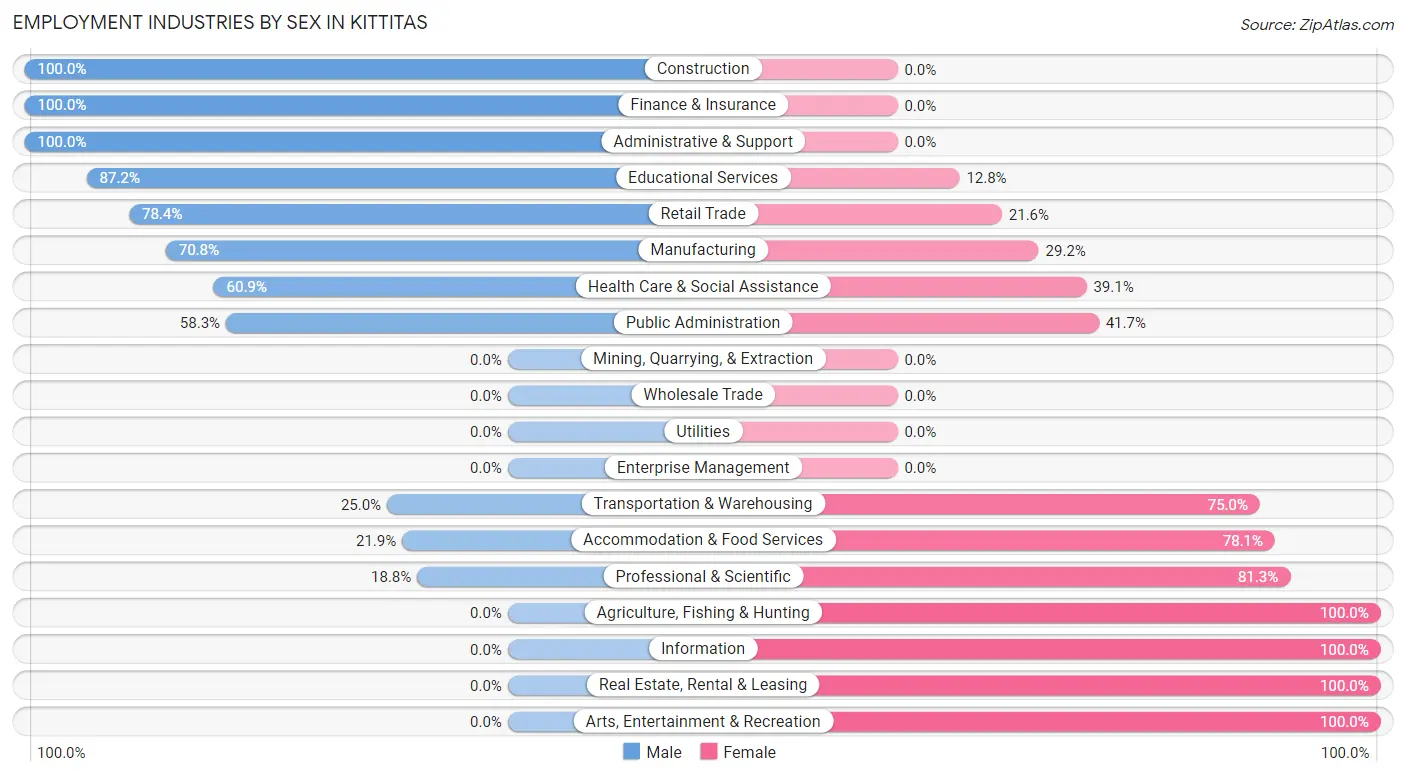
Employment Industries by Sex in Kittitas
The Kittitas industries that see more men than women are Construction (100.0%), Finance & Insurance (100.0%), and Administrative & Support (100.0%), whereas the industries that tend to have a higher number of women are Agriculture, Fishing & Hunting (100.0%), Information (100.0%), and Real Estate, Rental & Leasing (100.0%).
| Industry | Male | Female |
| Agriculture, Fishing & Hunting | 0 (0.0%) | 33 (100.0%) |
| Mining, Quarrying, & Extraction | 0 (0.0%) | 0 (0.0%) |
| Construction | 54 (100.0%) | 0 (0.0%) |
| Manufacturing | 46 (70.8%) | 19 (29.2%) |
| Wholesale Trade | 0 (0.0%) | 0 (0.0%) |
| Retail Trade | 58 (78.4%) | 16 (21.6%) |
| Transportation & Warehousing | 6 (25.0%) | 18 (75.0%) |
| Utilities | 0 (0.0%) | 0 (0.0%) |
| Information | 0 (0.0%) | 3 (100.0%) |
| Finance & Insurance | 11 (100.0%) | 0 (0.0%) |
| Real Estate, Rental & Leasing | 0 (0.0%) | 14 (100.0%) |
| Professional & Scientific | 3 (18.8%) | 13 (81.2%) |
| Enterprise Management | 0 (0.0%) | 0 (0.0%) |
| Administrative & Support | 4 (100.0%) | 0 (0.0%) |
| Educational Services | 95 (87.2%) | 14 (12.8%) |
| Health Care & Social Assistance | 42 (60.9%) | 27 (39.1%) |
| Arts, Entertainment & Recreation | 0 (0.0%) | 14 (100.0%) |
| Accommodation & Food Services | 7 (21.9%) | 25 (78.1%) |
| Public Administration | 21 (58.3%) | 15 (41.7%) |
| Total | 368 (62.8%) | 218 (37.2%) |
Education in Kittitas
School Enrollment in Kittitas
The most common levels of schooling among the 300 students in Kittitas are high school (104 | 34.7%), elementary school (67 | 22.3%), and middle school (48 | 16.0%).
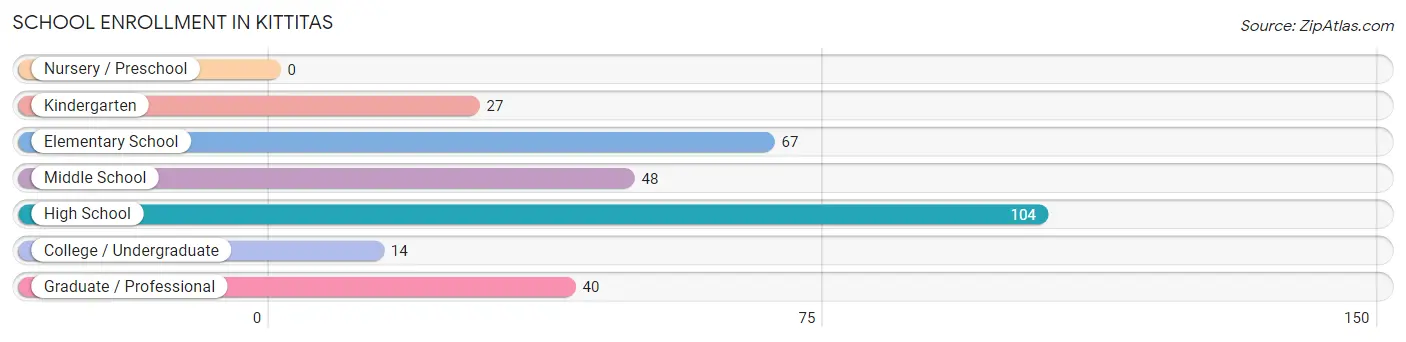
| School Level | # Students | % Students |
| Nursery / Preschool | 0 | 0.0% |
| Kindergarten | 27 | 9.0% |
| Elementary School | 67 | 22.3% |
| Middle School | 48 | 16.0% |
| High School | 104 | 34.7% |
| College / Undergraduate | 14 | 4.7% |
| Graduate / Professional | 40 | 13.3% |
| Total | 300 | 100.0% |
School Enrollment by Age by Funding Source in Kittitas
Out of a total of 300 students who are enrolled in schools in Kittitas, 11 (3.7%) attend a private institution, while the remaining 289 (96.3%) are enrolled in public schools. The age group of 18 to 19 year olds has the highest likelihood of being enrolled in private schools, with 11 (78.6% in the age bracket) enrolled. Conversely, the age group of 5 to 9 year old has the lowest likelihood of being enrolled in a private school, with 94 (100.0% in the age bracket) attending a public institution.
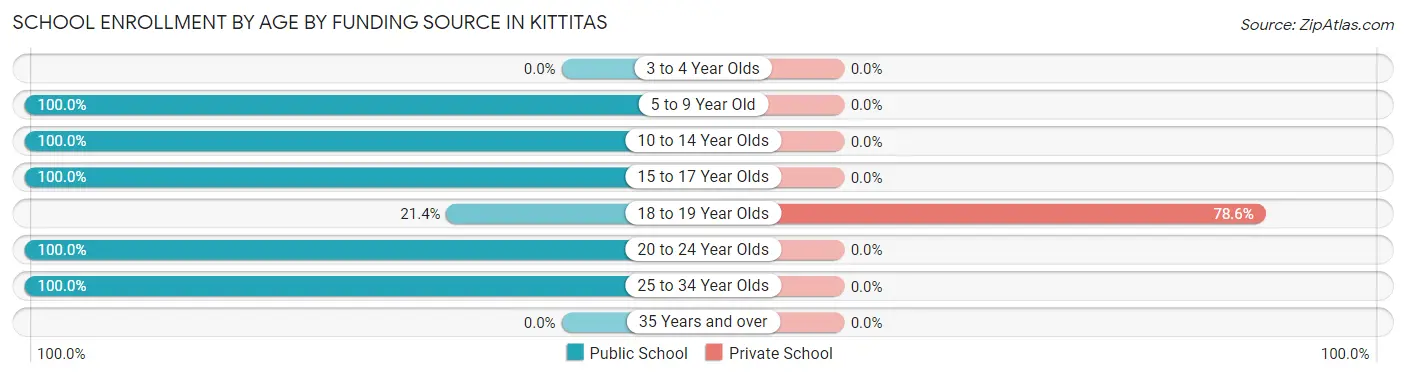
| Age Bracket | Public School | Private School |
| 3 to 4 Year Olds | 0 (0.0%) | 0 (0.0%) |
| 5 to 9 Year Old | 94 (100.0%) | 0 (0.0%) |
| 10 to 14 Year Olds | 63 (100.0%) | 0 (0.0%) |
| 15 to 17 Year Olds | 75 (100.0%) | 0 (0.0%) |
| 18 to 19 Year Olds | 3 (21.4%) | 11 (78.6%) |
| 20 to 24 Year Olds | 3 (100.0%) | 0 (0.0%) |
| 25 to 34 Year Olds | 51 (100.0%) | 0 (0.0%) |
| 35 Years and over | 0 (0.0%) | 0 (0.0%) |
| Total | 289 (96.3%) | 11 (3.7%) |
Educational Attainment by Field of Study in Kittitas
Education (95 | 25.6%), arts & humanities (68 | 18.3%), social sciences (60 | 16.2%), science & technology (48 | 12.9%), and bio, nature & agricultural (39 | 10.5%) are the most common fields of study among 371 individuals in Kittitas who have obtained a bachelor's degree or higher.
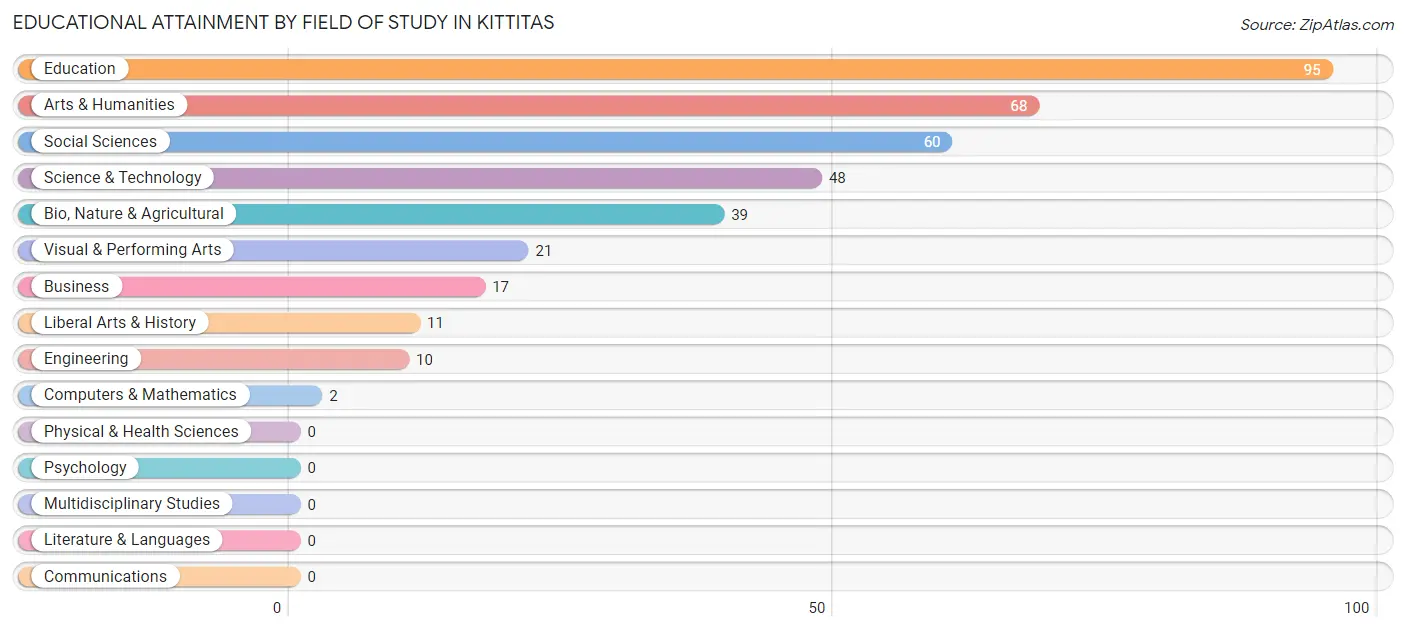
| Field of Study | # Graduates | % Graduates |
| Computers & Mathematics | 2 | 0.5% |
| Bio, Nature & Agricultural | 39 | 10.5% |
| Physical & Health Sciences | 0 | 0.0% |
| Psychology | 0 | 0.0% |
| Social Sciences | 60 | 16.2% |
| Engineering | 10 | 2.7% |
| Multidisciplinary Studies | 0 | 0.0% |
| Science & Technology | 48 | 12.9% |
| Business | 17 | 4.6% |
| Education | 95 | 25.6% |
| Literature & Languages | 0 | 0.0% |
| Liberal Arts & History | 11 | 3.0% |
| Visual & Performing Arts | 21 | 5.7% |
| Communications | 0 | 0.0% |
| Arts & Humanities | 68 | 18.3% |
| Total | 371 | 100.0% |
Transportation & Commute in Kittitas
Vehicle Availability by Sex in Kittitas
The most prevalent vehicle ownership categories in Kittitas are males with 2 vehicles (148, accounting for 41.9%) and females with 2 vehicles (59, making up 67.9%).
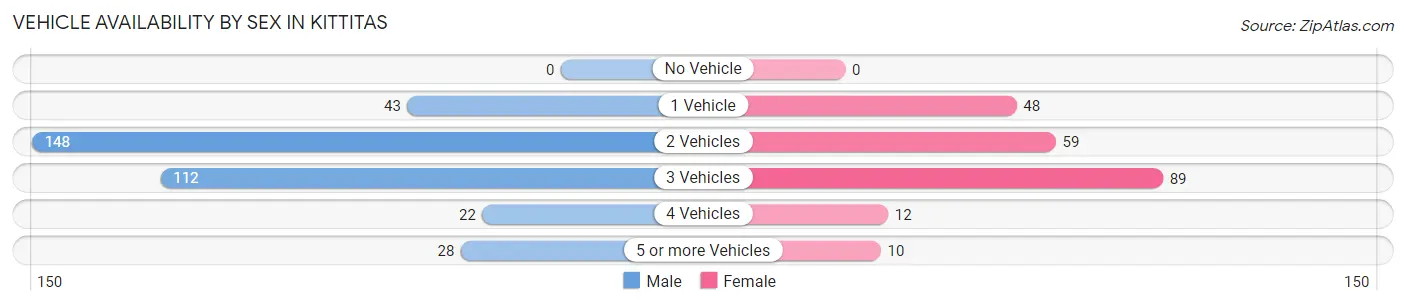
| Vehicles Available | Male | Female |
| No Vehicle | 0 (0.0%) | 0 (0.0%) |
| 1 Vehicle | 43 (12.2%) | 48 (22.0%) |
| 2 Vehicles | 148 (41.9%) | 59 (27.1%) |
| 3 Vehicles | 112 (31.7%) | 89 (40.8%) |
| 4 Vehicles | 22 (6.2%) | 12 (5.5%) |
| 5 or more Vehicles | 28 (7.9%) | 10 (4.6%) |
| Total | 353 (100.0%) | 218 (100.0%) |
Commute Time in Kittitas
The most frequently occuring commute durations in Kittitas are 15 to 19 minutes (128 commuters, 25.2%), 10 to 14 minutes (99 commuters, 19.5%), and 45 to 59 minutes (68 commuters, 13.4%).
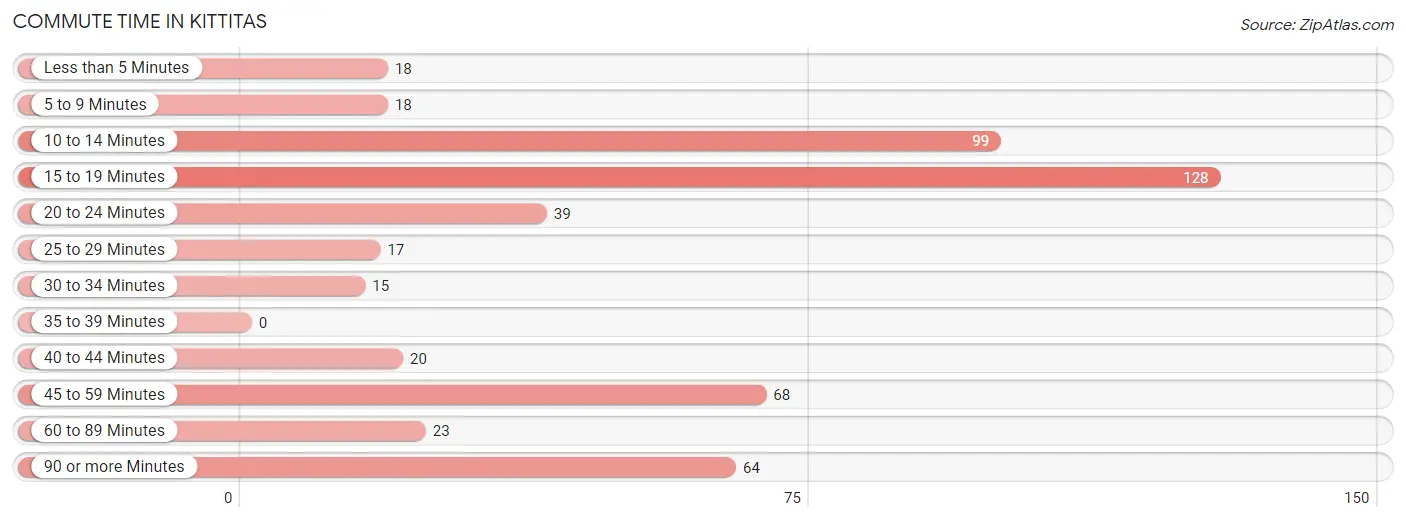
| Commute Time | # Commuters | % Commuters |
| Less than 5 Minutes | 18 | 3.5% |
| 5 to 9 Minutes | 18 | 3.5% |
| 10 to 14 Minutes | 99 | 19.5% |
| 15 to 19 Minutes | 128 | 25.2% |
| 20 to 24 Minutes | 39 | 7.7% |
| 25 to 29 Minutes | 17 | 3.3% |
| 30 to 34 Minutes | 15 | 2.9% |
| 35 to 39 Minutes | 0 | 0.0% |
| 40 to 44 Minutes | 20 | 3.9% |
| 45 to 59 Minutes | 68 | 13.4% |
| 60 to 89 Minutes | 23 | 4.5% |
| 90 or more Minutes | 64 | 12.6% |
Commute Time by Sex in Kittitas
The most common commute times in Kittitas are 15 to 19 minutes (91 commuters, 27.0%) for males and 10 to 14 minutes (41 commuters, 23.8%) for females.
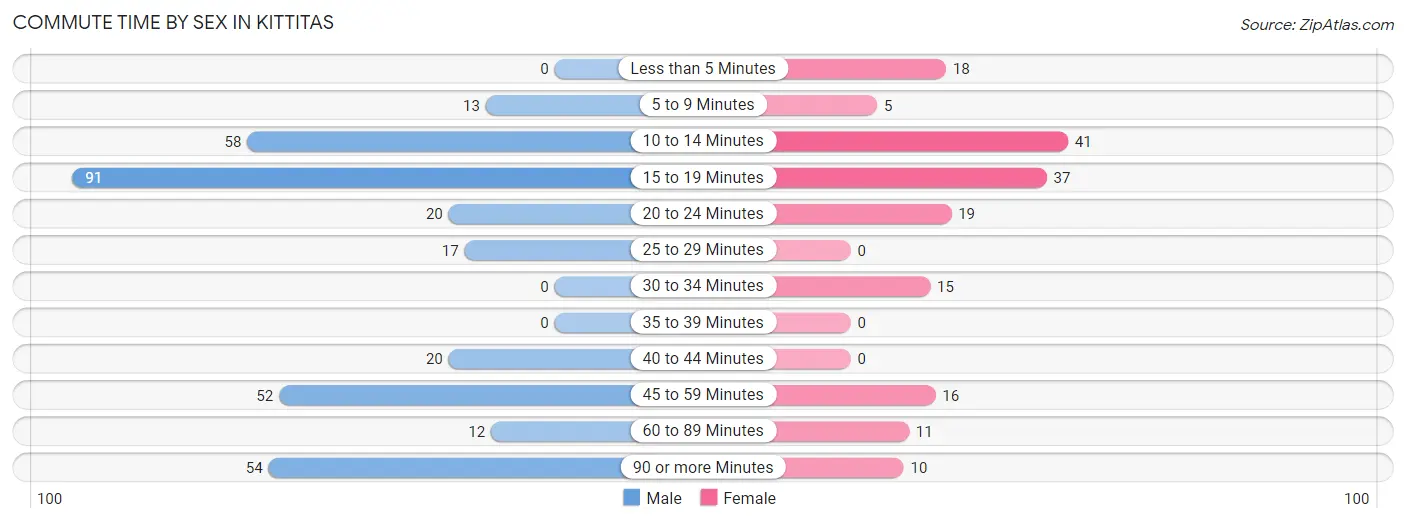
| Commute Time | Male | Female |
| Less than 5 Minutes | 0 (0.0%) | 18 (10.5%) |
| 5 to 9 Minutes | 13 (3.9%) | 5 (2.9%) |
| 10 to 14 Minutes | 58 (17.2%) | 41 (23.8%) |
| 15 to 19 Minutes | 91 (27.0%) | 37 (21.5%) |
| 20 to 24 Minutes | 20 (5.9%) | 19 (11.1%) |
| 25 to 29 Minutes | 17 (5.0%) | 0 (0.0%) |
| 30 to 34 Minutes | 0 (0.0%) | 15 (8.7%) |
| 35 to 39 Minutes | 0 (0.0%) | 0 (0.0%) |
| 40 to 44 Minutes | 20 (5.9%) | 0 (0.0%) |
| 45 to 59 Minutes | 52 (15.4%) | 16 (9.3%) |
| 60 to 89 Minutes | 12 (3.6%) | 11 (6.4%) |
| 90 or more Minutes | 54 (16.0%) | 10 (5.8%) |
Time of Departure to Work by Sex in Kittitas
The most frequent times of departure to work in Kittitas are 12:00 PM to 3:59 PM (93, 27.6%) for males and 7:30 AM to 7:59 AM (53, 30.8%) for females.
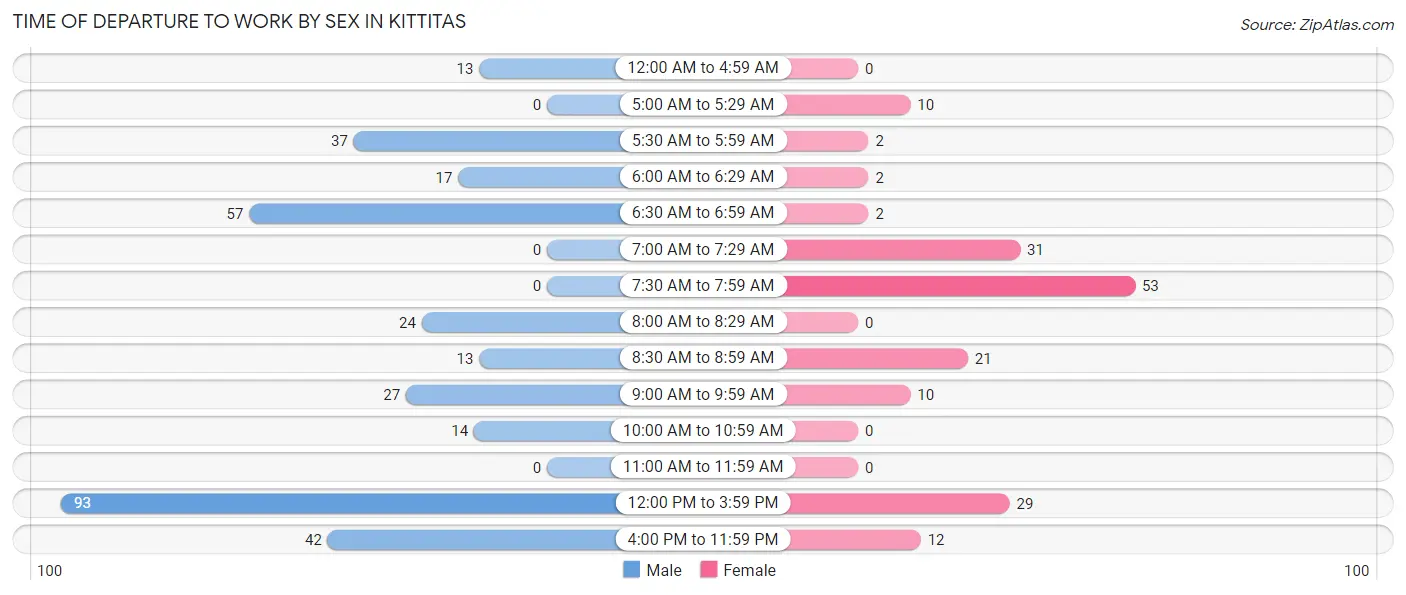
| Time of Departure | Male | Female |
| 12:00 AM to 4:59 AM | 13 (3.9%) | 0 (0.0%) |
| 5:00 AM to 5:29 AM | 0 (0.0%) | 10 (5.8%) |
| 5:30 AM to 5:59 AM | 37 (11.0%) | 2 (1.2%) |
| 6:00 AM to 6:29 AM | 17 (5.0%) | 2 (1.2%) |
| 6:30 AM to 6:59 AM | 57 (16.9%) | 2 (1.2%) |
| 7:00 AM to 7:29 AM | 0 (0.0%) | 31 (18.0%) |
| 7:30 AM to 7:59 AM | 0 (0.0%) | 53 (30.8%) |
| 8:00 AM to 8:29 AM | 24 (7.1%) | 0 (0.0%) |
| 8:30 AM to 8:59 AM | 13 (3.9%) | 21 (12.2%) |
| 9:00 AM to 9:59 AM | 27 (8.0%) | 10 (5.8%) |
| 10:00 AM to 10:59 AM | 14 (4.2%) | 0 (0.0%) |
| 11:00 AM to 11:59 AM | 0 (0.0%) | 0 (0.0%) |
| 12:00 PM to 3:59 PM | 93 (27.6%) | 29 (16.9%) |
| 4:00 PM to 11:59 PM | 42 (12.5%) | 12 (7.0%) |
| Total | 337 (100.0%) | 172 (100.0%) |
Housing Occupancy in Kittitas
Occupancy by Ownership in Kittitas
Of the total 661 dwellings in Kittitas, owner-occupied units account for 447 (67.6%), while renter-occupied units make up 214 (32.4%).
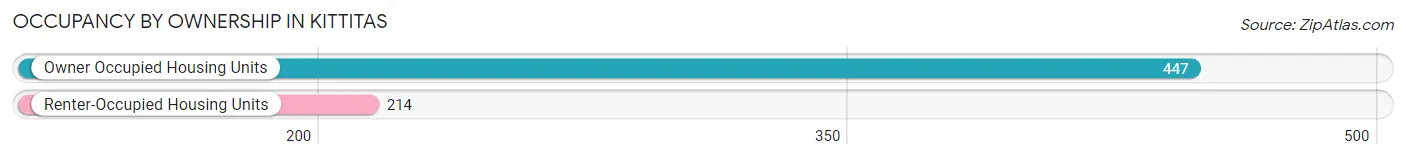
| Occupancy | # Housing Units | % Housing Units |
| Owner Occupied Housing Units | 447 | 67.6% |
| Renter-Occupied Housing Units | 214 | 32.4% |
| Total Occupied Housing Units | 661 | 100.0% |
Occupancy by Household Size in Kittitas
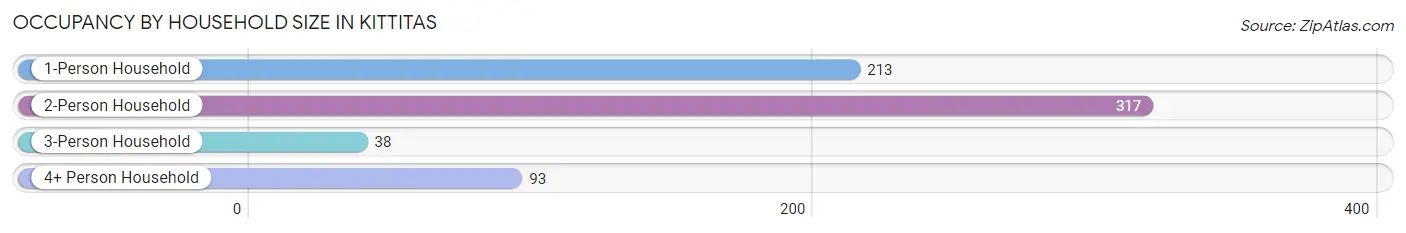
| Household Size | # Housing Units | % Housing Units |
| 1-Person Household | 213 | 32.2% |
| 2-Person Household | 317 | 48.0% |
| 3-Person Household | 38 | 5.8% |
| 4+ Person Household | 93 | 14.1% |
| Total Housing Units | 661 | 100.0% |
Occupancy by Ownership by Household Size in Kittitas
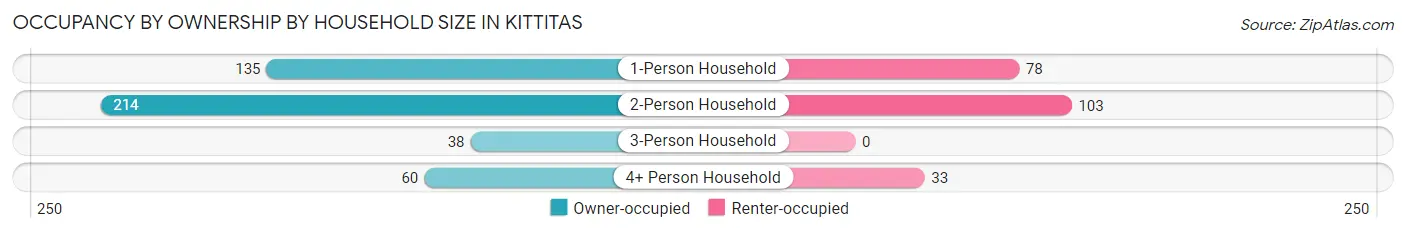
| Household Size | Owner-occupied | Renter-occupied |
| 1-Person Household | 135 (63.4%) | 78 (36.6%) |
| 2-Person Household | 214 (67.5%) | 103 (32.5%) |
| 3-Person Household | 38 (100.0%) | 0 (0.0%) |
| 4+ Person Household | 60 (64.5%) | 33 (35.5%) |
| Total Housing Units | 447 (67.6%) | 214 (32.4%) |
Occupancy by Educational Attainment in Kittitas
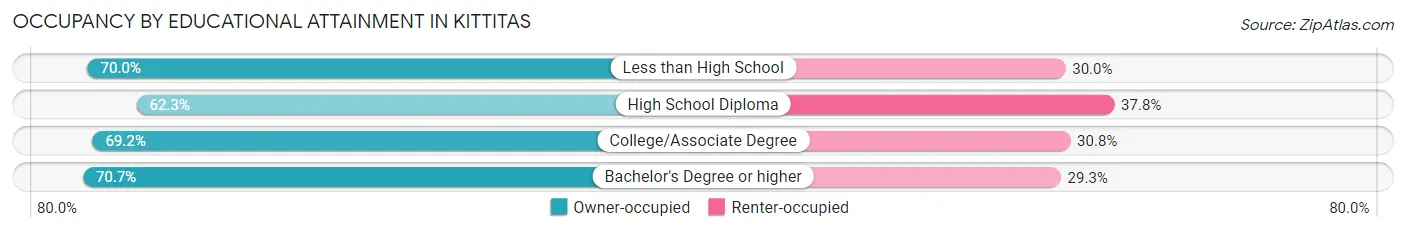
| Household Size | Owner-occupied | Renter-occupied |
| Less than High School | 70 (70.0%) | 30 (30.0%) |
| High School Diploma | 127 (62.3%) | 77 (37.8%) |
| College/Associate Degree | 117 (69.2%) | 52 (30.8%) |
| Bachelor's Degree or higher | 133 (70.7%) | 55 (29.3%) |
Occupancy by Age of Householder in Kittitas
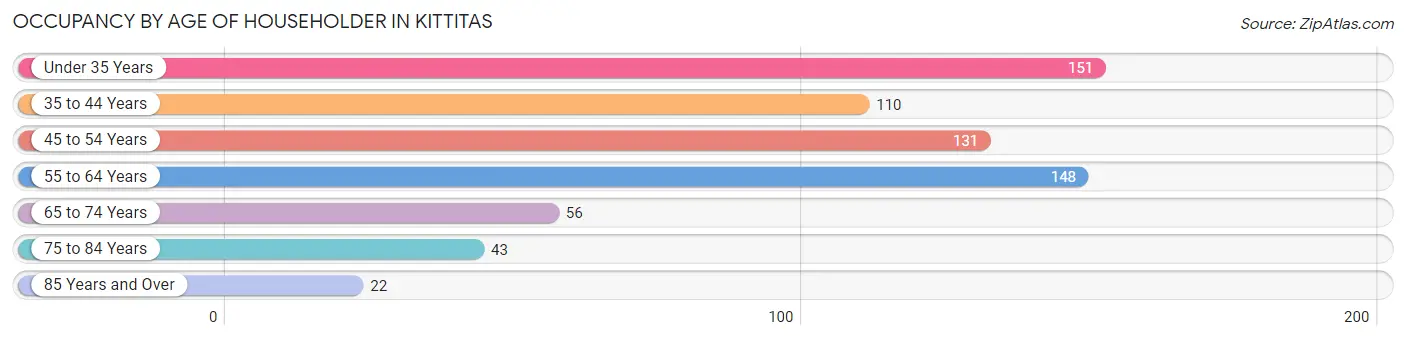
| Age Bracket | # Households | % Households |
| Under 35 Years | 151 | 22.8% |
| 35 to 44 Years | 110 | 16.6% |
| 45 to 54 Years | 131 | 19.8% |
| 55 to 64 Years | 148 | 22.4% |
| 65 to 74 Years | 56 | 8.5% |
| 75 to 84 Years | 43 | 6.5% |
| 85 Years and Over | 22 | 3.3% |
| Total | 661 | 100.0% |
Housing Finances in Kittitas
Median Income by Occupancy in Kittitas
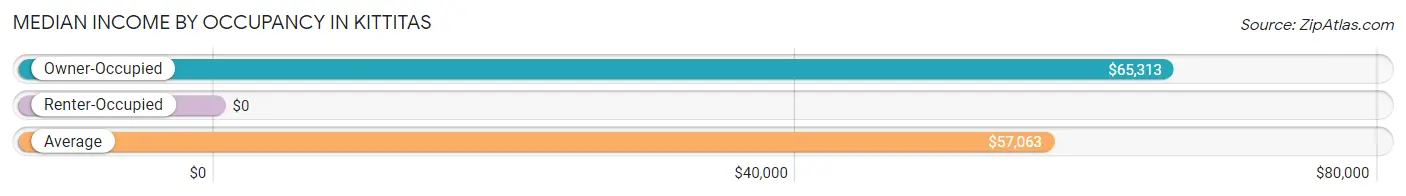
| Occupancy Type | # Households | Median Income |
| Owner-Occupied | 447 (67.6%) | $65,313 |
| Renter-Occupied | 214 (32.4%) | $0 |
| Average | 661 (100.0%) | $57,063 |
Occupancy by Householder Income Bracket in Kittitas
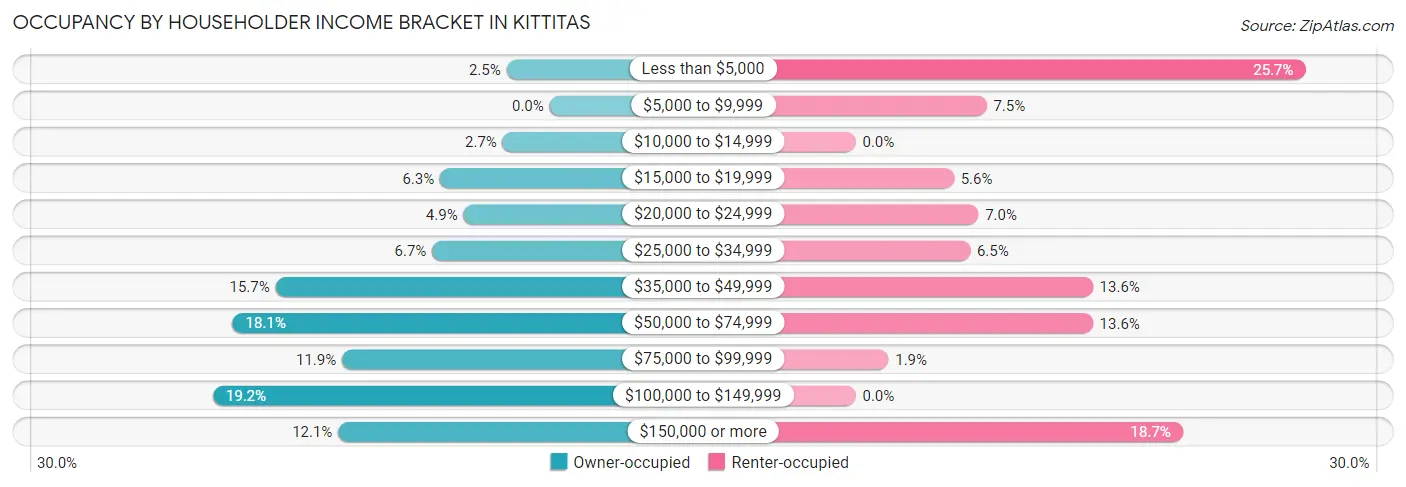
| Income Bracket | Owner-occupied | Renter-occupied |
| Less than $5,000 | 11 (2.5%) | 55 (25.7%) |
| $5,000 to $9,999 | 0 (0.0%) | 16 (7.5%) |
| $10,000 to $14,999 | 12 (2.7%) | 0 (0.0%) |
| $15,000 to $19,999 | 28 (6.3%) | 12 (5.6%) |
| $20,000 to $24,999 | 22 (4.9%) | 15 (7.0%) |
| $25,000 to $34,999 | 30 (6.7%) | 14 (6.5%) |
| $35,000 to $49,999 | 70 (15.7%) | 29 (13.6%) |
| $50,000 to $74,999 | 81 (18.1%) | 29 (13.6%) |
| $75,000 to $99,999 | 53 (11.9%) | 4 (1.9%) |
| $100,000 to $149,999 | 86 (19.2%) | 0 (0.0%) |
| $150,000 or more | 54 (12.1%) | 40 (18.7%) |
| Total | 447 (100.0%) | 214 (100.0%) |
Monthly Housing Cost Tiers in Kittitas
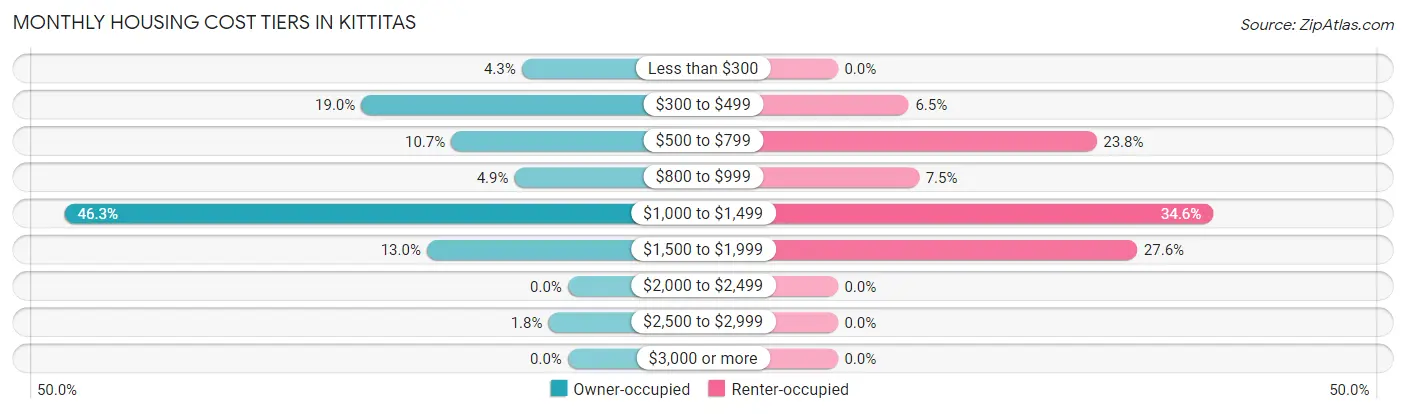
| Monthly Cost | Owner-occupied | Renter-occupied |
| Less than $300 | 19 (4.3%) | 0 (0.0%) |
| $300 to $499 | 85 (19.0%) | 14 (6.5%) |
| $500 to $799 | 48 (10.7%) | 51 (23.8%) |
| $800 to $999 | 22 (4.9%) | 16 (7.5%) |
| $1,000 to $1,499 | 207 (46.3%) | 74 (34.6%) |
| $1,500 to $1,999 | 58 (13.0%) | 59 (27.6%) |
| $2,000 to $2,499 | 0 (0.0%) | 0 (0.0%) |
| $2,500 to $2,999 | 8 (1.8%) | 0 (0.0%) |
| $3,000 or more | 0 (0.0%) | 0 (0.0%) |
| Total | 447 (100.0%) | 214 (100.0%) |
Physical Housing Characteristics in Kittitas
Housing Structures in Kittitas
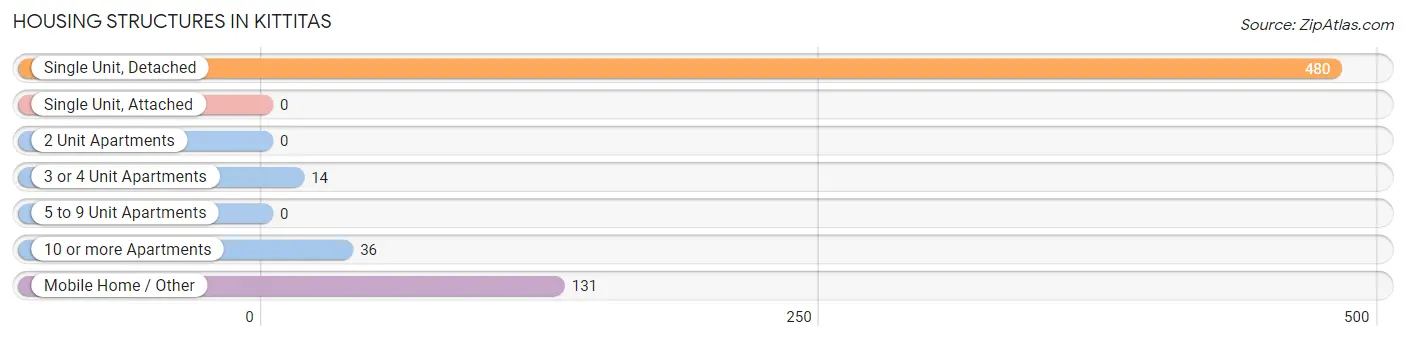
| Structure Type | # Housing Units | % Housing Units |
| Single Unit, Detached | 480 | 72.6% |
| Single Unit, Attached | 0 | 0.0% |
| 2 Unit Apartments | 0 | 0.0% |
| 3 or 4 Unit Apartments | 14 | 2.1% |
| 5 to 9 Unit Apartments | 0 | 0.0% |
| 10 or more Apartments | 36 | 5.4% |
| Mobile Home / Other | 131 | 19.8% |
| Total | 661 | 100.0% |
Housing Structures by Occupancy in Kittitas
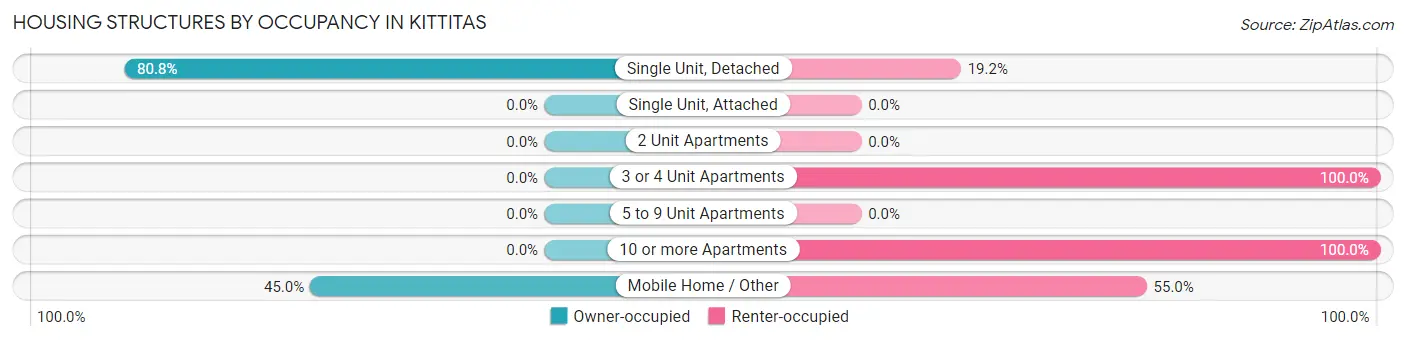
| Structure Type | Owner-occupied | Renter-occupied |
| Single Unit, Detached | 388 (80.8%) | 92 (19.2%) |
| Single Unit, Attached | 0 (0.0%) | 0 (0.0%) |
| 2 Unit Apartments | 0 (0.0%) | 0 (0.0%) |
| 3 or 4 Unit Apartments | 0 (0.0%) | 14 (100.0%) |
| 5 to 9 Unit Apartments | 0 (0.0%) | 0 (0.0%) |
| 10 or more Apartments | 0 (0.0%) | 36 (100.0%) |
| Mobile Home / Other | 59 (45.0%) | 72 (55.0%) |
| Total | 447 (67.6%) | 214 (32.4%) |
Housing Structures by Number of Rooms in Kittitas
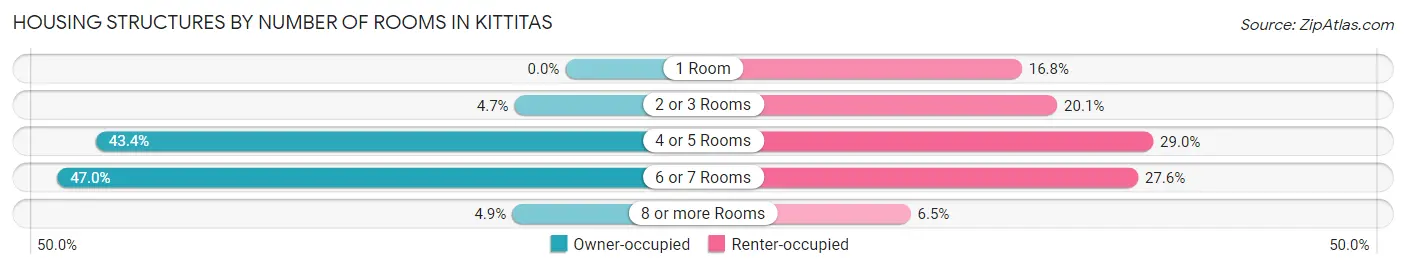
| Number of Rooms | Owner-occupied | Renter-occupied |
| 1 Room | 0 (0.0%) | 36 (16.8%) |
| 2 or 3 Rooms | 21 (4.7%) | 43 (20.1%) |
| 4 or 5 Rooms | 194 (43.4%) | 62 (29.0%) |
| 6 or 7 Rooms | 210 (47.0%) | 59 (27.6%) |
| 8 or more Rooms | 22 (4.9%) | 14 (6.5%) |
| Total | 447 (100.0%) | 214 (100.0%) |
Housing Structure by Heating Type in Kittitas
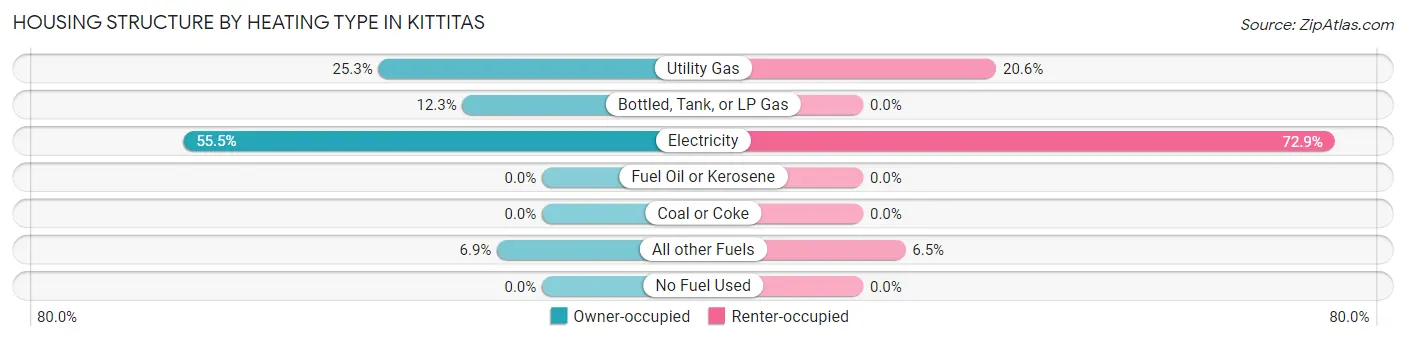
| Heating Type | Owner-occupied | Renter-occupied |
| Utility Gas | 113 (25.3%) | 44 (20.6%) |
| Bottled, Tank, or LP Gas | 55 (12.3%) | 0 (0.0%) |
| Electricity | 248 (55.5%) | 156 (72.9%) |
| Fuel Oil or Kerosene | 0 (0.0%) | 0 (0.0%) |
| Coal or Coke | 0 (0.0%) | 0 (0.0%) |
| All other Fuels | 31 (6.9%) | 14 (6.5%) |
| No Fuel Used | 0 (0.0%) | 0 (0.0%) |
| Total | 447 (100.0%) | 214 (100.0%) |
Household Vehicle Usage in Kittitas
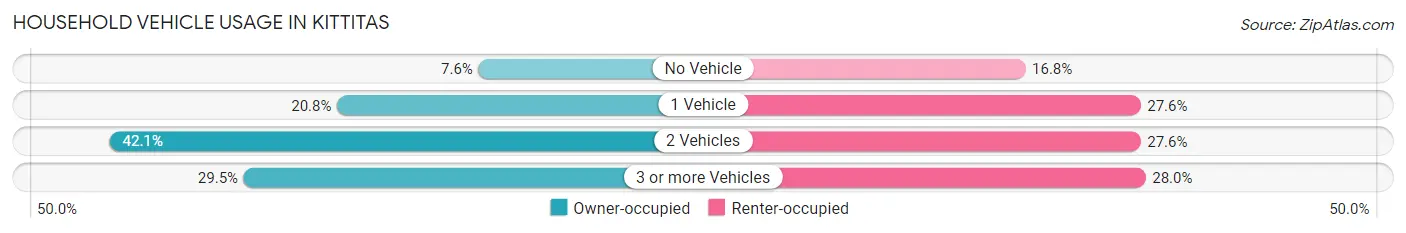
| Vehicles per Household | Owner-occupied | Renter-occupied |
| No Vehicle | 34 (7.6%) | 36 (16.8%) |
| 1 Vehicle | 93 (20.8%) | 59 (27.6%) |
| 2 Vehicles | 188 (42.1%) | 59 (27.6%) |
| 3 or more Vehicles | 132 (29.5%) | 60 (28.0%) |
| Total | 447 (100.0%) | 214 (100.0%) |
Real Estate & Mortgages in Kittitas
Real Estate and Mortgage Overview in Kittitas
| Characteristic | Without Mortgage | With Mortgage |
| Housing Units | 163 | 284 |
| Median Property Value | $253,600 | $252,500 |
| Median Household Income | $41,250 | $54 |
| Monthly Housing Costs | $466 | $0 |
| Real Estate Taxes | $1,825 | $0 |
Property Value by Mortgage Status in Kittitas
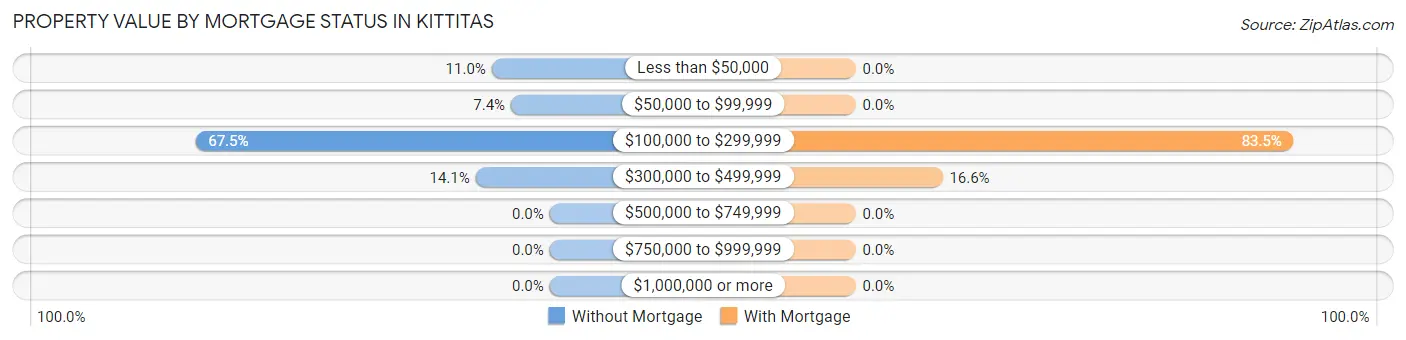
| Property Value | Without Mortgage | With Mortgage |
| Less than $50,000 | 18 (11.0%) | 0 (0.0%) |
| $50,000 to $99,999 | 12 (7.4%) | 0 (0.0%) |
| $100,000 to $299,999 | 110 (67.5%) | 237 (83.5%) |
| $300,000 to $499,999 | 23 (14.1%) | 47 (16.6%) |
| $500,000 to $749,999 | 0 (0.0%) | 0 (0.0%) |
| $750,000 to $999,999 | 0 (0.0%) | 0 (0.0%) |
| $1,000,000 or more | 0 (0.0%) | 0 (0.0%) |
| Total | 163 (100.0%) | 284 (100.0%) |
Household Income by Mortgage Status in Kittitas
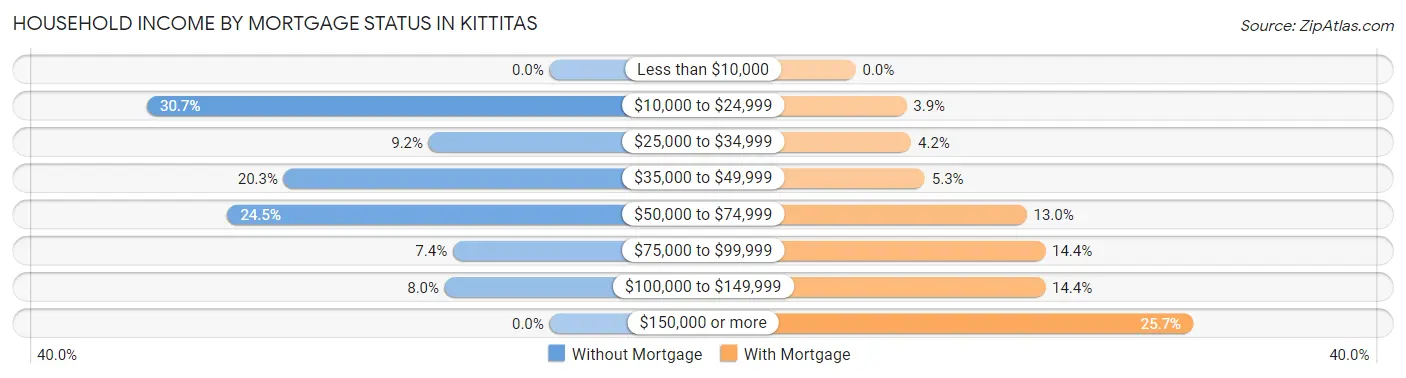
| Household Income | Without Mortgage | With Mortgage |
| Less than $10,000 | 0 (0.0%) | 0 (0.0%) |
| $10,000 to $24,999 | 50 (30.7%) | 11 (3.9%) |
| $25,000 to $34,999 | 15 (9.2%) | 12 (4.2%) |
| $35,000 to $49,999 | 33 (20.3%) | 15 (5.3%) |
| $50,000 to $74,999 | 40 (24.5%) | 37 (13.0%) |
| $75,000 to $99,999 | 12 (7.4%) | 41 (14.4%) |
| $100,000 to $149,999 | 13 (8.0%) | 41 (14.4%) |
| $150,000 or more | 0 (0.0%) | 73 (25.7%) |
| Total | 163 (100.0%) | 284 (100.0%) |
Property Value to Household Income Ratio in Kittitas
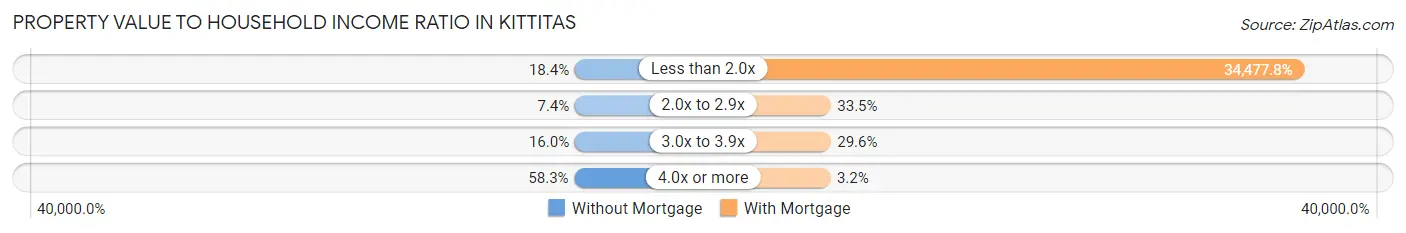
| Value-to-Income Ratio | Without Mortgage | With Mortgage |
| Less than 2.0x | 30 (18.4%) | 97,917 (34,477.8%) |
| 2.0x to 2.9x | 12 (7.4%) | 95 (33.5%) |
| 3.0x to 3.9x | 26 (16.0%) | 84 (29.6%) |
| 4.0x or more | 95 (58.3%) | 9 (3.2%) |
| Total | 163 (100.0%) | 284 (100.0%) |
Real Estate Taxes by Mortgage Status in Kittitas
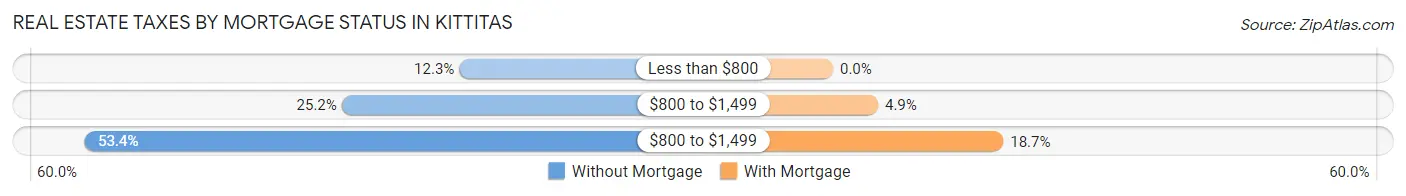
| Property Taxes | Without Mortgage | With Mortgage |
| Less than $800 | 20 (12.3%) | 0 (0.0%) |
| $800 to $1,499 | 41 (25.2%) | 14 (4.9%) |
| $800 to $1,499 | 87 (53.4%) | 53 (18.7%) |
| Total | 163 (100.0%) | 284 (100.0%) |
Health & Disability in Kittitas
Health Insurance Coverage by Age in Kittitas
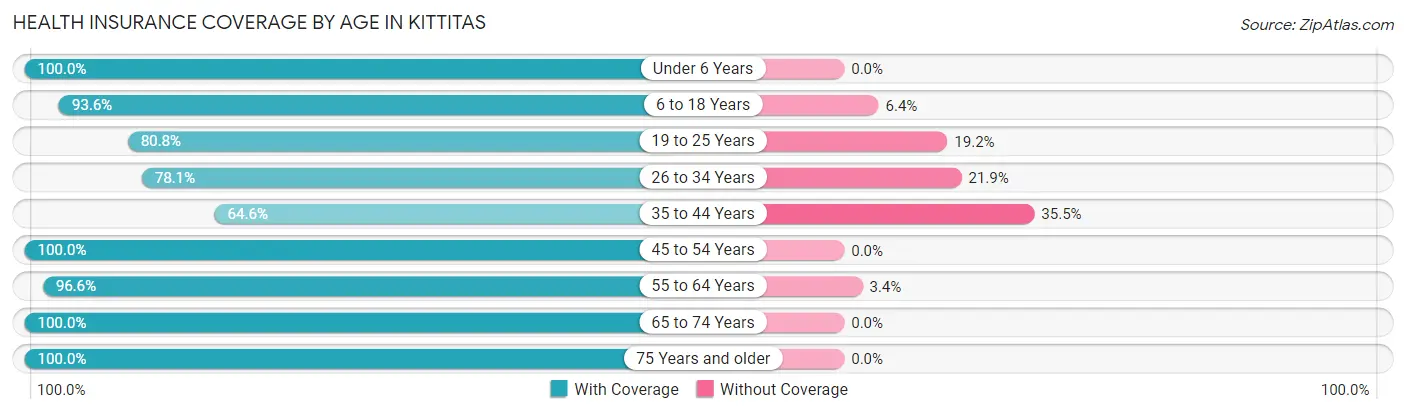
| Age Bracket | With Coverage | Without Coverage |
| Under 6 Years | 57 (100.0%) | 0 (0.0%) |
| 6 to 18 Years | 234 (93.6%) | 16 (6.4%) |
| 19 to 25 Years | 63 (80.8%) | 15 (19.2%) |
| 26 to 34 Years | 143 (78.1%) | 40 (21.9%) |
| 35 to 44 Years | 71 (64.5%) | 39 (35.4%) |
| 45 to 54 Years | 181 (100.0%) | 0 (0.0%) |
| 55 to 64 Years | 199 (96.6%) | 7 (3.4%) |
| 65 to 74 Years | 97 (100.0%) | 0 (0.0%) |
| 75 Years and older | 99 (100.0%) | 0 (0.0%) |
| Total | 1,144 (90.7%) | 117 (9.3%) |
Health Insurance Coverage by Citizenship Status in Kittitas
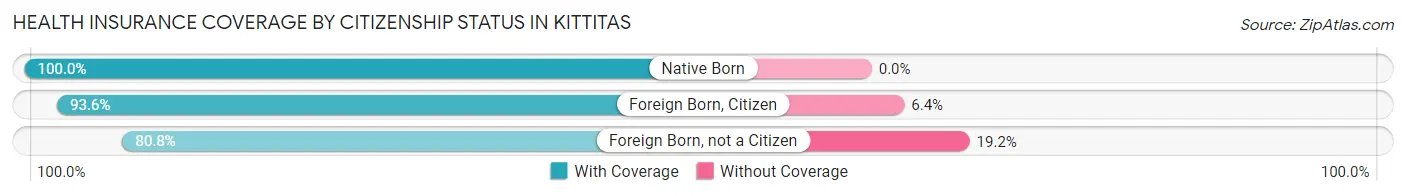
| Citizenship Status | With Coverage | Without Coverage |
| Native Born | 57 (100.0%) | 0 (0.0%) |
| Foreign Born, Citizen | 234 (93.6%) | 16 (6.4%) |
| Foreign Born, not a Citizen | 63 (80.8%) | 15 (19.2%) |
Health Insurance Coverage by Household Income in Kittitas
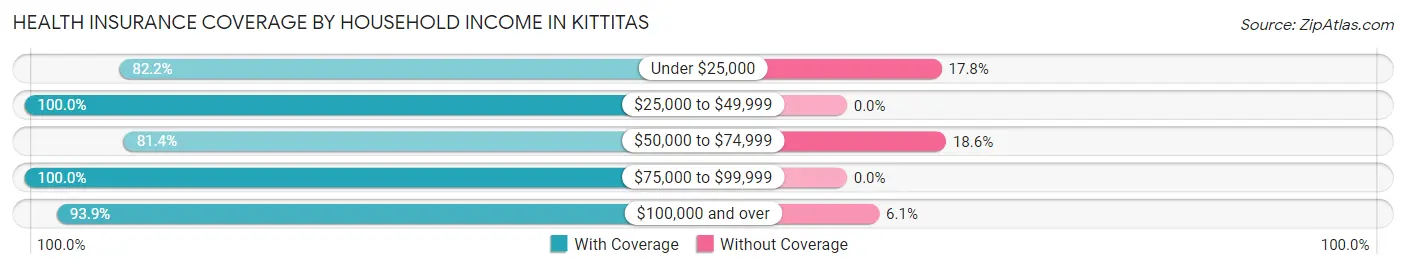
| Household Income | With Coverage | Without Coverage |
| Under $25,000 | 176 (82.2%) | 38 (17.8%) |
| $25,000 to $49,999 | 250 (100.0%) | 0 (0.0%) |
| $50,000 to $74,999 | 241 (81.4%) | 55 (18.6%) |
| $75,000 to $99,999 | 105 (100.0%) | 0 (0.0%) |
| $100,000 and over | 372 (93.9%) | 24 (6.1%) |
Public vs Private Health Insurance Coverage by Age in Kittitas
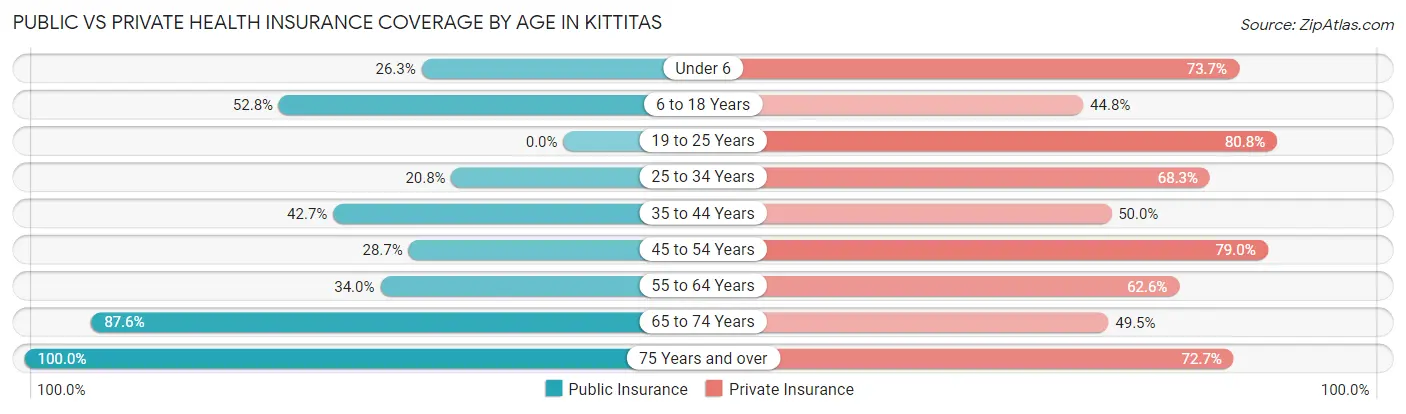
| Age Bracket | Public Insurance | Private Insurance |
| Under 6 | 15 (26.3%) | 42 (73.7%) |
| 6 to 18 Years | 132 (52.8%) | 112 (44.8%) |
| 19 to 25 Years | 0 (0.0%) | 63 (80.8%) |
| 25 to 34 Years | 38 (20.8%) | 125 (68.3%) |
| 35 to 44 Years | 47 (42.7%) | 55 (50.0%) |
| 45 to 54 Years | 52 (28.7%) | 143 (79.0%) |
| 55 to 64 Years | 70 (34.0%) | 129 (62.6%) |
| 65 to 74 Years | 85 (87.6%) | 48 (49.5%) |
| 75 Years and over | 99 (100.0%) | 72 (72.7%) |
| Total | 538 (42.7%) | 789 (62.6%) |
Disability Status by Sex by Age in Kittitas
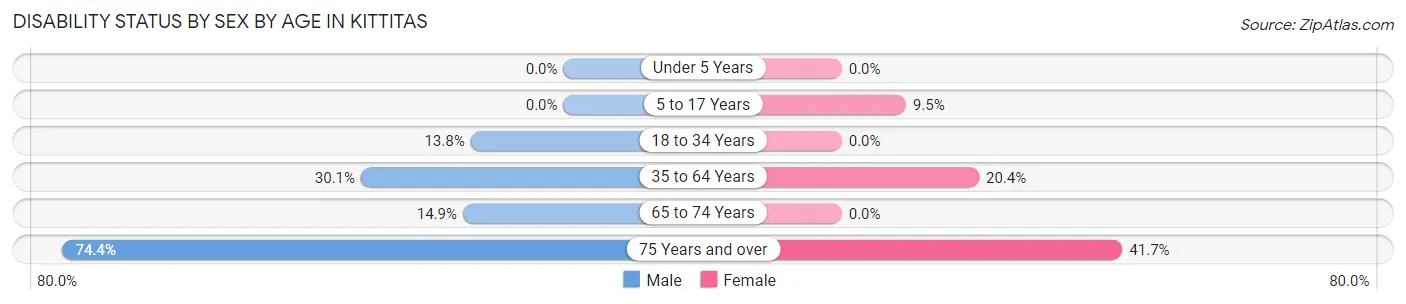
| Age Bracket | Male | Female |
| Under 5 Years | 0 (0.0%) | 0 (0.0%) |
| 5 to 17 Years | 0 (0.0%) | 10 (9.5%) |
| 18 to 34 Years | 24 (13.8%) | 0 (0.0%) |
| 35 to 64 Years | 86 (30.1%) | 43 (20.4%) |
| 65 to 74 Years | 10 (14.9%) | 0 (0.0%) |
| 75 Years and over | 29 (74.4%) | 25 (41.7%) |
Disability Class by Sex by Age in Kittitas
Disability Class: Hearing Difficulty
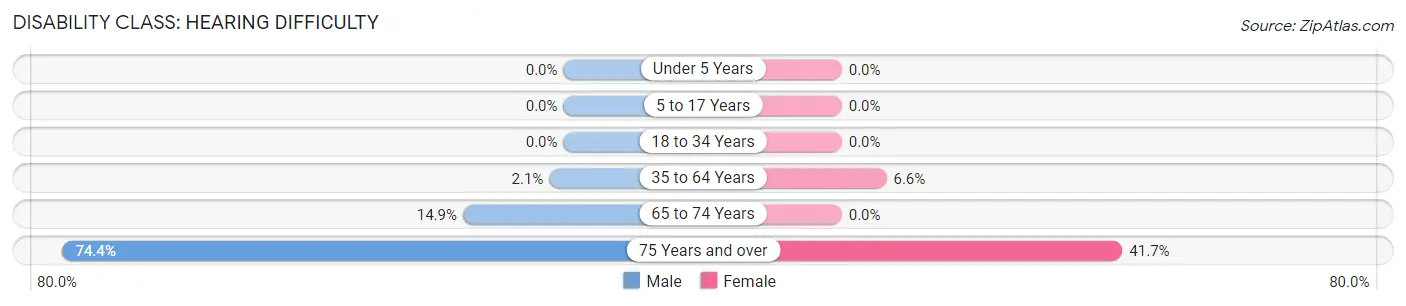
| Age Bracket | Male | Female |
| Under 5 Years | 0 (0.0%) | 0 (0.0%) |
| 5 to 17 Years | 0 (0.0%) | 0 (0.0%) |
| 18 to 34 Years | 0 (0.0%) | 0 (0.0%) |
| 35 to 64 Years | 6 (2.1%) | 14 (6.6%) |
| 65 to 74 Years | 10 (14.9%) | 0 (0.0%) |
| 75 Years and over | 29 (74.4%) | 25 (41.7%) |
Disability Class: Vision Difficulty
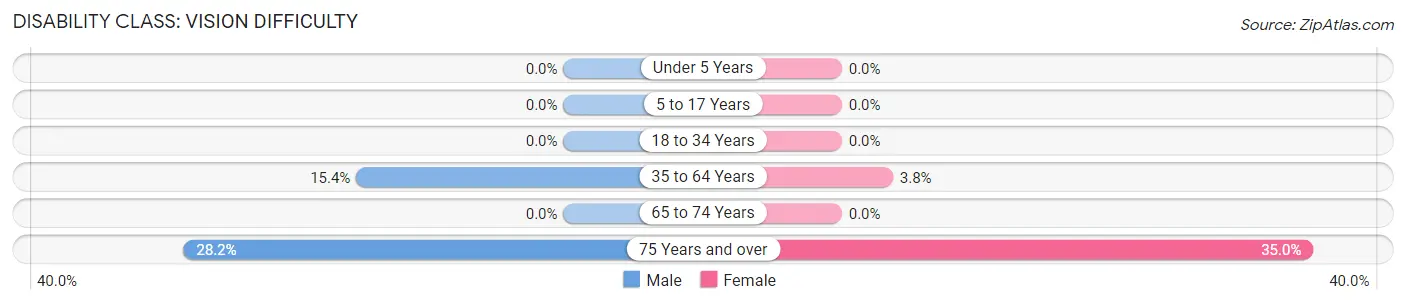
| Age Bracket | Male | Female |
| Under 5 Years | 0 (0.0%) | 0 (0.0%) |
| 5 to 17 Years | 0 (0.0%) | 0 (0.0%) |
| 18 to 34 Years | 0 (0.0%) | 0 (0.0%) |
| 35 to 64 Years | 44 (15.4%) | 8 (3.8%) |
| 65 to 74 Years | 0 (0.0%) | 0 (0.0%) |
| 75 Years and over | 11 (28.2%) | 21 (35.0%) |
Disability Class: Cognitive Difficulty
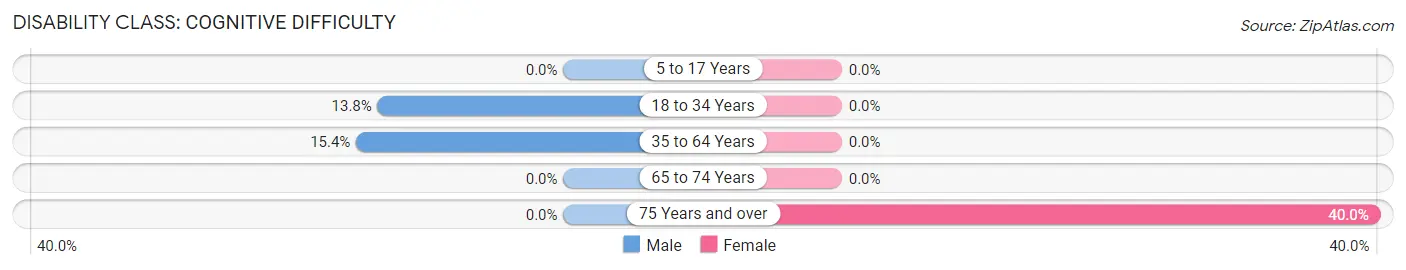
| Age Bracket | Male | Female |
| 5 to 17 Years | 0 (0.0%) | 0 (0.0%) |
| 18 to 34 Years | 24 (13.8%) | 0 (0.0%) |
| 35 to 64 Years | 44 (15.4%) | 0 (0.0%) |
| 65 to 74 Years | 0 (0.0%) | 0 (0.0%) |
| 75 Years and over | 0 (0.0%) | 24 (40.0%) |
Disability Class: Ambulatory Difficulty
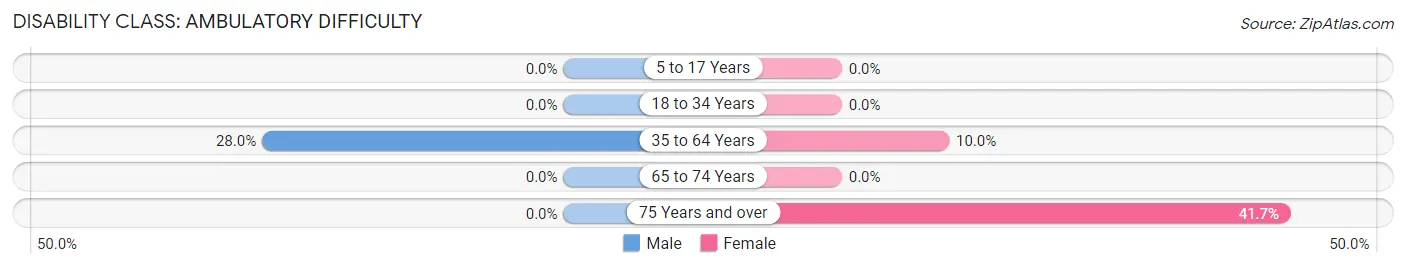
| Age Bracket | Male | Female |
| 5 to 17 Years | 0 (0.0%) | 0 (0.0%) |
| 18 to 34 Years | 0 (0.0%) | 0 (0.0%) |
| 35 to 64 Years | 80 (28.0%) | 21 (10.0%) |
| 65 to 74 Years | 0 (0.0%) | 0 (0.0%) |
| 75 Years and over | 0 (0.0%) | 25 (41.7%) |
Disability Class: Self-Care Difficulty
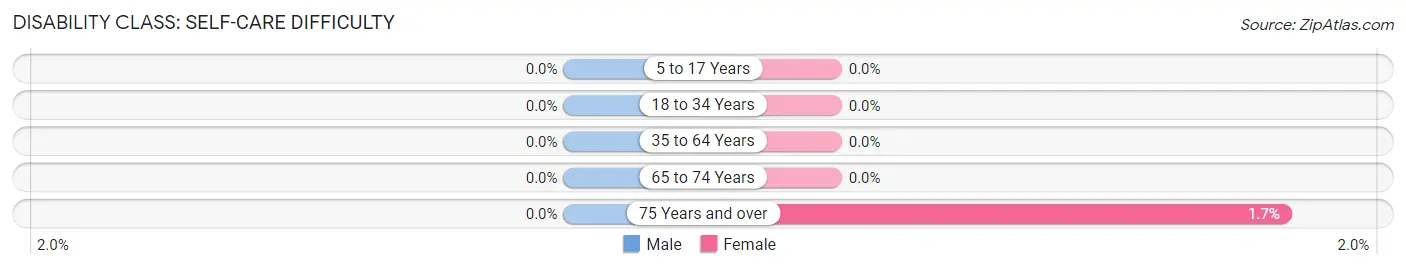
| Age Bracket | Male | Female |
| 5 to 17 Years | 0 (0.0%) | 0 (0.0%) |
| 18 to 34 Years | 0 (0.0%) | 0 (0.0%) |
| 35 to 64 Years | 0 (0.0%) | 0 (0.0%) |
| 65 to 74 Years | 0 (0.0%) | 0 (0.0%) |
| 75 Years and over | 0 (0.0%) | 1 (1.7%) |
Technology Access in Kittitas
Computing Device Access in Kittitas
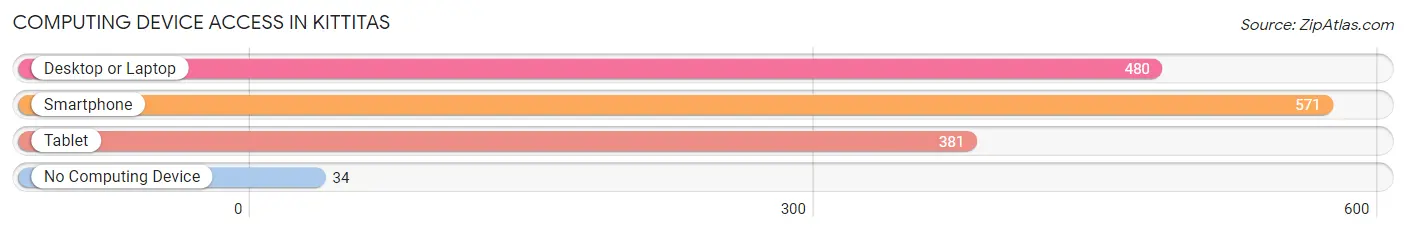
| Device Type | # Households | % Households |
| Desktop or Laptop | 480 | 72.6% |
| Smartphone | 571 | 86.4% |
| Tablet | 381 | 57.6% |
| No Computing Device | 34 | 5.1% |
| Total | 661 | 100.0% |
Internet Access in Kittitas
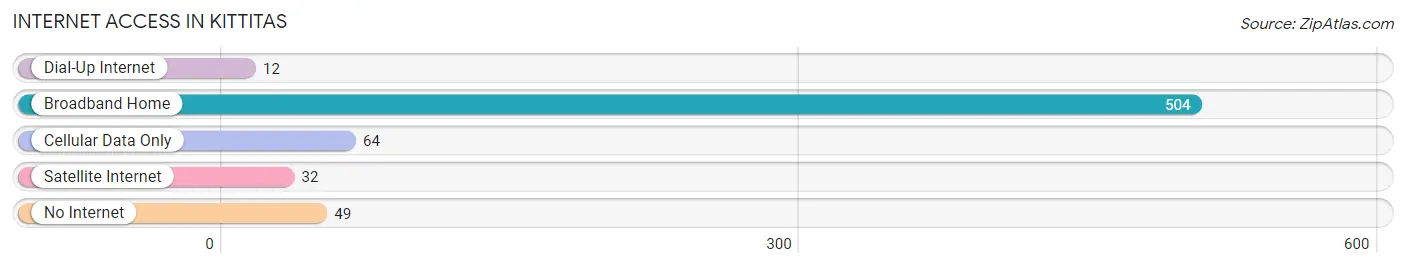
| Internet Type | # Households | % Households |
| Dial-Up Internet | 12 | 1.8% |
| Broadband Home | 504 | 76.2% |
| Cellular Data Only | 64 | 9.7% |
| Satellite Internet | 32 | 4.8% |
| No Internet | 49 | 7.4% |
| Total | 661 | 100.0% |
Kittitas Summary
Kittitas is a county located in the central part of Washington State, in the United States. It is bordered by Chelan County to the north, Yakima County to the south, and Grant County to the east. The county seat is Ellensburg, and the county is named after the Kittitas people, a Native American tribe that lived in the area.
History
The area that is now Kittitas County was originally inhabited by the Kittitas people, a Native American tribe that lived in the area for thousands of years. The first European settlers arrived in the area in the mid-1800s, and the county was officially established in 1883.
The county was originally a farming and ranching area, and the economy was largely based on agriculture. In the early 1900s, the county began to develop its mining industry, and by the 1950s, the county was home to several coal mines. The county also developed its timber industry, and by the 1970s, the county was home to several sawmills.
In the late 20th century, the county began to diversify its economy, and today, the county is home to a variety of industries, including agriculture, manufacturing, tourism, and technology.
Geography
Kittitas County is located in the central part of Washington State, and covers an area of 2,333 square miles. The county is bordered by Chelan County to the north, Yakima County to the south, and Grant County to the east. The county is located in the Cascade Mountains, and is home to several mountain ranges, including the Cascade Range, the Wenatchee Mountains, and the Okanogan Range.
The county is home to several rivers, including the Yakima River, the Naches River, and the Cle Elum River. The county is also home to several lakes, including Lake Cle Elum, Lake Kachess, and Lake Easton.
Economy
Kittitas County has a diverse economy, and is home to a variety of industries, including agriculture, manufacturing, tourism, and technology.
Agriculture is a major part of the county’s economy, and the county is home to several farms and ranches. The county is also home to several wineries, and is a major producer of apples, cherries, and other fruits and vegetables.
Manufacturing is also an important part of the county’s economy, and the county is home to several factories and plants. The county is also home to several technology companies, and is a major hub for the technology industry in the region.
Tourism is also an important part of the county’s economy, and the county is home to several popular tourist attractions, including the Kittitas County Historical Museum, the Kittitas County Fairgrounds, and the Ellensburg Rodeo.
Demographics
As of the 2010 census, the population of Kittitas County was 40,915. The population is predominantly white (90.2%), and the county is home to a variety of ethnic and racial groups, including Hispanic or Latino (7.2%), Asian (2.2%), and African American (1.2%).
The median household income in the county is $50,945, and the median family income is $60,945. The county’s poverty rate is 11.2%, and the unemployment rate is 6.2%.
Conclusion
Kittitas County is a county located in the central part of Washington State, in the United States. The county is bordered by Chelan County to the north, Yakima County to the south, and Grant County to the east. The county is home to a variety of industries, including agriculture, manufacturing, tourism, and technology. The population of the county is predominantly white, and the median household income is $50,945. The county is home to a variety of attractions, and is a major hub for the technology industry in the region.
Common Questions
What is Per Capita Income in Kittitas?
Per Capita income in Kittitas is $35,742.
What is the Median Family Income in Kittitas?
Median Family Income in Kittitas is $64,750.
What is the Median Household income in Kittitas?
Median Household Income in Kittitas is $57,063.
What is Income or Wage Gap in Kittitas?
Income or Wage Gap in Kittitas is 51.5%.
Women in Kittitas earn 48.5 cents for every dollar earned by a man.
What is Inequality or Gini Index in Kittitas?
Inequality or Gini Index in Kittitas is 0.48.
What is the Total Population of Kittitas?
Total Population of Kittitas is 1,281.
What is the Total Male Population of Kittitas?
Total Male Population of Kittitas is 742.
What is the Total Female Population of Kittitas?
Total Female Population of Kittitas is 539.
What is the Ratio of Males per 100 Females in Kittitas?
There are 137.66 Males per 100 Females in Kittitas.
What is the Ratio of Females per 100 Males in Kittitas?
There are 72.64 Females per 100 Males in Kittitas.
What is the Median Population Age in Kittitas?
Median Population Age in Kittitas is 40.8 Years.
What is the Average Family Size in Kittitas
Average Family Size in Kittitas is 2.5 People.
What is the Average Household Size in Kittitas
Average Household Size in Kittitas is 1.9 People.
How Large is the Labor Force in Kittitas?
There are 630 People in the Labor Forcein in Kittitas.
What is the Percentage of People in the Labor Force in Kittitas?
60.2% of People are in the Labor Force in Kittitas.
What is the Unemployment Rate in Kittitas?
Unemployment Rate in Kittitas is 3.9%.