Cities with the Highest Percentage of Indian (Asian) Population in Kentucky
RELATED REPORTS & OPTIONS
Indian (Asian)
Kentucky
Compare Cities
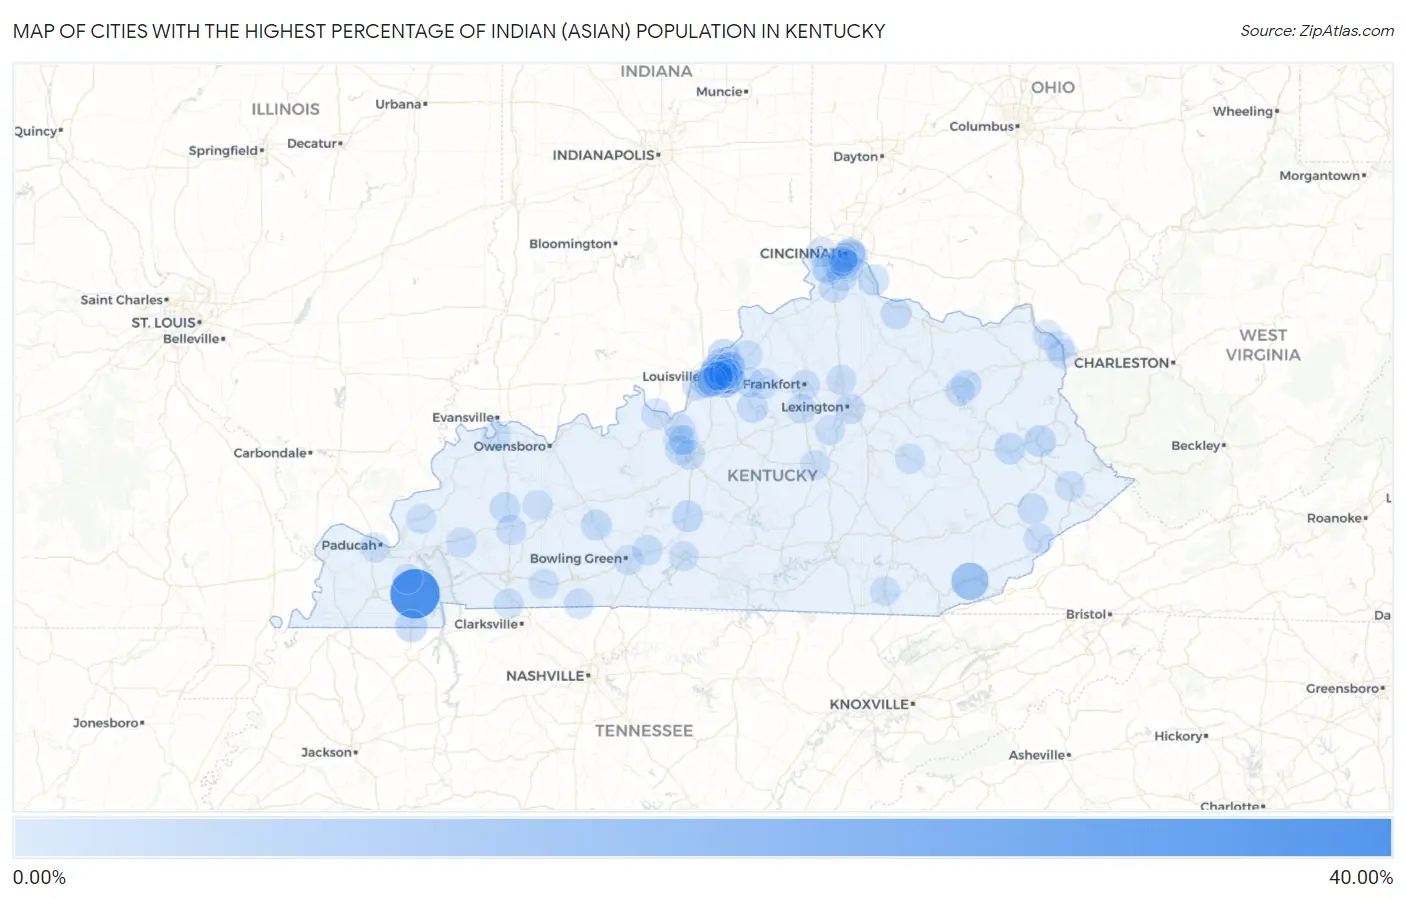
Map of Cities with the Highest Percentage of Indian (Asian) Population in Kentucky
0.00%
40.00%
Cities with the Highest Percentage of Indian (Asian) Population in Kentucky
| City | Indian (Asian) | vs State | vs National | |
| 1. | Dexter | 37.37% | 0.31%(+37.1)#1 | 1.61%(+35.8)#21 |
| 2. | Wallins Creek | 13.52% | 0.31%(+13.2)#2 | 1.61%(+11.9)#176 |
| 3. | Langdon Place | 10.50% | 0.31%(+10.2)#3 | 1.61%(+8.89)#273 |
| 4. | Beechwood Village | 10.14% | 0.31%(+9.83)#4 | 1.61%(+8.53)#293 |
| 5. | Meadow Vale | 4.56% | 0.31%(+4.25)#5 | 1.61%(+2.95)#849 |
| 6. | Ten Broeck | 4.11% | 0.31%(+3.80)#6 | 1.61%(+2.50)#934 |
| 7. | Hazel | 4.02% | 0.31%(+3.71)#7 | 1.61%(+2.41)#957 |
| 8. | Goshen | 3.95% | 0.31%(+3.64)#8 | 1.61%(+2.34)#978 |
| 9. | Paintsville | 3.30% | 0.31%(+2.99)#9 | 1.61%(+1.69)#1,181 |
| 10. | Munfordville | 2.81% | 0.31%(+2.50)#10 | 1.61%(+1.20)#1,378 |
| 11. | Salyersville | 2.55% | 0.31%(+2.24)#11 | 1.61%(+0.944)#1,536 |
| 12. | Hickory Hill | 2.52% | 0.31%(+2.21)#12 | 1.61%(+0.912)#1,563 |
| 13. | Woodlawn | 2.23% | 0.31%(+1.93)#13 | 1.61%(+0.626)#1,766 |
| 14. | Morgantown | 2.12% | 0.31%(+1.81)#14 | 1.61%(+0.513)#1,859 |
| 15. | Taylorsville | 2.04% | 0.31%(+1.73)#15 | 1.61%(+0.428)#1,906 |
| 16. | California | 1.92% | 0.31%(+1.61)#16 | 1.61%(+0.314)#2,027 |
| 17. | Brooksville | 1.83% | 0.31%(+1.52)#17 | 1.61%(+0.224)#2,116 |
| 18. | Bancroft | 1.80% | 0.31%(+1.49)#18 | 1.61%(+0.195)#2,148 |
| 19. | Middletown | 1.74% | 0.31%(+1.43)#19 | 1.61%(+0.132)#2,220 |
| 20. | Bellewood | 1.70% | 0.31%(+1.39)#20 | 1.61%(+0.093)#2,278 |
| 21. | Pippa Passes | 1.47% | 0.31%(+1.16)#21 | 1.61%(-0.135)#2,578 |
| 22. | Prospect | 1.43% | 0.31%(+1.12)#22 | 1.61%(-0.181)#2,654 |
| 23. | Graymoor Devondale | 1.37% | 0.31%(+1.06)#23 | 1.61%(-0.238)#2,747 |
| 24. | Madisonville | 1.36% | 0.31%(+1.05)#24 | 1.61%(-0.245)#2,758 |
| 25. | Lexington | 1.26% | 0.31%(+0.954)#25 | 1.61%(-0.346)#2,909 |
| 26. | Druid Hills | 1.26% | 0.31%(+0.953)#26 | 1.61%(-0.347)#2,911 |
| 27. | Walton | 1.26% | 0.31%(+0.948)#27 | 1.61%(-0.352)#2,931 |
| 28. | Windy Hills | 1.23% | 0.31%(+0.922)#28 | 1.61%(-0.378)#2,982 |
| 29. | Indian Hills | 1.18% | 0.31%(+0.867)#29 | 1.61%(-0.433)#3,090 |
| 30. | Brandenburg | 1.10% | 0.31%(+0.796)#30 | 1.61%(-0.504)#3,244 |
| 31. | Shelbyville | 1.10% | 0.31%(+0.793)#31 | 1.61%(-0.507)#3,252 |
| 32. | Forest Hills | 0.91% | 0.31%(+0.600)#32 | 1.61%(-0.700)#3,775 |
| 33. | Oakland | 0.90% | 0.31%(+0.588)#33 | 1.61%(-0.712)#3,813 |
| 34. | Murray Hill | 0.85% | 0.31%(+0.546)#34 | 1.61%(-0.754)#3,948 |
| 35. | Parkway Village | 0.80% | 0.31%(+0.495)#35 | 1.61%(-0.805)#4,118 |
| 36. | Adairville | 0.80% | 0.31%(+0.494)#36 | 1.61%(-0.806)#4,120 |
| 37. | Nortonville | 0.79% | 0.31%(+0.485)#37 | 1.61%(-0.815)#4,145 |
| 38. | Jeffersontown | 0.78% | 0.31%(+0.476)#38 | 1.61%(-0.824)#4,174 |
| 39. | St Regis Park | 0.78% | 0.31%(+0.469)#39 | 1.61%(-0.831)#4,197 |
| 40. | Coldstream | 0.73% | 0.31%(+0.419)#40 | 1.61%(-0.881)#4,363 |
| 41. | Shively | 0.72% | 0.31%(+0.416)#41 | 1.61%(-0.884)#4,375 |
| 42. | Morehead | 0.71% | 0.31%(+0.405)#42 | 1.61%(-0.895)#4,411 |
| 43. | Rolling Hills | 0.70% | 0.31%(+0.391)#43 | 1.61%(-0.909)#4,460 |
| 44. | Vine Grove | 0.68% | 0.31%(+0.372)#44 | 1.61%(-0.928)#4,525 |
| 45. | Plantation | 0.67% | 0.31%(+0.365)#45 | 1.61%(-0.935)#4,554 |
| 46. | Hurstbourne | 0.67% | 0.31%(+0.357)#46 | 1.61%(-0.943)#4,588 |
| 47. | Elkton | 0.67% | 0.31%(+0.357)#47 | 1.61%(-0.943)#4,592 |
| 48. | St Matthews | 0.65% | 0.31%(+0.337)#48 | 1.61%(-0.963)#4,678 |
| 49. | Fort Campbell North | 0.61% | 0.31%(+0.299)#49 | 1.61%(-1.00)#4,824 |
| 50. | Whitesburg | 0.60% | 0.31%(+0.295)#50 | 1.61%(-1.00)#4,844 |
| 51. | Strathmoor Village | 0.57% | 0.31%(+0.263)#51 | 1.61%(-1.04)#5,005 |
| 52. | Fort Thomas | 0.57% | 0.31%(+0.257)#52 | 1.61%(-1.04)#5,038 |
| 53. | Lakeside Park | 0.57% | 0.31%(+0.257)#53 | 1.61%(-1.04)#5,044 |
| 54. | Princeton | 0.56% | 0.31%(+0.251)#54 | 1.61%(-1.05)#5,071 |
| 55. | Glenview | 0.52% | 0.31%(+0.214)#55 | 1.61%(-1.09)#5,265 |
| 56. | Bremen | 0.52% | 0.31%(+0.213)#56 | 1.61%(-1.09)#5,268 |
| 57. | Fort Knox | 0.52% | 0.31%(+0.211)#57 | 1.61%(-1.09)#5,275 |
| 58. | Norwood | 0.51% | 0.31%(+0.205)#58 | 1.61%(-1.09)#5,301 |
| 59. | Taylor Mill | 0.50% | 0.31%(+0.188)#59 | 1.61%(-1.11)#5,380 |
| 60. | Barbourmeade | 0.49% | 0.31%(+0.186)#60 | 1.61%(-1.11)#5,387 |
| 61. | Pikeville | 0.49% | 0.31%(+0.180)#61 | 1.61%(-1.12)#5,422 |
| 62. | Woodland Hills | 0.48% | 0.31%(+0.174)#62 | 1.61%(-1.13)#5,454 |
| 63. | Danville | 0.48% | 0.31%(+0.168)#63 | 1.61%(-1.13)#5,488 |
| 64. | Independence | 0.47% | 0.31%(+0.158)#64 | 1.61%(-1.14)#5,540 |
| 65. | Ashland | 0.46% | 0.31%(+0.155)#65 | 1.61%(-1.14)#5,551 |
| 66. | Ravenna | 0.46% | 0.31%(+0.153)#66 | 1.61%(-1.15)#5,565 |
| 67. | Glasgow | 0.46% | 0.31%(+0.150)#67 | 1.61%(-1.15)#5,576 |
| 68. | Bellevue | 0.45% | 0.31%(+0.138)#68 | 1.61%(-1.16)#5,645 |
| 69. | Bowling Green | 0.45% | 0.31%(+0.137)#69 | 1.61%(-1.16)#5,647 |
| 70. | Florence | 0.45% | 0.31%(+0.137)#70 | 1.61%(-1.16)#5,648 |
| 71. | Rineyville | 0.43% | 0.31%(+0.124)#71 | 1.61%(-1.18)#5,737 |
| 72. | Wilmore | 0.43% | 0.31%(+0.123)#72 | 1.61%(-1.18)#5,741 |
| 73. | Orchard Grass Hills | 0.41% | 0.31%(+0.104)#73 | 1.61%(-1.20)#5,855 |
| 74. | Strathmoor Manor | 0.41% | 0.31%(+0.103)#74 | 1.61%(-1.20)#5,860 |
| 75. | Erlanger | 0.41% | 0.31%(+0.100)#75 | 1.61%(-1.20)#5,878 |
| 76. | Raceland | 0.40% | 0.31%(+0.088)#76 | 1.61%(-1.21)#5,947 |
| 77. | Catlettsburg | 0.39% | 0.31%(+0.084)#77 | 1.61%(-1.22)#5,972 |
| 78. | Louisville | 0.39% | 0.31%(+0.078)#78 | 1.61%(-1.22)#6,017 |
| 79. | Woodlawn Park | 0.39% | 0.31%(+0.078)#79 | 1.61%(-1.22)#6,019 |
| 80. | Oakbrook | 0.38% | 0.31%(+0.070)#80 | 1.61%(-1.23)#6,076 |
| 81. | Francisville | 0.37% | 0.31%(+0.060)#81 | 1.61%(-1.24)#6,133 |
| 82. | Williamsburg | 0.36% | 0.31%(+0.055)#82 | 1.61%(-1.25)#6,164 |
| 83. | Henderson | 0.36% | 0.31%(+0.053)#83 | 1.61%(-1.25)#6,172 |
| 84. | Covington | 0.36% | 0.31%(+0.048)#84 | 1.61%(-1.25)#6,202 |
| 85. | Park Hills | 0.35% | 0.31%(+0.039)#85 | 1.61%(-1.26)#6,255 |
| 86. | Salem | 0.34% | 0.31%(+0.033)#86 | 1.61%(-1.27)#6,293 |
| 87. | Simpsonville | 0.34% | 0.31%(+0.027)#87 | 1.61%(-1.27)#6,332 |
| 88. | Anchorage | 0.33% | 0.31%(+0.022)#88 | 1.61%(-1.28)#6,365 |
| 89. | Elizabethtown | 0.33% | 0.31%(+0.019)#89 | 1.61%(-1.28)#6,390 |
| 90. | Paducah | 0.31% | 0.31%(+0.000)#90 | 1.61%(-1.30)#6,509 |
| 91. | Georgetown | 0.30% | 0.31%(-0.010)#91 | 1.61%(-1.31)#6,577 |
| 92. | Fort Wright | 0.29% | 0.31%(-0.018)#92 | 1.61%(-1.32)#6,618 |
| 93. | Lyndon | 0.29% | 0.31%(-0.018)#93 | 1.61%(-1.32)#6,619 |
| 94. | Lakeview Heights | 0.28% | 0.31%(-0.028)#94 | 1.61%(-1.33)#6,678 |
| 95. | Richlawn | 0.28% | 0.31%(-0.032)#95 | 1.61%(-1.33)#6,710 |
| 96. | Frankfort | 0.27% | 0.31%(-0.035)#96 | 1.61%(-1.33)#6,731 |
| 97. | Benton | 0.27% | 0.31%(-0.035)#97 | 1.61%(-1.34)#6,737 |
| 98. | Radcliff | 0.25% | 0.31%(-0.056)#98 | 1.61%(-1.36)#6,870 |
| 99. | Lawrenceburg | 0.24% | 0.31%(-0.070)#99 | 1.61%(-1.37)#6,987 |
| 100. | La Grange | 0.22% | 0.31%(-0.090)#100 | 1.61%(-1.39)#7,133 |
Common Questions
What are the Top 10 Cities with the Highest Percentage of Indian (Asian) Population in Kentucky?
Top 10 Cities with the Highest Percentage of Indian (Asian) Population in Kentucky are:
#1
37.37%
#2
13.52%
#3
10.50%
#4
10.14%
#5
4.56%
#6
4.11%
#7
4.02%
#8
3.95%
#9
3.30%
#10
2.81%
What city has the Highest Percentage of Indian (Asian) Population in Kentucky?
Dexter has the Highest Percentage of Indian (Asian) Population in Kentucky with 37.37%.
What is the Percentage of Indian (Asian) Population in the State of Kentucky?
Percentage of Indian (Asian) Population in Kentucky is 0.31%.
What is the Percentage of Indian (Asian) Population in the United States?
Percentage of Indian (Asian) Population in the United States is 1.61%.