Cities with the Highest Percentage of Indian (Asian) Population in Pennsylvania
RELATED REPORTS & OPTIONS
Indian (Asian)
Pennsylvania
Compare Cities
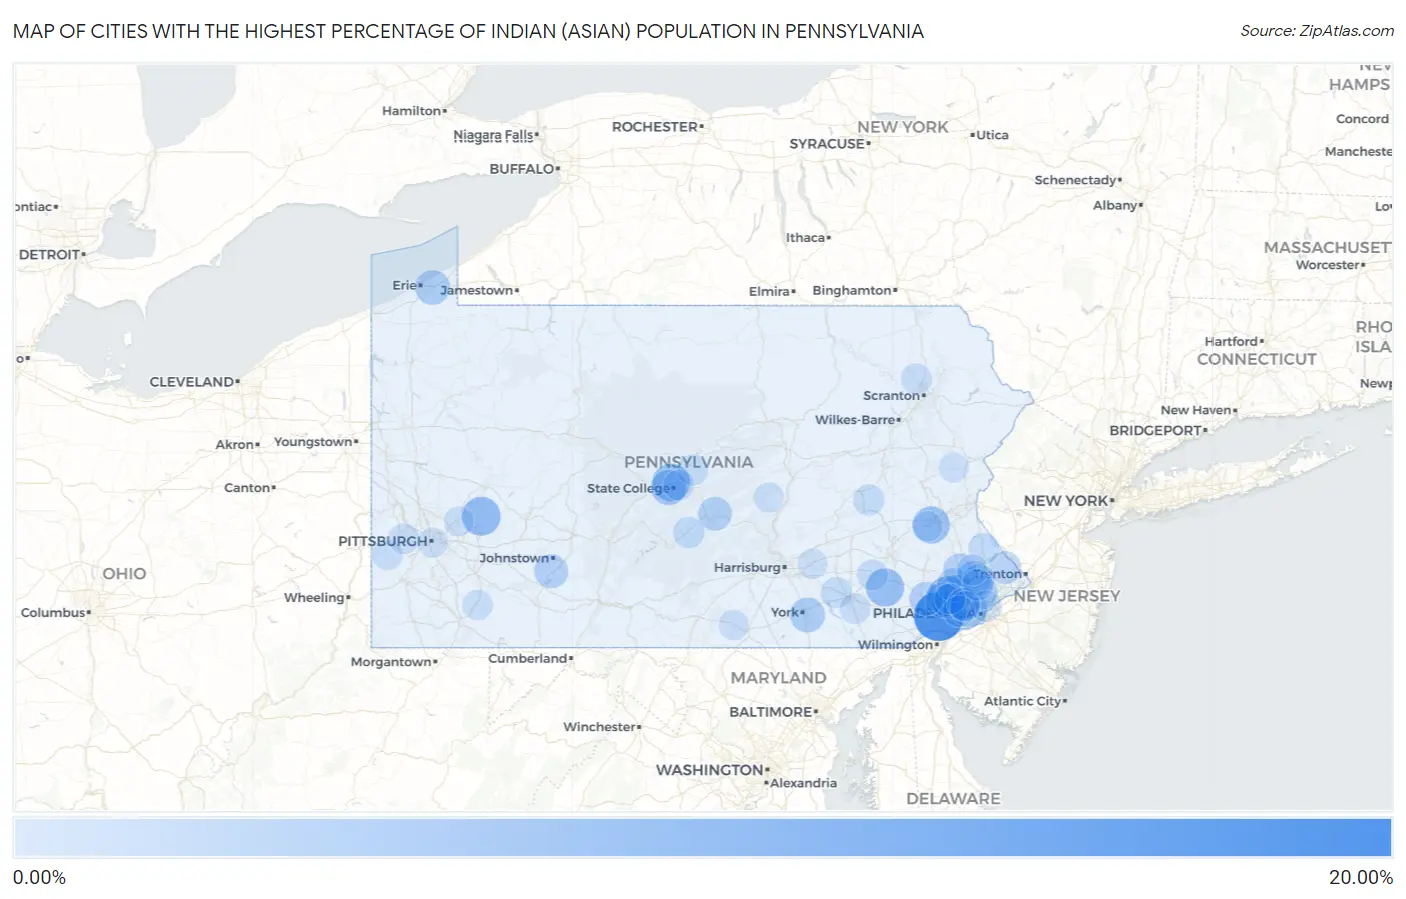
Map of Cities with the Highest Percentage of Indian (Asian) Population in Pennsylvania
0.00%
20.00%
Cities with the Highest Percentage of Indian (Asian) Population in Pennsylvania
| City | Indian (Asian) | vs State | vs National | |
| 1. | Cheyney University | 18.42% | 1.03%(+17.4)#1 | 1.61%(+16.8)#91 |
| 2. | Morgan Hill | 17.94% | 1.03%(+16.9)#2 | 1.61%(+16.3)#98 |
| 3. | Chesterbrook | 10.17% | 1.03%(+9.14)#3 | 1.61%(+8.56)#292 |
| 4. | Ashley Borough | 9.92% | 1.03%(+8.88)#4 | 1.61%(+8.31)#309 |
| 5. | North Vandergrift | 9.09% | 1.03%(+8.06)#5 | 1.61%(+7.48)#348 |
| 6. | Goodville | 8.54% | 1.03%(+7.51)#6 | 1.61%(+6.93)#383 |
| 7. | Toftrees | 8.31% | 1.03%(+7.28)#7 | 1.61%(+6.70)#392 |
| 8. | St. Davids | 8.08% | 1.03%(+7.05)#8 | 1.61%(+6.47)#407 |
| 9. | Millbourne Borough | 7.93% | 1.03%(+6.90)#9 | 1.61%(+6.32)#418 |
| 10. | Trexlertown | 7.80% | 1.03%(+6.77)#10 | 1.61%(+6.19)#423 |
| 11. | Rosemont | 7.64% | 1.03%(+6.61)#11 | 1.61%(+6.03)#436 |
| 12. | Penn Wynne | 7.34% | 1.03%(+6.31)#12 | 1.61%(+5.74)#453 |
| 13. | Yorkana Borough | 7.24% | 1.03%(+6.21)#13 | 1.61%(+5.63)#464 |
| 14. | Rutledge Borough | 6.84% | 1.03%(+5.81)#14 | 1.61%(+5.23)#496 |
| 15. | Aspinwall Borough | 6.71% | 1.03%(+5.68)#15 | 1.61%(+5.10)#505 |
| 16. | Park Forest Village | 6.38% | 1.03%(+5.35)#16 | 1.61%(+4.77)#546 |
| 17. | Spring House | 6.10% | 1.03%(+5.06)#17 | 1.61%(+4.49)#580 |
| 18. | Penn State Erie Behrend | 5.90% | 1.03%(+4.87)#18 | 1.61%(+4.29)#605 |
| 19. | Queens Gate | 5.89% | 1.03%(+4.86)#19 | 1.61%(+4.28)#607 |
| 20. | King Of Prussia | 5.83% | 1.03%(+4.80)#20 | 1.61%(+4.23)#619 |
| 21. | Arcadia University | 5.80% | 1.03%(+4.77)#21 | 1.61%(+4.19)#624 |
| 22. | Paoli | 5.80% | 1.03%(+4.77)#22 | 1.61%(+4.19)#625 |
| 23. | Berwyn | 5.70% | 1.03%(+4.67)#23 | 1.61%(+4.09)#637 |
| 24. | State College Borough | 5.58% | 1.03%(+4.55)#24 | 1.61%(+3.97)#648 |
| 25. | Morton Borough | 5.29% | 1.03%(+4.26)#25 | 1.61%(+3.68)#695 |
| 26. | Narberth Borough | 5.20% | 1.03%(+4.17)#26 | 1.61%(+3.59)#712 |
| 27. | Penn Farms | 5.16% | 1.03%(+4.13)#27 | 1.61%(+3.56)#721 |
| 28. | Franklin Park Borough | 5.14% | 1.03%(+4.11)#28 | 1.61%(+3.53)#725 |
| 29. | Davidsville | 5.07% | 1.03%(+4.04)#29 | 1.61%(+3.46)#742 |
| 30. | Lionville | 5.06% | 1.03%(+4.02)#30 | 1.61%(+3.45)#743 |
| 31. | Maitland | 4.95% | 1.03%(+3.92)#31 | 1.61%(+3.34)#759 |
| 32. | Avondale Borough | 4.94% | 1.03%(+3.91)#32 | 1.61%(+3.33)#761 |
| 33. | Trooper | 4.86% | 1.03%(+3.83)#33 | 1.61%(+3.25)#773 |
| 34. | Patterson Heights Borough | 4.81% | 1.03%(+3.78)#34 | 1.61%(+3.20)#783 |
| 35. | Swarthmore Borough | 4.78% | 1.03%(+3.75)#35 | 1.61%(+3.17)#793 |
| 36. | Kulpsville | 4.71% | 1.03%(+3.68)#36 | 1.61%(+3.10)#804 |
| 37. | Garrett Borough | 4.65% | 1.03%(+3.61)#37 | 1.61%(+3.04)#819 |
| 38. | Conyngham Borough | 4.58% | 1.03%(+3.55)#38 | 1.61%(+2.97)#843 |
| 39. | Paxtang Borough | 4.52% | 1.03%(+3.49)#39 | 1.61%(+2.91)#862 |
| 40. | Newtown Grant | 4.22% | 1.03%(+3.19)#40 | 1.61%(+2.61)#914 |
| 41. | Villanova | 4.07% | 1.03%(+3.04)#41 | 1.61%(+2.46)#940 |
| 42. | Haverford College | 4.03% | 1.03%(+3.00)#42 | 1.61%(+2.42)#954 |
| 43. | Bryn Mawr | 3.92% | 1.03%(+2.89)#43 | 1.61%(+2.31)#981 |
| 44. | Connoquenessing Borough | 3.71% | 1.03%(+2.68)#44 | 1.61%(+2.10)#1,041 |
| 45. | Bala Cynwyd | 3.69% | 1.03%(+2.66)#45 | 1.61%(+2.08)#1,048 |
| 46. | Riverside Borough | 3.67% | 1.03%(+2.64)#46 | 1.61%(+2.06)#1,056 |
| 47. | Maple Glen | 3.65% | 1.03%(+2.61)#47 | 1.61%(+2.04)#1,062 |
| 48. | Blawnox Borough | 3.52% | 1.03%(+2.49)#48 | 1.61%(+1.92)#1,093 |
| 49. | Apollo Borough | 3.45% | 1.03%(+2.42)#49 | 1.61%(+1.84)#1,128 |
| 50. | Eagleville Cdp Montgomery County | 3.33% | 1.03%(+2.30)#50 | 1.61%(+1.72)#1,167 |
| 51. | Wesleyville Borough | 3.24% | 1.03%(+2.21)#51 | 1.61%(+1.63)#1,198 |
| 52. | Bradford Woods Borough | 3.24% | 1.03%(+2.21)#52 | 1.61%(+1.63)#1,200 |
| 53. | Shade Gap Borough | 3.23% | 1.03%(+2.19)#53 | 1.61%(+1.62)#1,203 |
| 54. | Fox Chapel Borough | 3.17% | 1.03%(+2.14)#54 | 1.61%(+1.56)#1,223 |
| 55. | University Of Pittsburgh Bradford | 3.08% | 1.03%(+2.05)#55 | 1.61%(+1.47)#1,263 |
| 56. | Mattawana | 3.02% | 1.03%(+1.98)#56 | 1.61%(+1.41)#1,292 |
| 57. | Big Beaver Borough | 3.01% | 1.03%(+1.98)#57 | 1.61%(+1.40)#1,300 |
| 58. | Dublin Borough | 2.99% | 1.03%(+1.96)#58 | 1.61%(+1.38)#1,308 |
| 59. | Broomall | 2.99% | 1.03%(+1.96)#59 | 1.61%(+1.38)#1,309 |
| 60. | Malvern Borough | 2.98% | 1.03%(+1.95)#60 | 1.61%(+1.37)#1,315 |
| 61. | Long Branch Borough | 2.96% | 1.03%(+1.93)#61 | 1.61%(+1.35)#1,325 |
| 62. | Cumbola | 2.87% | 1.03%(+1.84)#62 | 1.61%(+1.26)#1,352 |
| 63. | Philadelphia | 2.86% | 1.03%(+1.82)#63 | 1.61%(+1.25)#1,359 |
| 64. | Fort Washington | 2.84% | 1.03%(+1.80)#64 | 1.61%(+1.23)#1,364 |
| 65. | Plumsteadville | 2.83% | 1.03%(+1.79)#65 | 1.61%(+1.22)#1,367 |
| 66. | Great Bend Borough | 2.82% | 1.03%(+1.79)#66 | 1.61%(+1.21)#1,369 |
| 67. | North Belle Vernon Borough | 2.82% | 1.03%(+1.78)#67 | 1.61%(+1.21)#1,373 |
| 68. | Zion | 2.82% | 1.03%(+1.78)#68 | 1.61%(+1.21)#1,374 |
| 69. | Salunga | 2.76% | 1.03%(+1.73)#69 | 1.61%(+1.15)#1,406 |
| 70. | Montgomeryville | 2.76% | 1.03%(+1.73)#70 | 1.61%(+1.15)#1,408 |
| 71. | Reamstown | 2.74% | 1.03%(+1.71)#71 | 1.61%(+1.13)#1,420 |
| 72. | Rose Valley Borough | 2.70% | 1.03%(+1.66)#72 | 1.61%(+1.09)#1,449 |
| 73. | Emlenton Borough | 2.62% | 1.03%(+1.58)#73 | 1.61%(+1.01)#1,492 |
| 74. | Glenburn | 2.61% | 1.03%(+1.58)#74 | 1.61%(+0.999)#1,497 |
| 75. | Merion Station | 2.60% | 1.03%(+1.56)#75 | 1.61%(+0.987)#1,507 |
| 76. | Devon | 2.59% | 1.03%(+1.56)#76 | 1.61%(+0.984)#1,509 |
| 77. | East Vandergrift Borough | 2.57% | 1.03%(+1.54)#77 | 1.61%(+0.959)#1,525 |
| 78. | Lemont | 2.49% | 1.03%(+1.46)#78 | 1.61%(+0.885)#1,585 |
| 79. | Kulpmont Borough | 2.43% | 1.03%(+1.40)#79 | 1.61%(+0.821)#1,621 |
| 80. | Bridgewater Borough | 2.41% | 1.03%(+1.38)#80 | 1.61%(+0.802)#1,633 |
| 81. | Meyersdale Borough | 2.41% | 1.03%(+1.38)#81 | 1.61%(+0.799)#1,637 |
| 82. | Willow Street | 2.41% | 1.03%(+1.38)#82 | 1.61%(+0.798)#1,638 |
| 83. | Watsontown Borough | 2.40% | 1.03%(+1.37)#83 | 1.61%(+0.791)#1,641 |
| 84. | Dilworthtown | 2.37% | 1.03%(+1.34)#84 | 1.61%(+0.765)#1,668 |
| 85. | Atlasburg | 2.34% | 1.03%(+1.31)#85 | 1.61%(+0.729)#1,693 |
| 86. | Connellsville | 2.33% | 1.03%(+1.30)#86 | 1.61%(+0.718)#1,702 |
| 87. | Enlow | 2.32% | 1.03%(+1.29)#87 | 1.61%(+0.715)#1,706 |
| 88. | Phoenixville Borough | 2.30% | 1.03%(+1.27)#88 | 1.61%(+0.693)#1,720 |
| 89. | Mcknightstown | 2.19% | 1.03%(+1.16)#89 | 1.61%(+0.579)#1,794 |
| 90. | Enon Valley Borough | 2.15% | 1.03%(+1.12)#90 | 1.61%(+0.538)#1,827 |
| 91. | Dover Borough | 2.14% | 1.03%(+1.11)#91 | 1.61%(+0.533)#1,838 |
| 92. | Breinigsville | 2.14% | 1.03%(+1.10)#92 | 1.61%(+0.527)#1,843 |
| 93. | Pittsburgh | 2.13% | 1.03%(+1.10)#93 | 1.61%(+0.519)#1,849 |
| 94. | Ardmore | 2.12% | 1.03%(+1.09)#94 | 1.61%(+0.516)#1,857 |
| 95. | Mount Pleasant Mills | 2.10% | 1.03%(+1.07)#95 | 1.61%(+0.489)#1,872 |
| 96. | Sellersville Borough | 2.05% | 1.03%(+1.02)#96 | 1.61%(+0.441)#1,897 |
| 97. | Brodheadsville | 2.04% | 1.03%(+1.01)#97 | 1.61%(+0.433)#1,904 |
| 98. | Hershey | 2.01% | 1.03%(+0.978)#98 | 1.61%(+0.400)#1,932 |
| 99. | New Kensington | 2.00% | 1.03%(+0.966)#99 | 1.61%(+0.389)#1,943 |
| 100. | Marklesburg Borough | 1.99% | 1.03%(+0.963)#100 | 1.61%(+0.386)#1,948 |
Common Questions
What are the Top 10 Cities with the Highest Percentage of Indian (Asian) Population in Pennsylvania?
Top 10 Cities with the Highest Percentage of Indian (Asian) Population in Pennsylvania are:
#1
18.42%
#2
10.17%
#3
9.09%
#4
8.54%
#5
8.31%
#6
7.80%
#7
7.34%
#8
6.38%
#9
6.10%
#10
5.90%
What city has the Highest Percentage of Indian (Asian) Population in Pennsylvania?
Cheyney University has the Highest Percentage of Indian (Asian) Population in Pennsylvania with 18.42%.
What is the Percentage of Indian (Asian) Population in the State of Pennsylvania?
Percentage of Indian (Asian) Population in Pennsylvania is 1.03%.
What is the Percentage of Indian (Asian) Population in the United States?
Percentage of Indian (Asian) Population in the United States is 1.61%.