Cities with the Highest Percentage of Indian (Asian) Population in Minnesota
RELATED REPORTS & OPTIONS
Indian (Asian)
Minnesota
Compare Cities
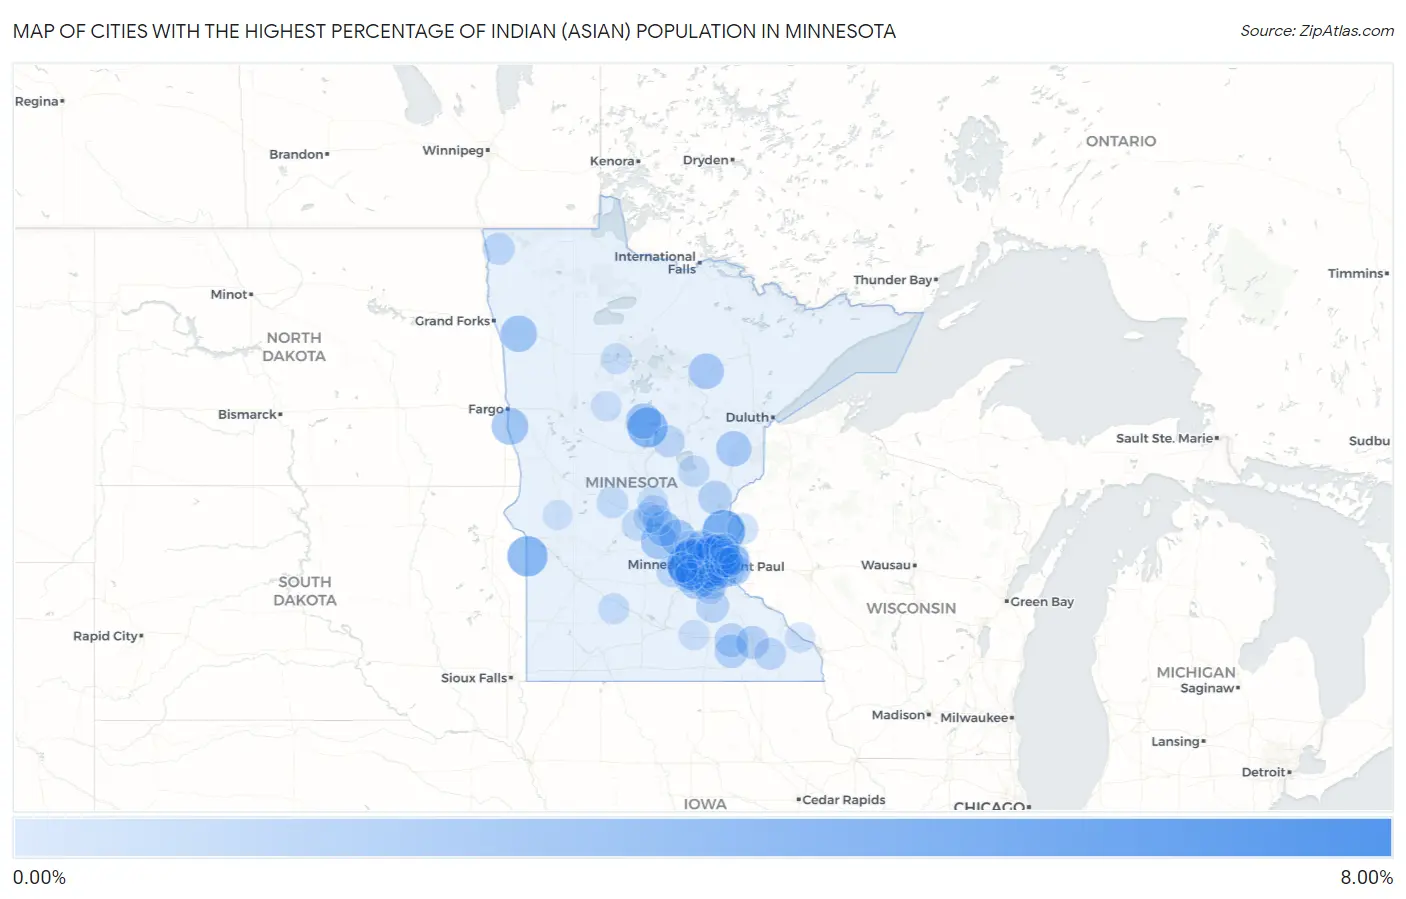
Map of Cities with the Highest Percentage of Indian (Asian) Population in Minnesota
0.00%
8.00%
Cities with the Highest Percentage of Indian (Asian) Population in Minnesota
| City | Indian (Asian) | vs State | vs National | |
| 1. | Lauderdale | 6.85% | 0.71%(+6.13)#1 | 1.61%(+5.24)#495 |
| 2. | Orono | 5.50% | 0.71%(+4.78)#2 | 1.61%(+3.89)#659 |
| 3. | Stacy | 4.54% | 0.71%(+3.82)#3 | 1.61%(+2.93)#855 |
| 4. | Falcon Heights | 4.07% | 0.71%(+3.36)#4 | 1.61%(+2.46)#941 |
| 5. | Nassau | 3.85% | 0.71%(+3.13)#5 | 1.61%(+2.24)#1,011 |
| 6. | Shoreview | 3.75% | 0.71%(+3.04)#6 | 1.61%(+2.15)#1,028 |
| 7. | Jenkins | 3.72% | 0.71%(+3.01)#7 | 1.61%(+2.11)#1,035 |
| 8. | Medina | 3.32% | 0.71%(+2.61)#8 | 1.61%(+1.71)#1,170 |
| 9. | North Oaks | 3.12% | 0.71%(+2.41)#9 | 1.61%(+1.51)#1,248 |
| 10. | St. John's University | 2.74% | 0.71%(+2.03)#10 | 1.61%(+1.13)#1,424 |
| 11. | Edina | 2.73% | 0.71%(+2.02)#11 | 1.61%(+1.13)#1,426 |
| 12. | Comstock | 2.67% | 0.71%(+1.95)#12 | 1.61%(+1.06)#1,469 |
| 13. | Crookston | 2.58% | 0.71%(+1.87)#13 | 1.61%(+0.974)#1,515 |
| 14. | Columbia Heights | 2.42% | 0.71%(+1.71)#14 | 1.61%(+0.815)#1,626 |
| 15. | Annandale | 2.42% | 0.71%(+1.70)#15 | 1.61%(+0.808)#1,629 |
| 16. | Monticello | 2.39% | 0.71%(+1.68)#16 | 1.61%(+0.786)#1,646 |
| 17. | Pine River | 2.37% | 0.71%(+1.65)#17 | 1.61%(+0.758)#1,675 |
| 18. | Eden Prairie | 2.37% | 0.71%(+1.65)#18 | 1.61%(+0.757)#1,676 |
| 19. | Marble | 2.28% | 0.71%(+1.57)#19 | 1.61%(+0.671)#1,738 |
| 20. | Shakopee | 2.27% | 0.71%(+1.56)#20 | 1.61%(+0.662)#1,746 |
| 21. | Arden Hills | 2.26% | 0.71%(+1.55)#21 | 1.61%(+0.655)#1,750 |
| 22. | Sturgeon Lake | 2.25% | 0.71%(+1.53)#22 | 1.61%(+0.638)#1,757 |
| 23. | Clearwater | 2.19% | 0.71%(+1.48)#23 | 1.61%(+0.583)#1,793 |
| 24. | New Brighton | 2.04% | 0.71%(+1.33)#24 | 1.61%(+0.435)#1,903 |
| 25. | St Anthony City Hennepin And Ramsey Counties | 1.95% | 0.71%(+1.24)#25 | 1.61%(+0.342)#2,001 |
| 26. | Plymouth | 1.93% | 0.71%(+1.22)#26 | 1.61%(+0.321)#2,018 |
| 27. | Medicine Lake | 1.91% | 0.71%(+1.20)#27 | 1.61%(+0.301)#2,036 |
| 28. | Tonka Bay | 1.85% | 0.71%(+1.13)#28 | 1.61%(+0.238)#2,103 |
| 29. | Dodge Center | 1.70% | 0.71%(+0.982)#29 | 1.61%(+0.087)#2,288 |
| 30. | Grasston | 1.68% | 0.71%(+0.967)#30 | 1.61%(+0.072)#2,302 |
| 31. | Minnetonka | 1.68% | 0.71%(+0.966)#31 | 1.61%(+0.071)#2,304 |
| 32. | Woodbury | 1.68% | 0.71%(+0.965)#32 | 1.61%(+0.070)#2,306 |
| 33. | St Louis Park | 1.67% | 0.71%(+0.959)#33 | 1.61%(+0.064)#2,313 |
| 34. | Sunfish Lake | 1.63% | 0.71%(+0.914)#34 | 1.61%(+0.019)#2,374 |
| 35. | Hayfield | 1.62% | 0.71%(+0.911)#35 | 1.61%(+0.016)#2,380 |
| 36. | Apple Valley | 1.58% | 0.71%(+0.864)#36 | 1.61%(-0.031)#2,422 |
| 37. | Rochester | 1.56% | 0.71%(+0.847)#37 | 1.61%(-0.049)#2,445 |
| 38. | Roseville | 1.55% | 0.71%(+0.837)#38 | 1.61%(-0.059)#2,456 |
| 39. | Circle Pines | 1.54% | 0.71%(+0.828)#39 | 1.61%(-0.068)#2,469 |
| 40. | Mahtomedi | 1.54% | 0.71%(+0.823)#40 | 1.61%(-0.073)#2,477 |
| 41. | Northfield | 1.46% | 0.71%(+0.749)#41 | 1.61%(-0.147)#2,598 |
| 42. | Brooklyn Park | 1.38% | 0.71%(+0.664)#42 | 1.61%(-0.232)#2,735 |
| 43. | Stillwater | 1.38% | 0.71%(+0.664)#43 | 1.61%(-0.232)#2,737 |
| 44. | Robbinsdale | 1.35% | 0.71%(+0.636)#44 | 1.61%(-0.259)#2,771 |
| 45. | Mound | 1.31% | 0.71%(+0.592)#45 | 1.61%(-0.304)#2,837 |
| 46. | Minneapolis | 1.26% | 0.71%(+0.549)#46 | 1.61%(-0.347)#2,910 |
| 47. | Mayer | 1.26% | 0.71%(+0.547)#47 | 1.61%(-0.349)#2,918 |
| 48. | Hallock | 1.25% | 0.71%(+0.535)#48 | 1.61%(-0.360)#2,951 |
| 49. | Crosby | 1.23% | 0.71%(+0.517)#49 | 1.61%(-0.378)#2,984 |
| 50. | Sartell | 1.21% | 0.71%(+0.494)#50 | 1.61%(-0.401)#3,032 |
| 51. | Chatfield | 1.20% | 0.71%(+0.483)#51 | 1.61%(-0.412)#3,056 |
| 52. | Wahkon | 1.11% | 0.71%(+0.394)#52 | 1.61%(-0.502)#3,243 |
| 53. | Champlin | 1.09% | 0.71%(+0.377)#53 | 1.61%(-0.519)#3,281 |
| 54. | Afton | 1.08% | 0.71%(+0.371)#54 | 1.61%(-0.524)#3,292 |
| 55. | Richmond | 1.05% | 0.71%(+0.340)#55 | 1.61%(-0.555)#3,362 |
| 56. | Bloomington | 1.05% | 0.71%(+0.338)#56 | 1.61%(-0.558)#3,369 |
| 57. | Sauk Centre | 1.05% | 0.71%(+0.338)#57 | 1.61%(-0.558)#3,370 |
| 58. | Mounds View | 0.99% | 0.71%(+0.279)#58 | 1.61%(-0.616)#3,532 |
| 59. | Taylors Falls | 0.98% | 0.71%(+0.271)#59 | 1.61%(-0.624)#3,554 |
| 60. | Savage | 0.97% | 0.71%(+0.255)#60 | 1.61%(-0.641)#3,598 |
| 61. | Richfield | 0.97% | 0.71%(+0.254)#61 | 1.61%(-0.642)#3,600 |
| 62. | Rogers | 0.93% | 0.71%(+0.220)#62 | 1.61%(-0.675)#3,695 |
| 63. | Lilydale | 0.92% | 0.71%(+0.207)#63 | 1.61%(-0.689)#3,733 |
| 64. | Morgan | 0.92% | 0.71%(+0.206)#64 | 1.61%(-0.689)#3,735 |
| 65. | Little Canada | 0.90% | 0.71%(+0.190)#65 | 1.61%(-0.705)#3,795 |
| 66. | Pine Springs | 0.90% | 0.71%(+0.190)#66 | 1.61%(-0.706)#3,797 |
| 67. | Maple Grove | 0.90% | 0.71%(+0.185)#67 | 1.61%(-0.710)#3,806 |
| 68. | St Joseph | 0.88% | 0.71%(+0.164)#68 | 1.61%(-0.731)#3,872 |
| 69. | Bemidji | 0.87% | 0.71%(+0.155)#69 | 1.61%(-0.741)#3,909 |
| 70. | Mendota Heights | 0.87% | 0.71%(+0.154)#70 | 1.61%(-0.741)#3,910 |
| 71. | Hopkins | 0.86% | 0.71%(+0.145)#71 | 1.61%(-0.750)#3,935 |
| 72. | St Paul | 0.83% | 0.71%(+0.119)#72 | 1.61%(-0.776)#4,026 |
| 73. | Golden Valley | 0.82% | 0.71%(+0.109)#73 | 1.61%(-0.787)#4,063 |
| 74. | New Hope | 0.82% | 0.71%(+0.105)#74 | 1.61%(-0.790)#4,071 |
| 75. | Maplewood | 0.81% | 0.71%(+0.096)#75 | 1.61%(-0.800)#4,102 |
| 76. | St Cloud | 0.80% | 0.71%(+0.085)#76 | 1.61%(-0.811)#4,136 |
| 77. | Lakeville | 0.78% | 0.71%(+0.068)#77 | 1.61%(-0.828)#4,188 |
| 78. | Spring Lake Park | 0.78% | 0.71%(+0.062)#78 | 1.61%(-0.834)#4,210 |
| 79. | Bayport | 0.77% | 0.71%(+0.056)#79 | 1.61%(-0.840)#4,233 |
| 80. | Shorewood | 0.76% | 0.71%(+0.051)#80 | 1.61%(-0.845)#4,245 |
| 81. | Anoka | 0.76% | 0.71%(+0.047)#81 | 1.61%(-0.849)#4,256 |
| 82. | Blaine | 0.76% | 0.71%(+0.042)#82 | 1.61%(-0.854)#4,263 |
| 83. | Chanhassen | 0.75% | 0.71%(+0.033)#83 | 1.61%(-0.863)#4,296 |
| 84. | Waseca | 0.73% | 0.71%(+0.014)#84 | 1.61%(-0.881)#4,365 |
| 85. | Chaska | 0.73% | 0.71%(+0.014)#85 | 1.61%(-0.881)#4,366 |
| 86. | Park Rapids | 0.72% | 0.71%(+0.007)#86 | 1.61%(-0.888)#4,390 |
| 87. | Newport | 0.70% | 0.71%(-0.017)#87 | 1.61%(-0.912)#4,471 |
| 88. | Eagan | 0.69% | 0.71%(-0.025)#88 | 1.61%(-0.920)#4,501 |
| 89. | Corcoran | 0.69% | 0.71%(-0.026)#89 | 1.61%(-0.922)#4,505 |
| 90. | Rice | 0.68% | 0.71%(-0.029)#90 | 1.61%(-0.925)#4,513 |
| 91. | Winona | 0.68% | 0.71%(-0.035)#91 | 1.61%(-0.930)#4,532 |
| 92. | Lino Lakes | 0.68% | 0.71%(-0.035)#92 | 1.61%(-0.930)#4,534 |
| 93. | Oakdale | 0.66% | 0.71%(-0.057)#93 | 1.61%(-0.952)#4,629 |
| 94. | Dellwood | 0.65% | 0.71%(-0.062)#94 | 1.61%(-0.957)#4,649 |
| 95. | Morris | 0.65% | 0.71%(-0.065)#95 | 1.61%(-0.961)#4,665 |
| 96. | St Marys Point | 0.64% | 0.71%(-0.071)#96 | 1.61%(-0.966)#4,695 |
| 97. | Minnetrista | 0.63% | 0.71%(-0.078)#97 | 1.61%(-0.974)#4,719 |
| 98. | Hugo | 0.63% | 0.71%(-0.082)#98 | 1.61%(-0.977)#4,737 |
| 99. | Oak Park Heights | 0.63% | 0.71%(-0.087)#99 | 1.61%(-0.982)#4,761 |
| 100. | Lake Elmo | 0.62% | 0.71%(-0.098)#100 | 1.61%(-0.993)#4,799 |
Common Questions
What are the Top 10 Cities with the Highest Percentage of Indian (Asian) Population in Minnesota?
Top 10 Cities with the Highest Percentage of Indian (Asian) Population in Minnesota are:
#1
6.85%
#2
5.50%
#3
4.54%
#4
4.07%
#5
3.85%
#6
3.75%
#7
3.72%
#8
3.32%
#9
3.12%
#10
2.73%
What city has the Highest Percentage of Indian (Asian) Population in Minnesota?
Lauderdale has the Highest Percentage of Indian (Asian) Population in Minnesota with 6.85%.
What is the Percentage of Indian (Asian) Population in the State of Minnesota?
Percentage of Indian (Asian) Population in Minnesota is 0.71%.
What is the Percentage of Indian (Asian) Population in the United States?
Percentage of Indian (Asian) Population in the United States is 1.61%.