Cities with the Highest Percentage of Indian (Asian) Population in Missouri
RELATED REPORTS & OPTIONS
Indian (Asian)
Missouri
Compare Cities
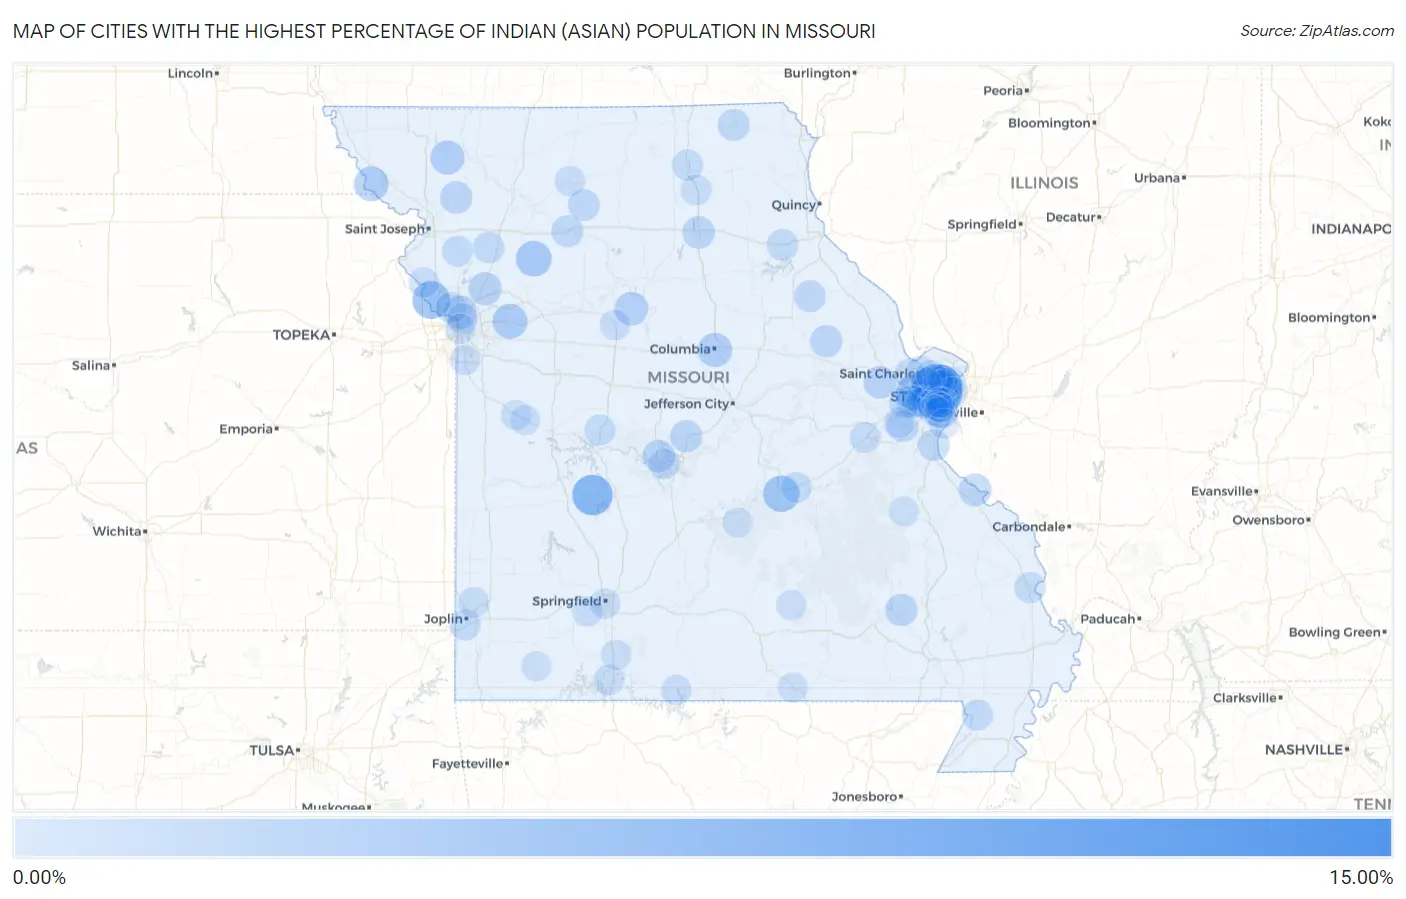
Map of Cities with the Highest Percentage of Indian (Asian) Population in Missouri
0.00%
15.00%
Cities with the Highest Percentage of Indian (Asian) Population in Missouri
| City | Indian (Asian) | vs State | vs National | |
| 1. | Olivette | 11.33% | 0.55%(+10.8)#1 | 1.61%(+9.72)#242 |
| 2. | Frontenac | 6.92% | 0.55%(+6.38)#2 | 1.61%(+5.32)#487 |
| 3. | Wheatland | 6.15% | 0.55%(+5.60)#3 | 1.61%(+4.54)#574 |
| 4. | Clayton | 5.75% | 0.55%(+5.20)#4 | 1.61%(+4.14)#634 |
| 5. | University City | 4.89% | 0.55%(+4.34)#5 | 1.61%(+3.28)#768 |
| 6. | Farley | 4.60% | 0.55%(+4.05)#6 | 1.61%(+2.99)#831 |
| 7. | Creve Coeur | 4.43% | 0.55%(+3.88)#7 | 1.61%(+2.82)#879 |
| 8. | Rolla | 3.90% | 0.55%(+3.35)#8 | 1.61%(+2.29)#988 |
| 9. | Sycamore Hills | 3.86% | 0.55%(+3.32)#9 | 1.61%(+2.26)#998 |
| 10. | Crystal Lake Park | 3.70% | 0.55%(+3.15)#10 | 1.61%(+2.09)#1,047 |
| 11. | Chesterfield | 3.58% | 0.55%(+3.03)#11 | 1.61%(+1.97)#1,081 |
| 12. | Cowgill | 3.48% | 0.55%(+2.93)#12 | 1.61%(+1.87)#1,110 |
| 13. | Levasy | 3.03% | 0.55%(+2.48)#13 | 1.61%(+1.42)#1,282 |
| 14. | Big Lake | 2.90% | 0.55%(+2.35)#14 | 1.61%(+1.29)#1,341 |
| 15. | Columbia | 2.72% | 0.55%(+2.17)#15 | 1.61%(+1.11)#1,436 |
| 16. | Conception | 2.63% | 0.55%(+2.08)#16 | 1.61%(+1.02)#1,485 |
| 17. | Green Park | 2.57% | 0.55%(+2.02)#17 | 1.61%(+0.958)#1,529 |
| 18. | Town And Country | 2.54% | 0.55%(+1.99)#18 | 1.61%(+0.931)#1,548 |
| 19. | Slater | 2.37% | 0.55%(+1.82)#19 | 1.61%(+0.757)#1,677 |
| 20. | Westwood | 2.27% | 0.55%(+1.72)#20 | 1.61%(+0.657)#1,748 |
| 21. | Richmond Heights | 2.22% | 0.55%(+1.67)#21 | 1.61%(+0.612)#1,775 |
| 22. | Oaks | 2.19% | 0.55%(+1.64)#22 | 1.61%(+0.577)#1,795 |
| 23. | Kearney | 2.14% | 0.55%(+1.60)#23 | 1.61%(+0.536)#1,833 |
| 24. | Maplewood | 1.96% | 0.55%(+1.41)#24 | 1.61%(+0.353)#1,984 |
| 25. | New Melle | 1.91% | 0.55%(+1.36)#25 | 1.61%(+0.305)#2,033 |
| 26. | Ste Genevieve | 1.87% | 0.55%(+1.32)#26 | 1.61%(+0.264)#2,069 |
| 27. | Brentwood | 1.87% | 0.55%(+1.32)#27 | 1.61%(+0.263)#2,070 |
| 28. | Ellisville | 1.84% | 0.55%(+1.29)#28 | 1.61%(+0.227)#2,114 |
| 29. | Laurie | 1.82% | 0.55%(+1.27)#29 | 1.61%(+0.208)#2,134 |
| 30. | Union Star | 1.76% | 0.55%(+1.21)#30 | 1.61%(+0.149)#2,197 |
| 31. | Vinita Park | 1.72% | 0.55%(+1.17)#31 | 1.61%(+0.114)#2,243 |
| 32. | Macon | 1.71% | 0.55%(+1.16)#32 | 1.61%(+0.097)#2,272 |
| 33. | Bellflower | 1.64% | 0.55%(+1.09)#33 | 1.61%(+0.031)#2,358 |
| 34. | Eldon | 1.60% | 0.55%(+1.05)#34 | 1.61%(-0.008)#2,400 |
| 35. | Piedmont | 1.57% | 0.55%(+1.02)#35 | 1.61%(-0.039)#2,438 |
| 36. | Memphis | 1.50% | 0.55%(+0.955)#36 | 1.61%(-0.105)#2,527 |
| 37. | Ladue | 1.50% | 0.55%(+0.951)#37 | 1.61%(-0.109)#2,537 |
| 38. | Utica | 1.49% | 0.55%(+0.936)#38 | 1.61%(-0.124)#2,558 |
| 39. | Vandalia | 1.48% | 0.55%(+0.929)#39 | 1.61%(-0.130)#2,569 |
| 40. | Manchester | 1.45% | 0.55%(+0.898)#40 | 1.61%(-0.161)#2,622 |
| 41. | Labarque Creek | 1.42% | 0.55%(+0.866)#41 | 1.61%(-0.193)#2,677 |
| 42. | Wildwood | 1.40% | 0.55%(+0.854)#42 | 1.61%(-0.206)#2,698 |
| 43. | Chula | 1.37% | 0.55%(+0.821)#43 | 1.61%(-0.239)#2,748 |
| 44. | Pevely | 1.36% | 0.55%(+0.815)#44 | 1.61%(-0.245)#2,756 |
| 45. | Turney | 1.31% | 0.55%(+0.758)#45 | 1.61%(-0.302)#2,836 |
| 46. | Jennings | 1.30% | 0.55%(+0.751)#46 | 1.61%(-0.308)#2,846 |
| 47. | Monroe City | 1.26% | 0.55%(+0.710)#47 | 1.61%(-0.349)#2,920 |
| 48. | Overland | 1.24% | 0.55%(+0.695)#48 | 1.61%(-0.365)#2,960 |
| 49. | Normandy | 1.21% | 0.55%(+0.660)#49 | 1.61%(-0.400)#3,028 |
| 50. | St Ann | 1.20% | 0.55%(+0.651)#50 | 1.61%(-0.409)#3,049 |
| 51. | Platte Woods | 1.19% | 0.55%(+0.644)#51 | 1.61%(-0.416)#3,063 |
| 52. | Bel Nor | 1.19% | 0.55%(+0.637)#52 | 1.61%(-0.423)#3,073 |
| 53. | Ballwin | 1.19% | 0.55%(+0.637)#53 | 1.61%(-0.423)#3,074 |
| 54. | Cape Girardeau | 1.08% | 0.55%(+0.526)#54 | 1.61%(-0.533)#3,308 |
| 55. | Kirksville | 1.06% | 0.55%(+0.506)#55 | 1.61%(-0.554)#3,357 |
| 56. | Holcomb | 1.05% | 0.55%(+0.498)#56 | 1.61%(-0.562)#3,379 |
| 57. | Lincoln | 1.00% | 0.55%(+0.456)#57 | 1.61%(-0.604)#3,494 |
| 58. | Shoal Creek Drive | 1.00% | 0.55%(+0.454)#58 | 1.61%(-0.605)#3,497 |
| 59. | Gower | 0.99% | 0.55%(+0.440)#59 | 1.61%(-0.619)#3,541 |
| 60. | St James | 0.99% | 0.55%(+0.440)#60 | 1.61%(-0.619)#3,542 |
| 61. | Kirkwood | 0.98% | 0.55%(+0.427)#61 | 1.61%(-0.633)#3,581 |
| 62. | Oronogo | 0.96% | 0.55%(+0.414)#62 | 1.61%(-0.646)#3,611 |
| 63. | La Plata | 0.95% | 0.55%(+0.399)#63 | 1.61%(-0.660)#3,652 |
| 64. | St Louis | 0.94% | 0.55%(+0.387)#64 | 1.61%(-0.672)#3,688 |
| 65. | St Clair | 0.92% | 0.55%(+0.373)#65 | 1.61%(-0.687)#3,722 |
| 66. | Affton | 0.91% | 0.55%(+0.364)#66 | 1.61%(-0.695)#3,754 |
| 67. | Avondale | 0.87% | 0.55%(+0.326)#67 | 1.61%(-0.734)#3,880 |
| 68. | Sunrise Beach | 0.86% | 0.55%(+0.315)#68 | 1.61%(-0.745)#3,920 |
| 69. | St Peters | 0.85% | 0.55%(+0.304)#69 | 1.61%(-0.756)#3,952 |
| 70. | Shrewsbury | 0.85% | 0.55%(+0.301)#70 | 1.61%(-0.759)#3,960 |
| 71. | St Charles | 0.84% | 0.55%(+0.295)#71 | 1.61%(-0.764)#3,980 |
| 72. | Glendale | 0.83% | 0.55%(+0.283)#72 | 1.61%(-0.777)#4,029 |
| 73. | Edmundson | 0.82% | 0.55%(+0.268)#73 | 1.61%(-0.792)#4,077 |
| 74. | Weston | 0.80% | 0.55%(+0.254)#74 | 1.61%(-0.806)#4,119 |
| 75. | Lake Tekakwitha | 0.79% | 0.55%(+0.245)#75 | 1.61%(-0.815)#4,146 |
| 76. | Maryland Heights | 0.79% | 0.55%(+0.241)#76 | 1.61%(-0.819)#4,157 |
| 77. | Trenton | 0.78% | 0.55%(+0.229)#77 | 1.61%(-0.831)#4,196 |
| 78. | Branson | 0.77% | 0.55%(+0.226)#78 | 1.61%(-0.834)#4,213 |
| 79. | Crestwood | 0.76% | 0.55%(+0.206)#79 | 1.61%(-0.854)#4,264 |
| 80. | Marshall | 0.75% | 0.55%(+0.196)#80 | 1.61%(-0.864)#4,299 |
| 81. | Sunset Hills | 0.73% | 0.55%(+0.185)#81 | 1.61%(-0.874)#4,337 |
| 82. | Springfield | 0.70% | 0.55%(+0.154)#82 | 1.61%(-0.906)#4,450 |
| 83. | Kinloch | 0.69% | 0.55%(+0.138)#83 | 1.61%(-0.921)#4,504 |
| 84. | Theodosia | 0.68% | 0.55%(+0.136)#84 | 1.61%(-0.924)#4,510 |
| 85. | Bridgeton | 0.66% | 0.55%(+0.107)#85 | 1.61%(-0.952)#4,628 |
| 86. | Republic | 0.65% | 0.55%(+0.099)#86 | 1.61%(-0.961)#4,661 |
| 87. | Grandview | 0.64% | 0.55%(+0.091)#87 | 1.61%(-0.968)#4,702 |
| 88. | Saddlebrooke | 0.64% | 0.55%(+0.088)#88 | 1.61%(-0.972)#4,714 |
| 89. | Creighton | 0.61% | 0.55%(+0.059)#89 | 1.61%(-1.00)#4,823 |
| 90. | Butterfield | 0.59% | 0.55%(+0.038)#90 | 1.61%(-1.02)#4,926 |
| 91. | Summersville | 0.58% | 0.55%(+0.036)#91 | 1.61%(-1.02)#4,936 |
| 92. | Koshkonong | 0.57% | 0.55%(+0.026)#92 | 1.61%(-1.03)#4,987 |
| 93. | Urich | 0.57% | 0.55%(+0.019)#93 | 1.61%(-1.04)#5,023 |
| 94. | Kansas City | 0.56% | 0.55%(+0.015)#94 | 1.61%(-1.04)#5,053 |
| 95. | Concord | 0.56% | 0.55%(+0.010)#95 | 1.61%(-1.05)#5,076 |
| 96. | Fort Leonard Wood | 0.56% | 0.55%(+0.008)#96 | 1.61%(-1.05)#5,091 |
| 97. | Oakville | 0.55% | 0.55%(-0.001)#97 | 1.61%(-1.06)#5,131 |
| 98. | Webster Groves | 0.55% | 0.55%(-0.004)#98 | 1.61%(-1.06)#5,143 |
| 99. | Grantwood Village | 0.54% | 0.55%(-0.008)#99 | 1.61%(-1.07)#5,171 |
| 100. | Irondale | 0.54% | 0.55%(-0.013)#100 | 1.61%(-1.07)#5,199 |
Common Questions
What are the Top 10 Cities with the Highest Percentage of Indian (Asian) Population in Missouri?
Top 10 Cities with the Highest Percentage of Indian (Asian) Population in Missouri are:
#1
11.33%
#2
6.92%
#3
6.15%
#4
5.75%
#5
4.89%
#6
4.60%
#7
4.43%
#8
3.90%
#9
3.86%
#10
3.70%
What city has the Highest Percentage of Indian (Asian) Population in Missouri?
Olivette has the Highest Percentage of Indian (Asian) Population in Missouri with 11.33%.
What is the Percentage of Indian (Asian) Population in the State of Missouri?
Percentage of Indian (Asian) Population in Missouri is 0.55%.
What is the Percentage of Indian (Asian) Population in the United States?
Percentage of Indian (Asian) Population in the United States is 1.61%.