Big Lake, WA Map & Demographics
Big Lake Map
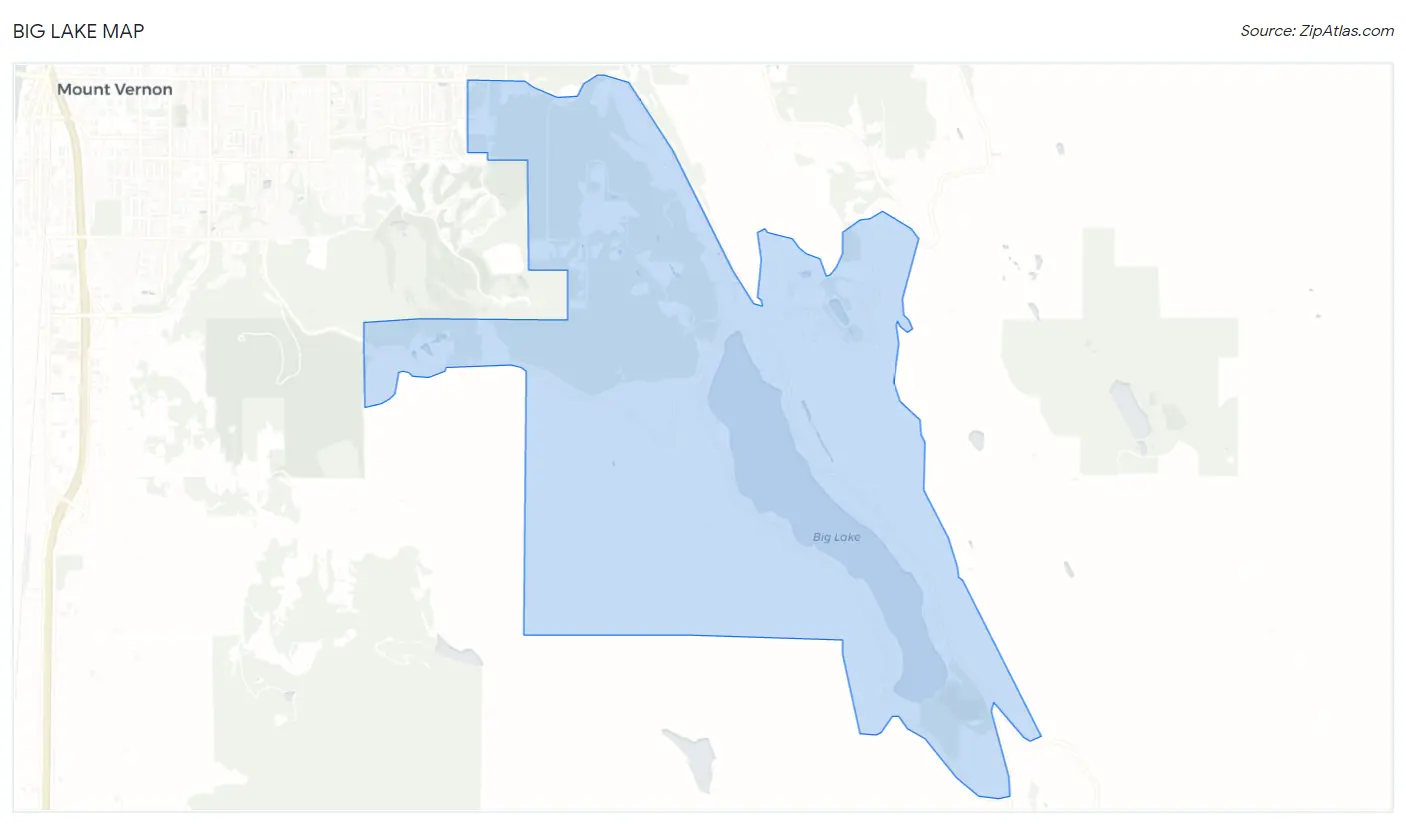
Big Lake Overview
$49,990
PER CAPITA INCOME
$127,965
AVG FAMILY INCOME
$108,654
AVG HOUSEHOLD INCOME
19.9%
WAGE / INCOME GAP [ % ]
80.1¢/ $1
WAGE / INCOME GAP [ $ ]
0.40
INEQUALITY / GINI INDEX
2,267
TOTAL POPULATION
1,154
MALE POPULATION
1,113
FEMALE POPULATION
103.68
MALES / 100 FEMALES
96.45
FEMALES / 100 MALES
53.9
MEDIAN AGE
2.9
AVG FAMILY SIZE
2.4
AVG HOUSEHOLD SIZE
896
LABOR FORCE [ PEOPLE ]
47.6%
PERCENT IN LABOR FORCE
2.1%
UNEMPLOYMENT RATE
Income in Big Lake
Income Overview in Big Lake
Per Capita Income in Big Lake is $49,990, while median incomes of families and households are $127,965 and $108,654 respectively.
| Characteristic | Number | Measure |
| Per Capita Income | 2,267 | $49,990 |
| Median Family Income | 678 | $127,965 |
| Mean Family Income | 678 | $140,972 |
| Median Household Income | 950 | $108,654 |
| Mean Household Income | 950 | $115,425 |
| Income Deficit | 678 | $0 |
| Wage / Income Gap (%) | 2,267 | 19.94% |
| Wage / Income Gap ($) | 2,267 | 80.06¢ per $1 |
| Gini / Inequality Index | 2,267 | 0.40 |
Earnings by Sex in Big Lake
Average Earnings in Big Lake are $60,750, $72,179 for men and $57,788 for women, a difference of 19.9%.
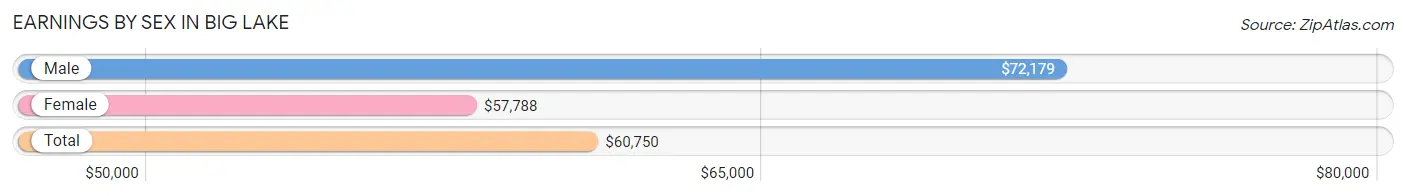
| Sex | Number | Average Earnings |
| Male | 599 (58.3%) | $72,179 |
| Female | 429 (41.7%) | $57,788 |
| Total | 1,028 (100.0%) | $60,750 |
Earnings by Sex by Income Bracket in Big Lake
The most common earnings brackets in Big Lake are $100,000+ for men (151 | 25.2%) and $100,000+ for women (76 | 17.7%).
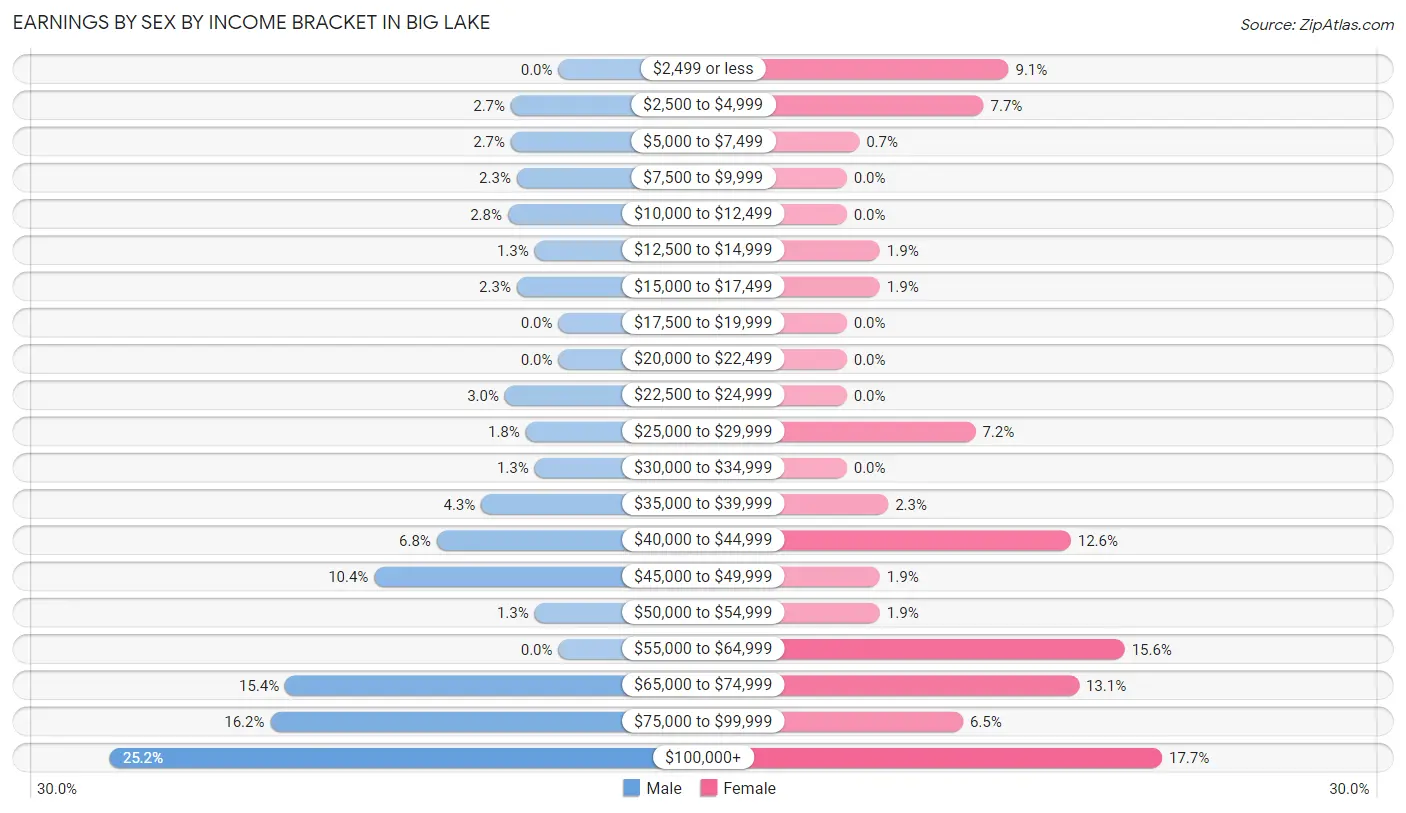
| Income | Male | Female |
| $2,499 or less | 0 (0.0%) | 39 (9.1%) |
| $2,500 to $4,999 | 16 (2.7%) | 33 (7.7%) |
| $5,000 to $7,499 | 16 (2.7%) | 3 (0.7%) |
| $7,500 to $9,999 | 14 (2.3%) | 0 (0.0%) |
| $10,000 to $12,499 | 17 (2.8%) | 0 (0.0%) |
| $12,500 to $14,999 | 8 (1.3%) | 8 (1.9%) |
| $15,000 to $17,499 | 14 (2.3%) | 8 (1.9%) |
| $17,500 to $19,999 | 0 (0.0%) | 0 (0.0%) |
| $20,000 to $22,499 | 0 (0.0%) | 0 (0.0%) |
| $22,500 to $24,999 | 18 (3.0%) | 0 (0.0%) |
| $25,000 to $29,999 | 11 (1.8%) | 31 (7.2%) |
| $30,000 to $34,999 | 8 (1.3%) | 0 (0.0%) |
| $35,000 to $39,999 | 26 (4.3%) | 10 (2.3%) |
| $40,000 to $44,999 | 41 (6.8%) | 54 (12.6%) |
| $45,000 to $49,999 | 62 (10.3%) | 8 (1.9%) |
| $50,000 to $54,999 | 8 (1.3%) | 8 (1.9%) |
| $55,000 to $64,999 | 0 (0.0%) | 67 (15.6%) |
| $65,000 to $74,999 | 92 (15.4%) | 56 (13.1%) |
| $75,000 to $99,999 | 97 (16.2%) | 28 (6.5%) |
| $100,000+ | 151 (25.2%) | 76 (17.7%) |
| Total | 599 (100.0%) | 429 (100.0%) |
Earnings by Sex by Educational Attainment in Big Lake
Average earnings in Big Lake are $72,979 for men and $59,135 for women, a difference of 19.0%. Men with an educational attainment of high school diploma enjoy the highest average annual earnings of $73,828, while those with bachelor's degree education earn the least with $49,293. Women with an educational attainment of graduate degree earn the most with the average annual earnings of $135,217, while those with bachelor's degree education have the smallest earnings of $36,375.
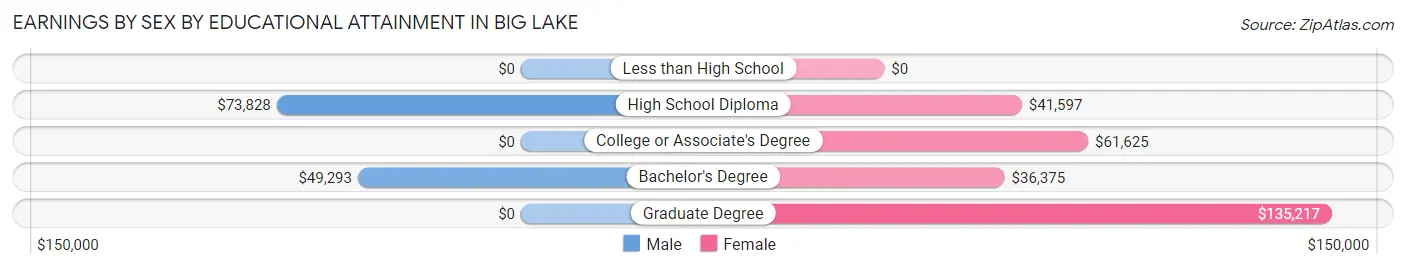
| Educational Attainment | Male Income | Female Income |
| Less than High School | - | - |
| High School Diploma | $73,828 | $41,597 |
| College or Associate's Degree | - | - |
| Bachelor's Degree | $49,293 | $36,375 |
| Graduate Degree | - | - |
| Total | $72,979 | $59,135 |
Family Income in Big Lake
Family Income Brackets in Big Lake
According to the Big Lake family income data, there are 231 families falling into the $100,000 to $149,999 income range, which is the most common income bracket and makes up 34.1% of all families.
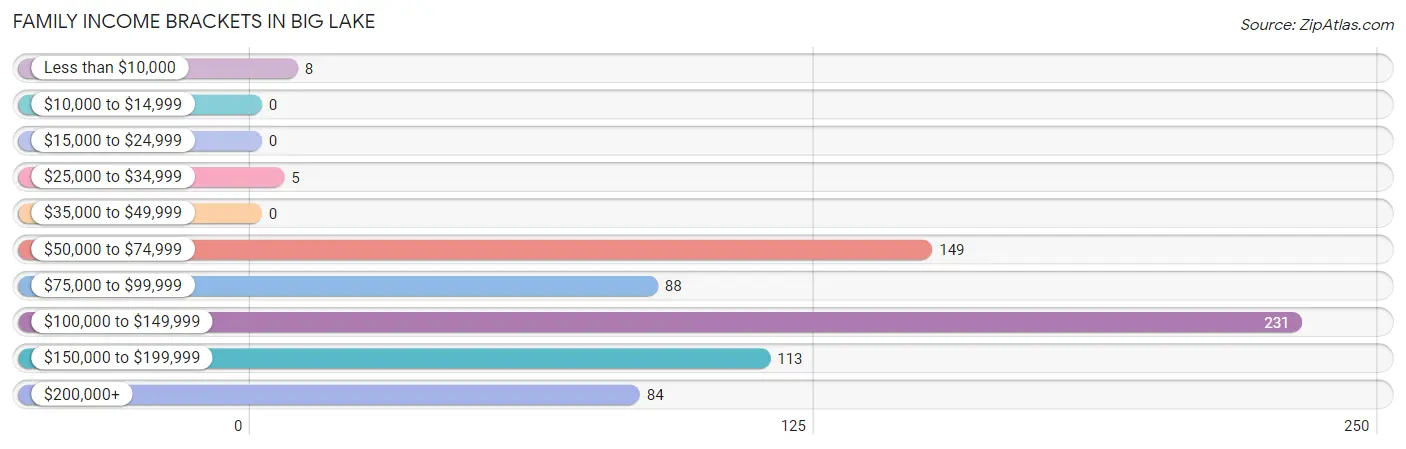
| Income Bracket | # Families | % Families |
| Less than $10,000 | 8 | 1.2% |
| $10,000 to $14,999 | 0 | 0.0% |
| $15,000 to $24,999 | 0 | 0.0% |
| $25,000 to $34,999 | 5 | 0.7% |
| $35,000 to $49,999 | 0 | 0.0% |
| $50,000 to $74,999 | 149 | 22.0% |
| $75,000 to $99,999 | 88 | 13.0% |
| $100,000 to $149,999 | 231 | 34.1% |
| $150,000 to $199,999 | 113 | 16.7% |
| $200,000+ | 84 | 12.4% |
Family Income by Famaliy Size in Big Lake
3-person families (143 | 21.1%) account for the highest median family income in Big Lake with $164,531 per family, while 3-person families (143 | 21.1%) have the highest median income of $54,844 per family member.
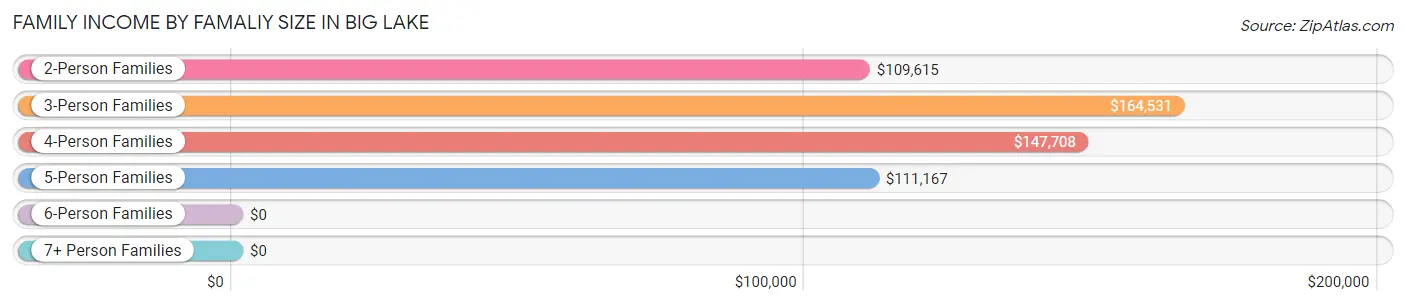
| Income Bracket | # Families | Median Income |
| 2-Person Families | 348 (51.3%) | $109,615 |
| 3-Person Families | 143 (21.1%) | $164,531 |
| 4-Person Families | 87 (12.8%) | $147,708 |
| 5-Person Families | 100 (14.7%) | $111,167 |
| 6-Person Families | 0 (0.0%) | $0 |
| 7+ Person Families | 0 (0.0%) | $0 |
| Total | 678 (100.0%) | $127,965 |
Family Income by Number of Earners in Big Lake
The median family income in Big Lake is $127,965, with families comprising 3+ earners (50) having the highest median family income of $188,594, while families with no earners (204) have the lowest median family income of $68,621, accounting for 7.4% and 30.1% of families, respectively.
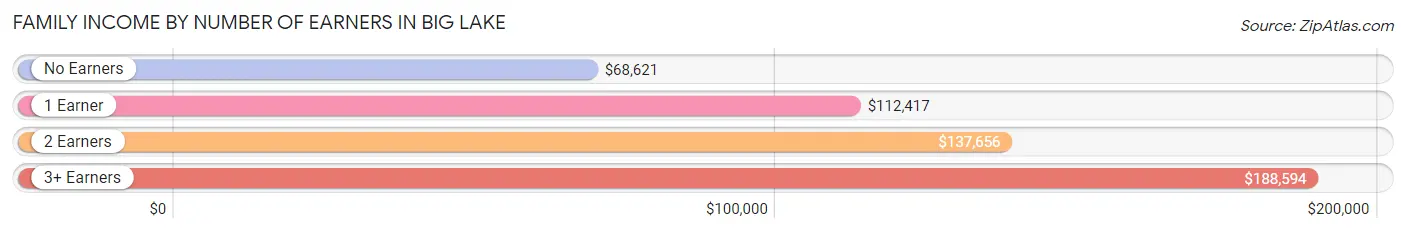
| Number of Earners | # Families | Median Income |
| No Earners | 204 (30.1%) | $68,621 |
| 1 Earner | 172 (25.4%) | $112,417 |
| 2 Earners | 252 (37.2%) | $137,656 |
| 3+ Earners | 50 (7.4%) | $188,594 |
| Total | 678 (100.0%) | $127,965 |
Household Income in Big Lake
Household Income Brackets in Big Lake
With 279 households falling in the category, the $100,000 to $149,999 income range is the most frequent in Big Lake, accounting for 29.4% of all households.
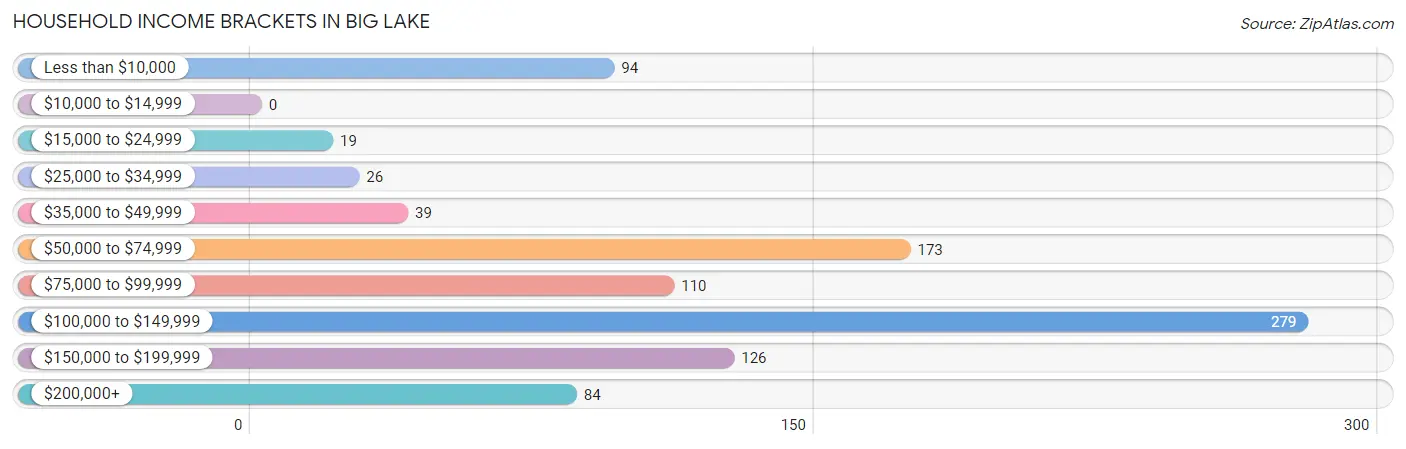
| Income Bracket | # Households | % Households |
| Less than $10,000 | 94 | 9.9% |
| $10,000 to $14,999 | 0 | 0.0% |
| $15,000 to $24,999 | 19 | 2.0% |
| $25,000 to $34,999 | 26 | 2.7% |
| $35,000 to $49,999 | 39 | 4.1% |
| $50,000 to $74,999 | 173 | 18.2% |
| $75,000 to $99,999 | 110 | 11.6% |
| $100,000 to $149,999 | 279 | 29.4% |
| $150,000 to $199,999 | 126 | 13.3% |
| $200,000+ | 84 | 8.8% |
Household Income by Householder Age in Big Lake
The median household income in Big Lake is $108,654, with the highest median household income of $128,333 found in the 45 to 64 years age bracket for the primary householder. A total of 376 households (39.6%) fall into this category. Meanwhile, the 15 to 24 years age bracket for the primary householder has the lowest median household income of $0, with 23 households (2.4%) in this group.
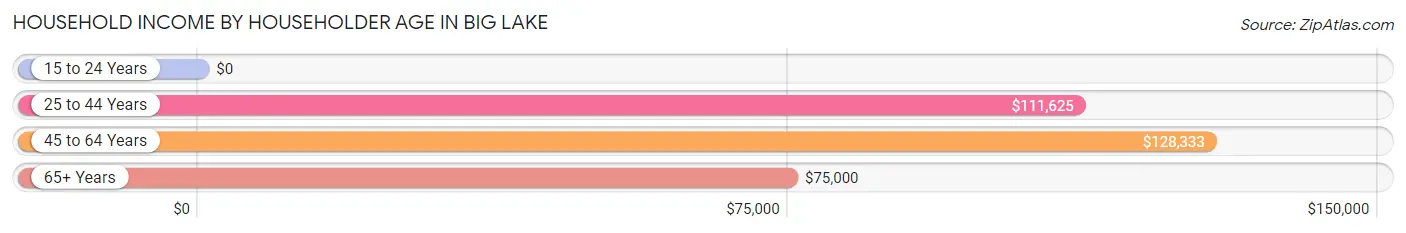
| Income Bracket | # Households | Median Income |
| 15 to 24 Years | 23 (2.4%) | $0 |
| 25 to 44 Years | 189 (19.9%) | $111,625 |
| 45 to 64 Years | 376 (39.6%) | $128,333 |
| 65+ Years | 362 (38.1%) | $75,000 |
| Total | 950 (100.0%) | $108,654 |
Poverty in Big Lake
Income Below Poverty by Sex and Age in Big Lake
With 1.0% poverty level for males and 9.1% for females among the residents of Big Lake, 55 to 64 year old males and 18 to 24 year old females are the most vulnerable to poverty, with 8 males (5.5%) and 13 females (30.9%) in their respective age groups living below the poverty level.
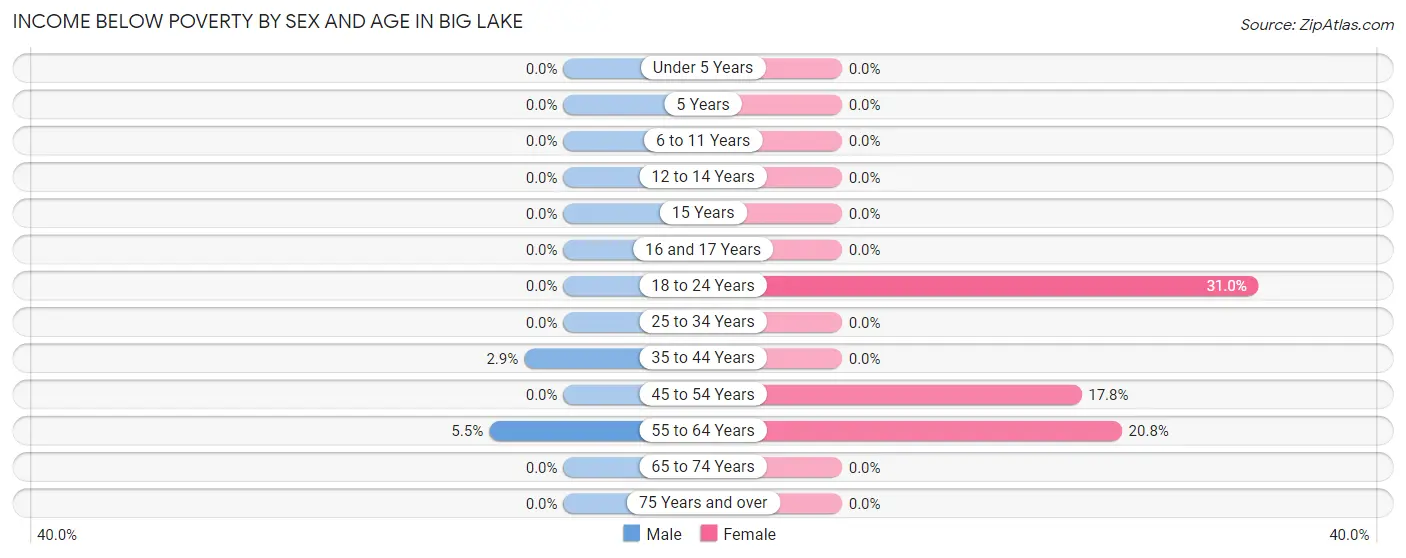
| Age Bracket | Male | Female |
| Under 5 Years | 0 (0.0%) | 0 (0.0%) |
| 5 Years | 0 (0.0%) | 0 (0.0%) |
| 6 to 11 Years | 0 (0.0%) | 0 (0.0%) |
| 12 to 14 Years | 0 (0.0%) | 0 (0.0%) |
| 15 Years | 0 (0.0%) | 0 (0.0%) |
| 16 and 17 Years | 0 (0.0%) | 0 (0.0%) |
| 18 to 24 Years | 0 (0.0%) | 13 (30.9%) |
| 25 to 34 Years | 0 (0.0%) | 0 (0.0%) |
| 35 to 44 Years | 4 (2.9%) | 0 (0.0%) |
| 45 to 54 Years | 0 (0.0%) | 24 (17.8%) |
| 55 to 64 Years | 8 (5.5%) | 64 (20.8%) |
| 65 to 74 Years | 0 (0.0%) | 0 (0.0%) |
| 75 Years and over | 0 (0.0%) | 0 (0.0%) |
| Total | 12 (1.0%) | 101 (9.1%) |
Income Above Poverty by Sex and Age in Big Lake
According to the poverty statistics in Big Lake, males aged under 5 years and females aged under 5 years are the age groups that are most secure financially, with 100.0% of males and 100.0% of females in these age groups living above the poverty line.
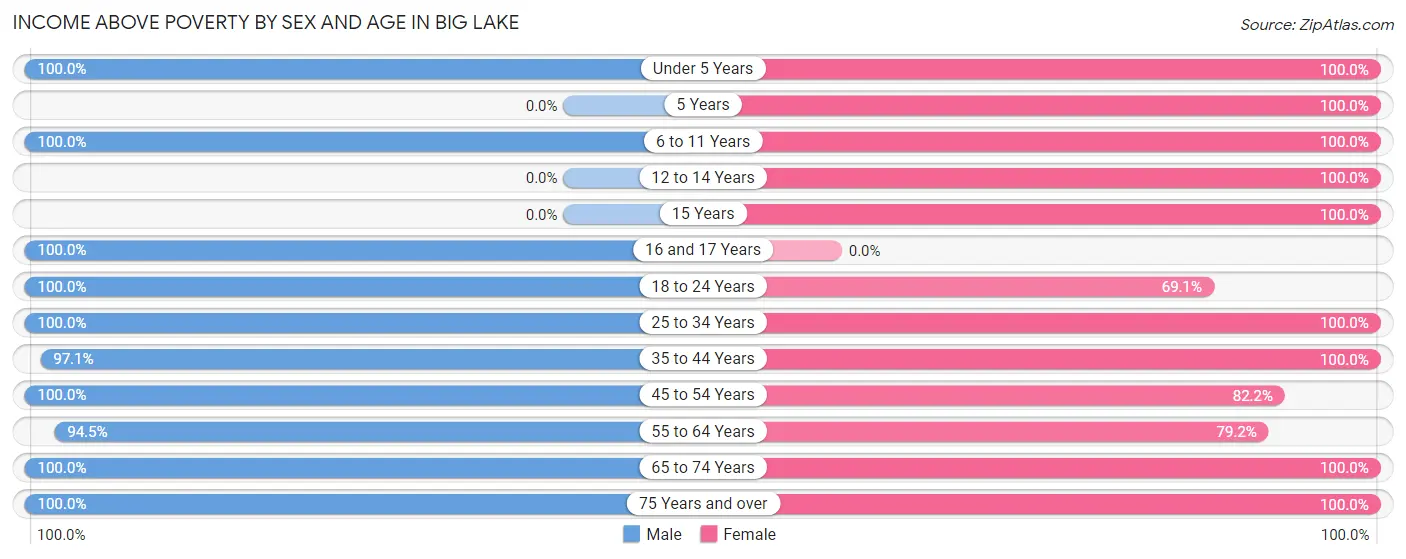
| Age Bracket | Male | Female |
| Under 5 Years | 71 (100.0%) | 30 (100.0%) |
| 5 Years | 0 (0.0%) | 30 (100.0%) |
| 6 to 11 Years | 157 (100.0%) | 31 (100.0%) |
| 12 to 14 Years | 0 (0.0%) | 46 (100.0%) |
| 15 Years | 0 (0.0%) | 20 (100.0%) |
| 16 and 17 Years | 17 (100.0%) | 0 (0.0%) |
| 18 to 24 Years | 10 (100.0%) | 29 (69.1%) |
| 25 to 34 Years | 169 (100.0%) | 69 (100.0%) |
| 35 to 44 Years | 133 (97.1%) | 119 (100.0%) |
| 45 to 54 Years | 58 (100.0%) | 111 (82.2%) |
| 55 to 64 Years | 137 (94.5%) | 244 (79.2%) |
| 65 to 74 Years | 283 (100.0%) | 180 (100.0%) |
| 75 Years and over | 107 (100.0%) | 103 (100.0%) |
| Total | 1,142 (99.0%) | 1,012 (90.9%) |
Income Below Poverty Among Married-Couple Families in Big Lake
The poverty statistics for married-couple families in Big Lake show that 1.3% or 8 of the total 628 families live below the poverty line. Families with no children have the highest poverty rate of 1.9%, comprising of 8 families. On the other hand, families with 1 or 2 children have the lowest poverty rate of 0.0%, which includes 0 families.
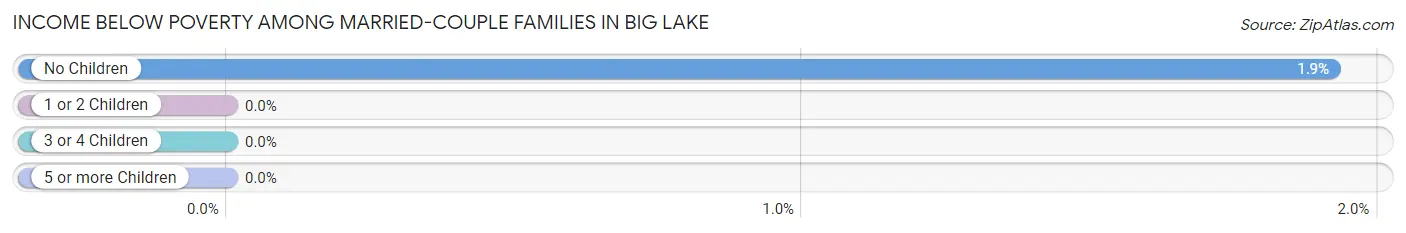
| Children | Above Poverty | Below Poverty |
| No Children | 408 (98.1%) | 8 (1.9%) |
| 1 or 2 Children | 128 (100.0%) | 0 (0.0%) |
| 3 or 4 Children | 84 (100.0%) | 0 (0.0%) |
| 5 or more Children | 0 (0.0%) | 0 (0.0%) |
| Total | 620 (98.7%) | 8 (1.3%) |
Income Below Poverty Among Single-Parent Households in Big Lake
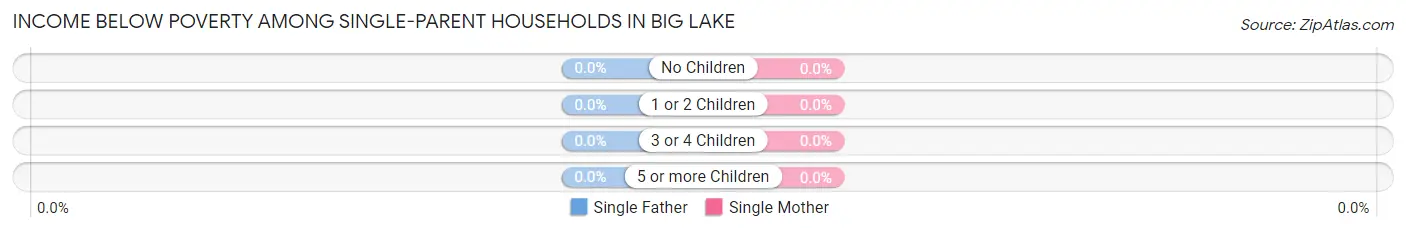
| Children | Single Father | Single Mother |
| No Children | 0 (0.0%) | 0 (0.0%) |
| 1 or 2 Children | 0 (0.0%) | 0 (0.0%) |
| 3 or 4 Children | 0 (0.0%) | 0 (0.0%) |
| 5 or more Children | 0 (0.0%) | 0 (0.0%) |
| Total | 0 (0.0%) | 0 (0.0%) |
Income Below Poverty Among Married-Couple vs Single-Parent Households in Big Lake
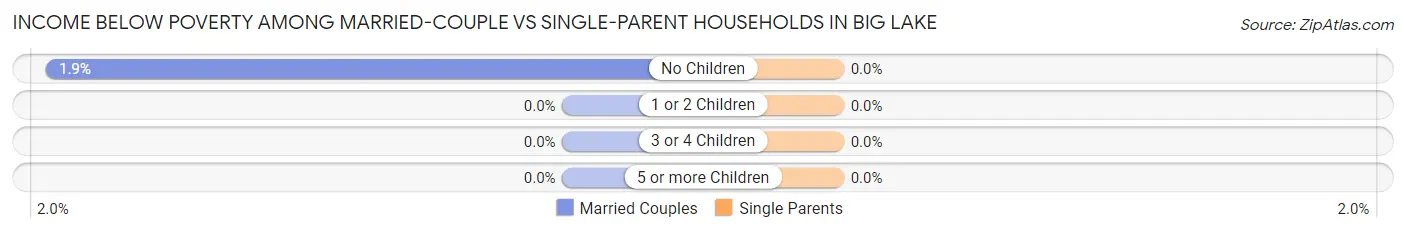
| Children | Married-Couple Families | Single-Parent Households |
| No Children | 8 (1.9%) | 0 (0.0%) |
| 1 or 2 Children | 0 (0.0%) | 0 (0.0%) |
| 3 or 4 Children | 0 (0.0%) | 0 (0.0%) |
| 5 or more Children | 0 (0.0%) | 0 (0.0%) |
| Total | 8 (1.3%) | 0 (0.0%) |
Race in Big Lake
The most populous races in Big Lake are White / Caucasian (2,062 | 91.0%), Two or more Races (84 | 3.7%), and Asian (72 | 3.2%).
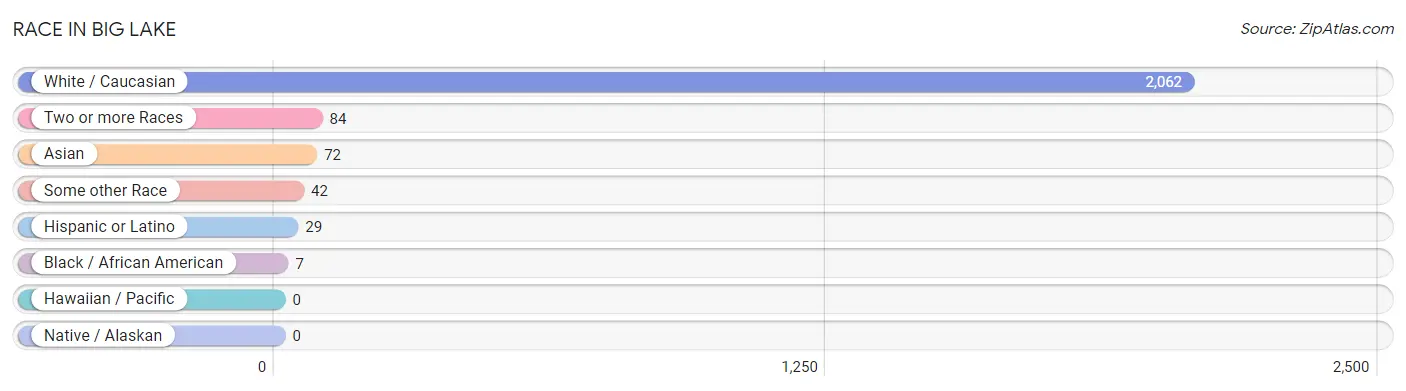
| Race | # Population | % Population |
| Asian | 72 | 3.2% |
| Black / African American | 7 | 0.3% |
| Hawaiian / Pacific | 0 | 0.0% |
| Hispanic or Latino | 29 | 1.3% |
| Native / Alaskan | 0 | 0.0% |
| White / Caucasian | 2,062 | 91.0% |
| Two or more Races | 84 | 3.7% |
| Some other Race | 42 | 1.8% |
| Total | 2,267 | 100.0% |
Ancestry in Big Lake
The most populous ancestries reported in Big Lake are English (459 | 20.3%), German (341 | 15.0%), American (241 | 10.6%), Irish (226 | 10.0%), and Arab (159 | 7.0%), together accounting for 62.9% of all Big Lake residents.
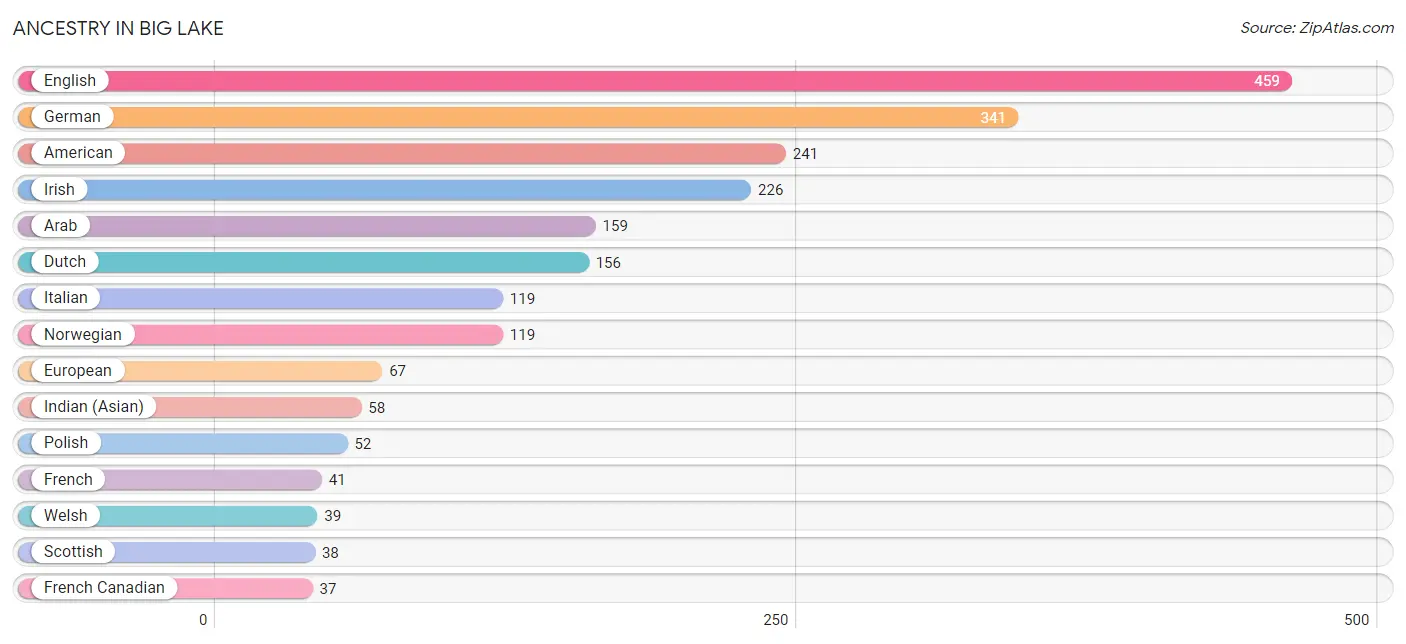
| Ancestry | # Population | % Population |
| American | 241 | 10.6% |
| Arab | 159 | 7.0% |
| Austrian | 6 | 0.3% |
| Bhutanese | 14 | 0.6% |
| British | 6 | 0.3% |
| Burmese | 11 | 0.5% |
| Central American | 10 | 0.4% |
| Croatian | 6 | 0.3% |
| Czech | 20 | 0.9% |
| Danish | 26 | 1.1% |
| Dutch | 156 | 6.9% |
| Eastern European | 21 | 0.9% |
| English | 459 | 20.3% |
| European | 67 | 3.0% |
| Finnish | 8 | 0.4% |
| French | 41 | 1.8% |
| French Canadian | 37 | 1.6% |
| German | 341 | 15.0% |
| Indian (Asian) | 58 | 2.6% |
| Irish | 226 | 10.0% |
| Italian | 119 | 5.2% |
| Korean | 37 | 1.6% |
| Lebanese | 37 | 1.6% |
| Mexican | 12 | 0.5% |
| Nigerian | 4 | 0.2% |
| Northern European | 8 | 0.4% |
| Norwegian | 119 | 5.2% |
| Panamanian | 10 | 0.4% |
| Polish | 52 | 2.3% |
| Portuguese | 12 | 0.5% |
| Scandinavian | 5 | 0.2% |
| Scotch-Irish | 29 | 1.3% |
| Scottish | 38 | 1.7% |
| Spanish | 7 | 0.3% |
| Subsaharan African | 4 | 0.2% |
| Swedish | 37 | 1.6% |
| Swiss | 22 | 1.0% |
| Welsh | 39 | 1.7% |
| Yugoslavian | 13 | 0.6% | View All 39 Rows |
Immigrants in Big Lake
The most numerous immigrant groups reported in Big Lake came from Asia (69 | 3.0%), Brazil (49 | 2.2%), China (49 | 2.2%), Eastern Asia (49 | 2.2%), and Latin America (49 | 2.2%), together accounting for 11.7% of all Big Lake residents.
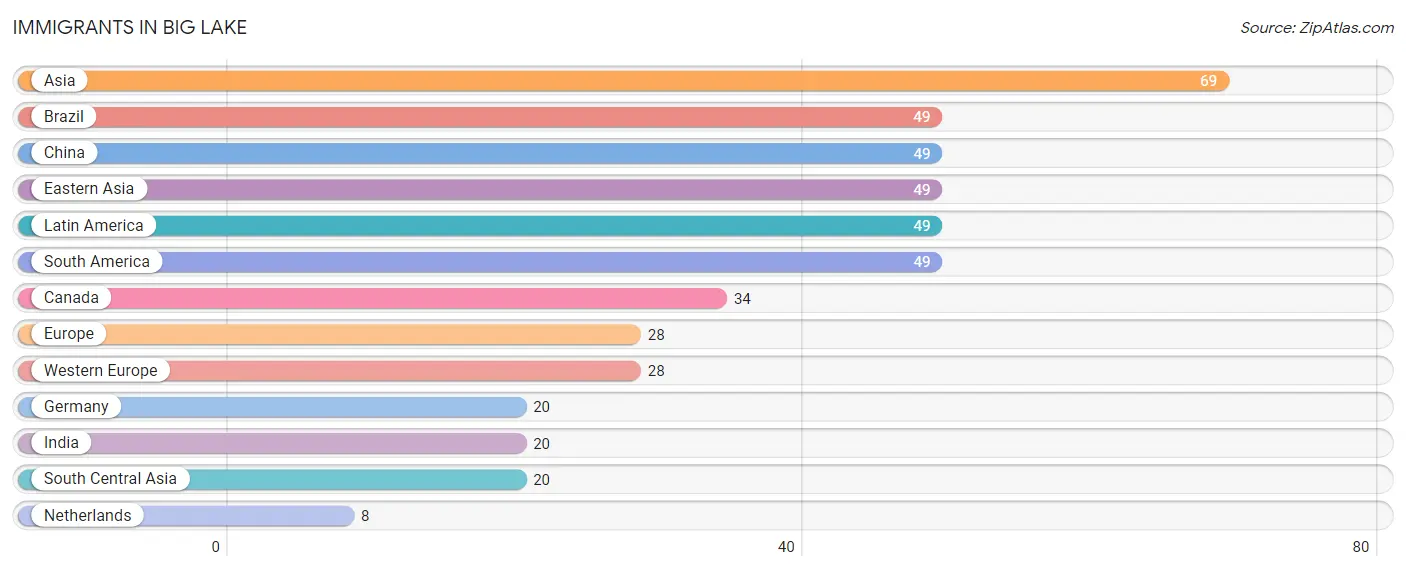
| Immigration Origin | # Population | % Population |
| Asia | 69 | 3.0% |
| Brazil | 49 | 2.2% |
| Canada | 34 | 1.5% |
| China | 49 | 2.2% |
| Eastern Asia | 49 | 2.2% |
| Europe | 28 | 1.2% |
| Germany | 20 | 0.9% |
| India | 20 | 0.9% |
| Latin America | 49 | 2.2% |
| Netherlands | 8 | 0.4% |
| South America | 49 | 2.2% |
| South Central Asia | 20 | 0.9% |
| Western Europe | 28 | 1.2% | View All 13 Rows |
Sex and Age in Big Lake
Sex and Age in Big Lake
The most populous age groups in Big Lake are 65 to 69 Years (182 | 15.8%) for men and 55 to 59 Years (160 | 14.4%) for women.
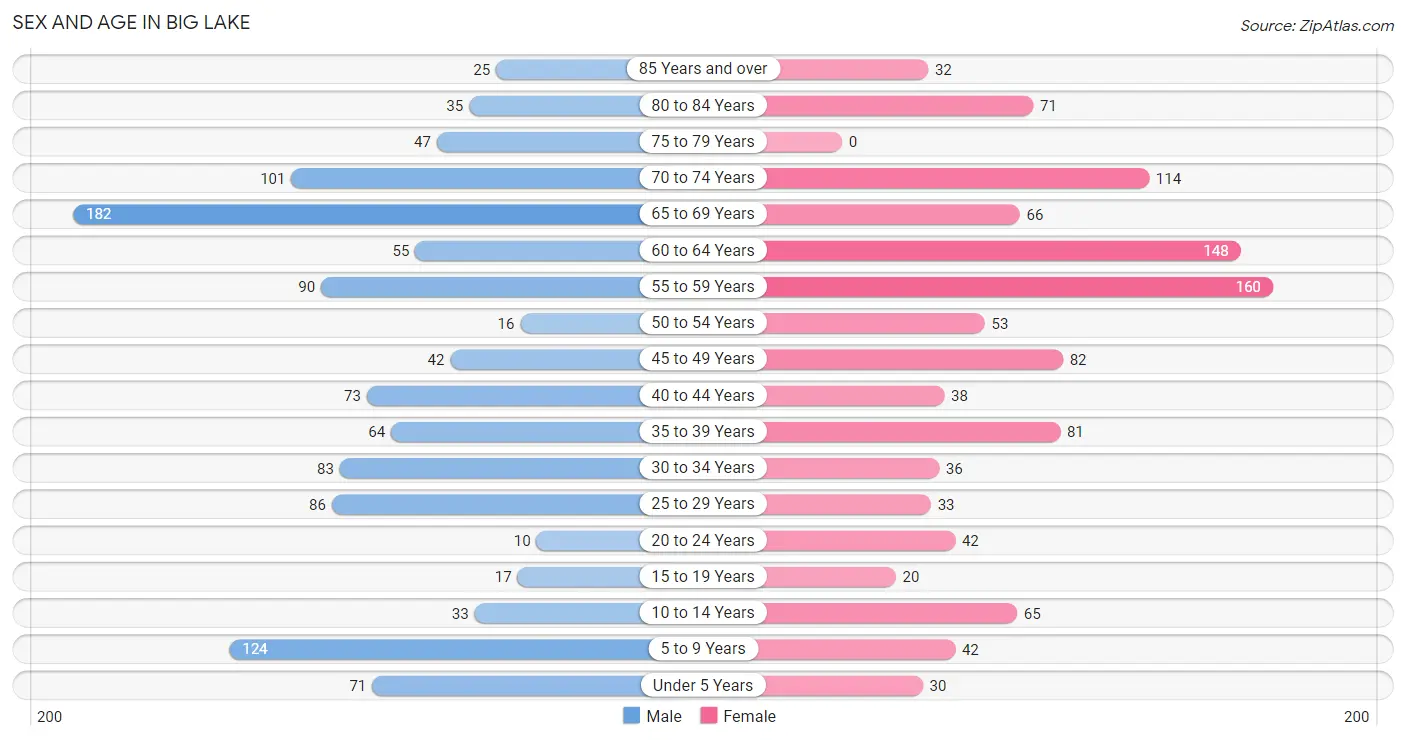
| Age Bracket | Male | Female |
| Under 5 Years | 71 (6.1%) | 30 (2.7%) |
| 5 to 9 Years | 124 (10.7%) | 42 (3.8%) |
| 10 to 14 Years | 33 (2.9%) | 65 (5.8%) |
| 15 to 19 Years | 17 (1.5%) | 20 (1.8%) |
| 20 to 24 Years | 10 (0.9%) | 42 (3.8%) |
| 25 to 29 Years | 86 (7.4%) | 33 (3.0%) |
| 30 to 34 Years | 83 (7.2%) | 36 (3.2%) |
| 35 to 39 Years | 64 (5.6%) | 81 (7.3%) |
| 40 to 44 Years | 73 (6.3%) | 38 (3.4%) |
| 45 to 49 Years | 42 (3.6%) | 82 (7.4%) |
| 50 to 54 Years | 16 (1.4%) | 53 (4.8%) |
| 55 to 59 Years | 90 (7.8%) | 160 (14.4%) |
| 60 to 64 Years | 55 (4.8%) | 148 (13.3%) |
| 65 to 69 Years | 182 (15.8%) | 66 (5.9%) |
| 70 to 74 Years | 101 (8.7%) | 114 (10.2%) |
| 75 to 79 Years | 47 (4.1%) | 0 (0.0%) |
| 80 to 84 Years | 35 (3.0%) | 71 (6.4%) |
| 85 Years and over | 25 (2.2%) | 32 (2.9%) |
| Total | 1,154 (100.0%) | 1,113 (100.0%) |
Families and Households in Big Lake
Median Family Size in Big Lake
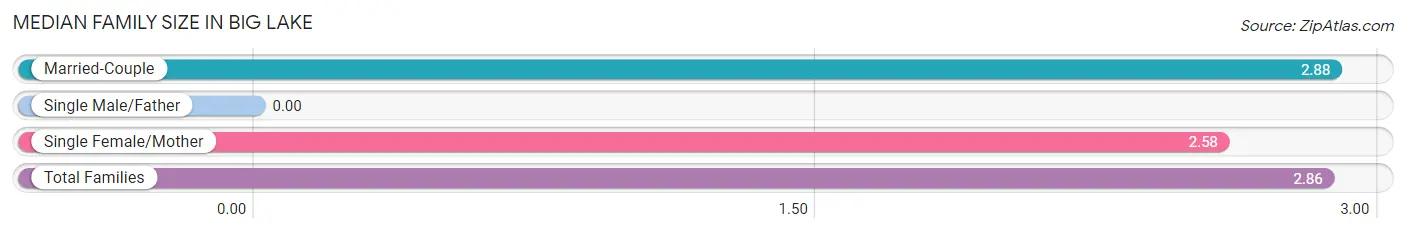
| Family Type | # Families | Family Size |
| Married-Couple | 628 (92.6%) | 2.88 |
| Single Male/Father | 0 (0.0%) | - |
| Single Female/Mother | 50 (7.4%) | 2.58 |
| Total Families | 678 (100.0%) | 2.86 |
Median Household Size in Big Lake
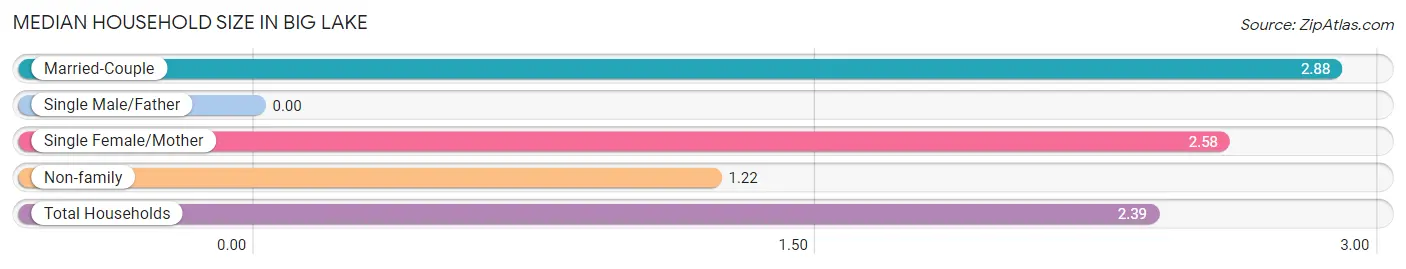
| Household Type | # Households | Household Size |
| Married-Couple | 628 (66.1%) | 2.88 |
| Single Male/Father | 0 (0.0%) | - |
| Single Female/Mother | 50 (5.3%) | 2.58 |
| Non-family | 272 (28.6%) | 1.22 |
| Total Households | 950 (100.0%) | 2.39 |
Household Size by Marriage Status in Big Lake
Out of a total of 950 households in Big Lake, 678 (71.4%) are family households, while 272 (28.6%) are nonfamily households. The most numerous type of family households are 2-person households, comprising 348, and the most common type of nonfamily households are 1-person households, comprising 222.
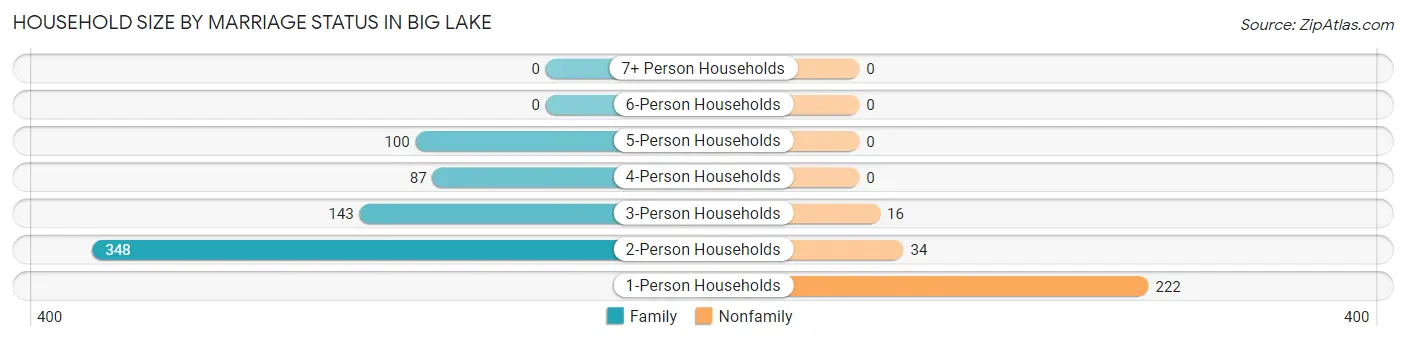
| Household Size | Family Households | Nonfamily Households |
| 1-Person Households | - | 222 (23.4%) |
| 2-Person Households | 348 (36.6%) | 34 (3.6%) |
| 3-Person Households | 143 (15.0%) | 16 (1.7%) |
| 4-Person Households | 87 (9.2%) | 0 (0.0%) |
| 5-Person Households | 100 (10.5%) | 0 (0.0%) |
| 6-Person Households | 0 (0.0%) | 0 (0.0%) |
| 7+ Person Households | 0 (0.0%) | 0 (0.0%) |
| Total | 678 (71.4%) | 272 (28.6%) |
Female Fertility in Big Lake
Fertility by Age in Big Lake
Average fertility rate in Big Lake is 90.0 births per 1,000 women. Women in the age bracket of 35 to 50 years have the highest fertility rate with 149.0 births per 1,000 women. Women in the age bracket of 35 to 50 years acount for 100.0% of all women with births.
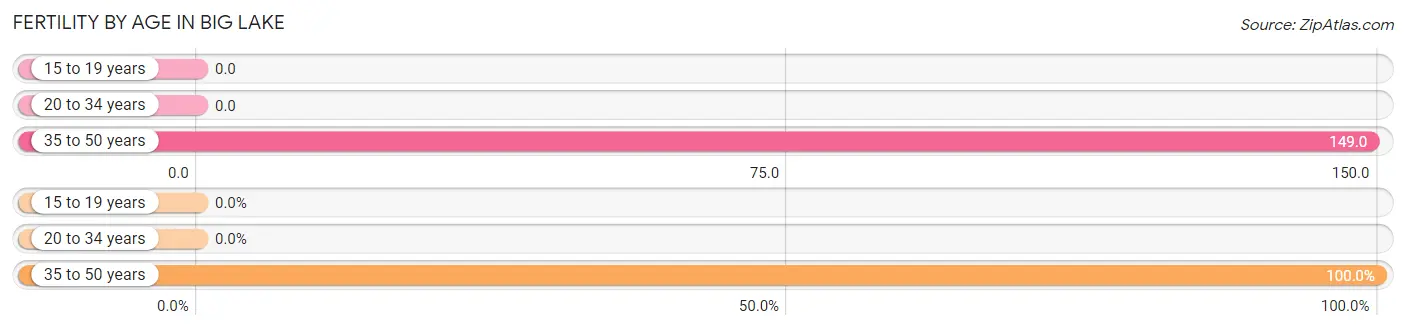
| Age Bracket | Women with Births | Births / 1,000 Women |
| 15 to 19 years | 0 (0.0%) | 0.0 |
| 20 to 34 years | 0 (0.0%) | 0.0 |
| 35 to 50 years | 30 (100.0%) | 149.0 |
| Total | 30 (100.0%) | 90.0 |
Fertility by Age by Marriage Status in Big Lake
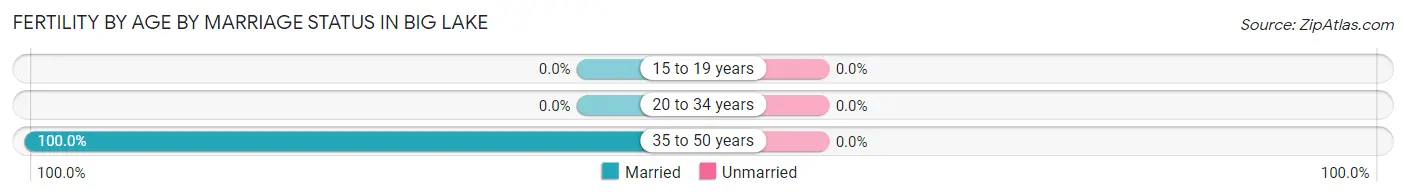
| Age Bracket | Married | Unmarried |
| 15 to 19 years | 0 (0.0%) | 0 (0.0%) |
| 20 to 34 years | 0 (0.0%) | 0 (0.0%) |
| 35 to 50 years | 30 (100.0%) | 0 (0.0%) |
| Total | 30 (100.0%) | 0 (0.0%) |
Fertility by Education in Big Lake
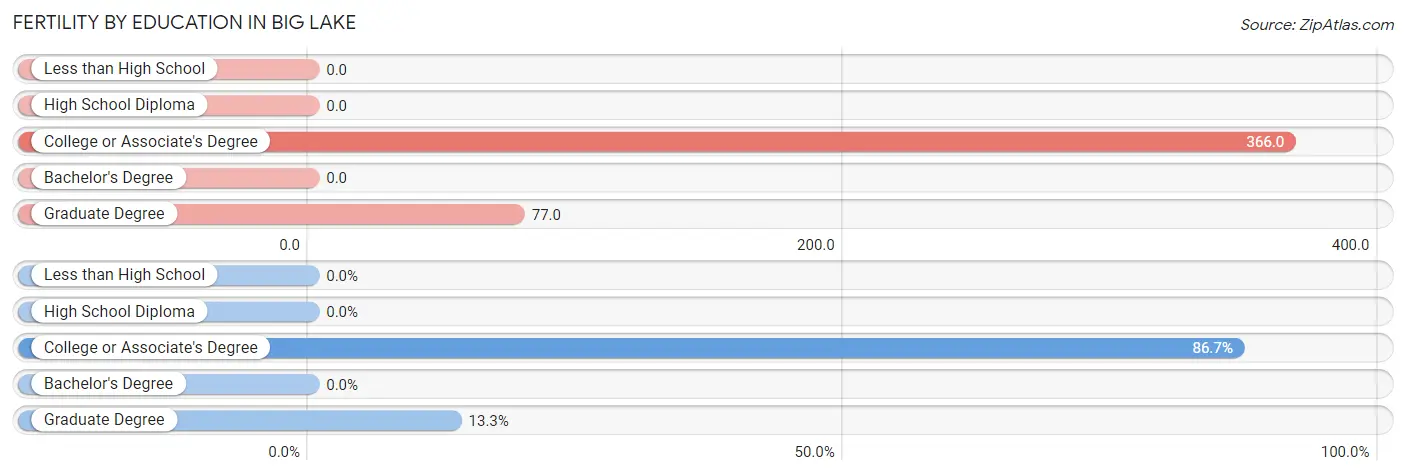
| Educational Attainment | Women with Births | Births / 1,000 Women |
| Less than High School | 0 (0.0%) | 0.0 |
| High School Diploma | 0 (0.0%) | 0.0 |
| College or Associate's Degree | 26 (86.7%) | 366.0 |
| Bachelor's Degree | 0 (0.0%) | 0.0 |
| Graduate Degree | 4 (13.3%) | 77.0 |
| Total | 30 (100.0%) | 90.0 |
Fertility by Education by Marriage Status in Big Lake
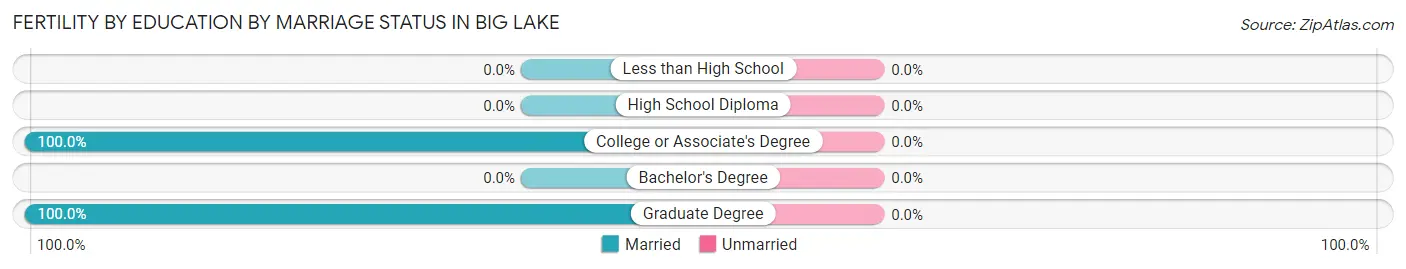
| Educational Attainment | Married | Unmarried |
| Less than High School | 0 (0.0%) | 0 (0.0%) |
| High School Diploma | 0 (0.0%) | 0 (0.0%) |
| College or Associate's Degree | 26 (100.0%) | 0 (0.0%) |
| Bachelor's Degree | 0 (0.0%) | 0 (0.0%) |
| Graduate Degree | 4 (100.0%) | 0 (0.0%) |
| Total | 30 (100.0%) | 0 (0.0%) |
Employment Characteristics in Big Lake
Employment by Class of Employer in Big Lake
Among the 852 employed individuals in Big Lake, private company employees (550 | 64.5%), local government employees (109 | 12.8%), and self-employed (incorporated) (56 | 6.6%) make up the most common classes of employment.
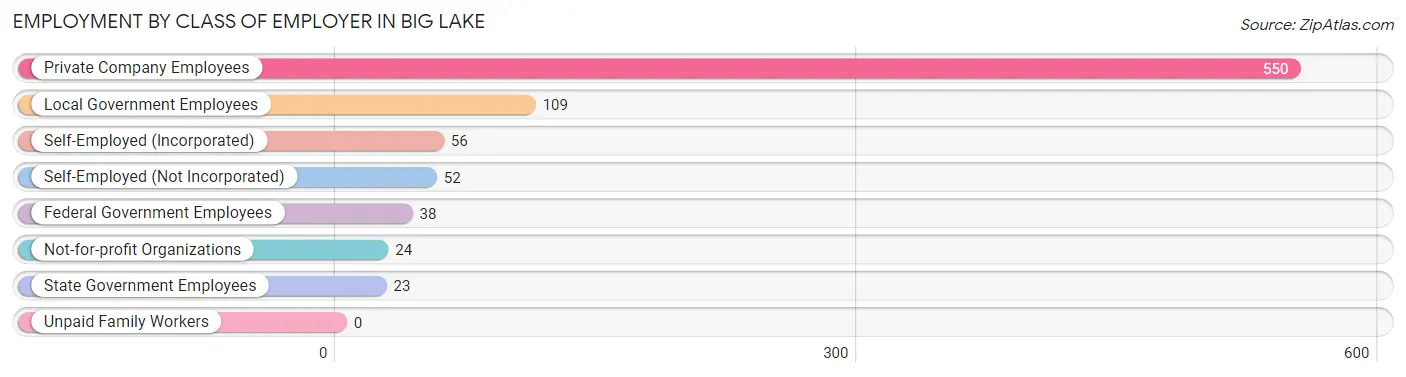
| Employer Class | # Employees | % Employees |
| Private Company Employees | 550 | 64.5% |
| Self-Employed (Incorporated) | 56 | 6.6% |
| Self-Employed (Not Incorporated) | 52 | 6.1% |
| Not-for-profit Organizations | 24 | 2.8% |
| Local Government Employees | 109 | 12.8% |
| State Government Employees | 23 | 2.7% |
| Federal Government Employees | 38 | 4.5% |
| Unpaid Family Workers | 0 | 0.0% |
| Total | 852 | 100.0% |
Employment Status by Age in Big Lake
According to the labor force statistics for Big Lake, out of the total population over 16 years of age (1,882), 47.6% or 896 individuals are in the labor force, with 2.1% or 19 of them unemployed. The age group with the highest labor force participation rate is 16 to 19 years, with 100.0% or 17 individuals in the labor force. Within the labor force, the 45 to 54 years age range has the highest percentage of unemployed individuals, with 13.3% or 18 of them being unemployed.
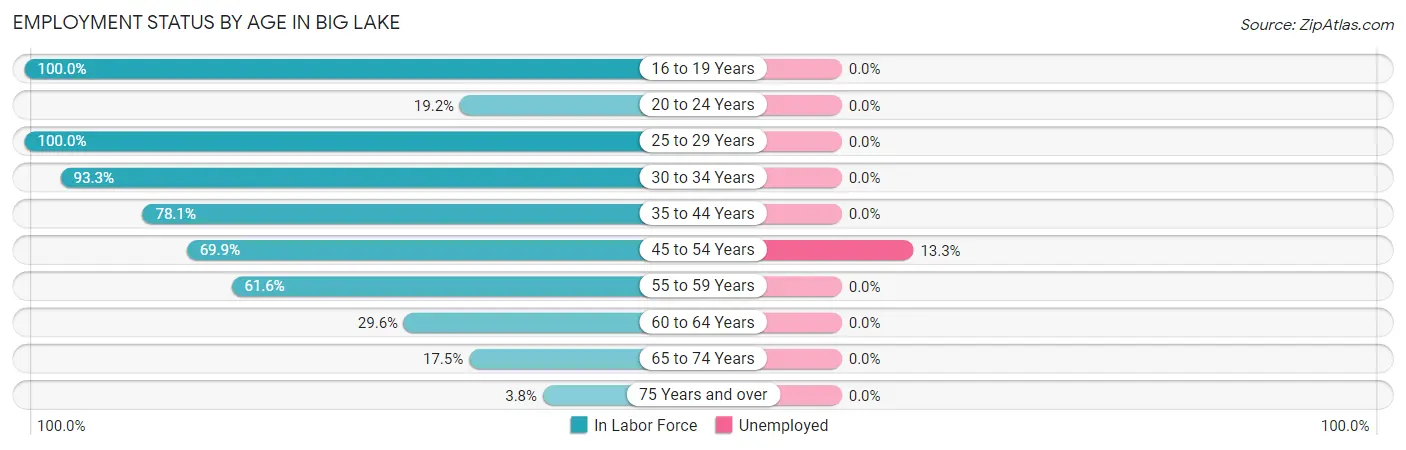
| Age Bracket | In Labor Force | Unemployed |
| 16 to 19 Years | 17 (100.0%) | 0 (0.0%) |
| 20 to 24 Years | 10 (19.2%) | 0 (0.0%) |
| 25 to 29 Years | 119 (100.0%) | 0 (0.0%) |
| 30 to 34 Years | 111 (93.3%) | 0 (0.0%) |
| 35 to 44 Years | 200 (78.1%) | 0 (0.0%) |
| 45 to 54 Years | 135 (69.9%) | 18 (13.3%) |
| 55 to 59 Years | 154 (61.6%) | 0 (0.0%) |
| 60 to 64 Years | 60 (29.6%) | 0 (0.0%) |
| 65 to 74 Years | 81 (17.5%) | 0 (0.0%) |
| 75 Years and over | 8 (3.8%) | 0 (0.0%) |
| Total | 896 (47.6%) | 19 (2.1%) |
Employment Status by Educational Attainment in Big Lake
According to labor force statistics for Big Lake, 68.3% of individuals (779) out of the total population between 25 and 64 years of age (1,140) are in the labor force, with 2.4% or 19 of them being unemployed. The group with the highest labor force participation rate are those with the educational attainment of less than high school, with 77.3% or 17 individuals in the labor force. Within the labor force, individuals with college / associate degree education have the highest percentage of unemployment, with 5.7% or 20 of them being unemployed.
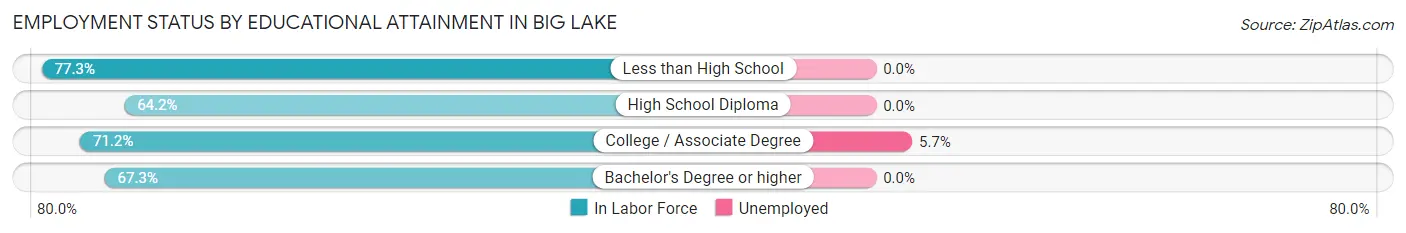
| Educational Attainment | In Labor Force | Unemployed |
| Less than High School | 17 (77.3%) | 0 (0.0%) |
| High School Diploma | 197 (64.2%) | 0 (0.0%) |
| College / Associate Degree | 353 (71.2%) | 28 (5.7%) |
| Bachelor's Degree or higher | 212 (67.3%) | 0 (0.0%) |
| Total | 779 (68.3%) | 27 (2.4%) |
Employment Occupations by Sex in Big Lake
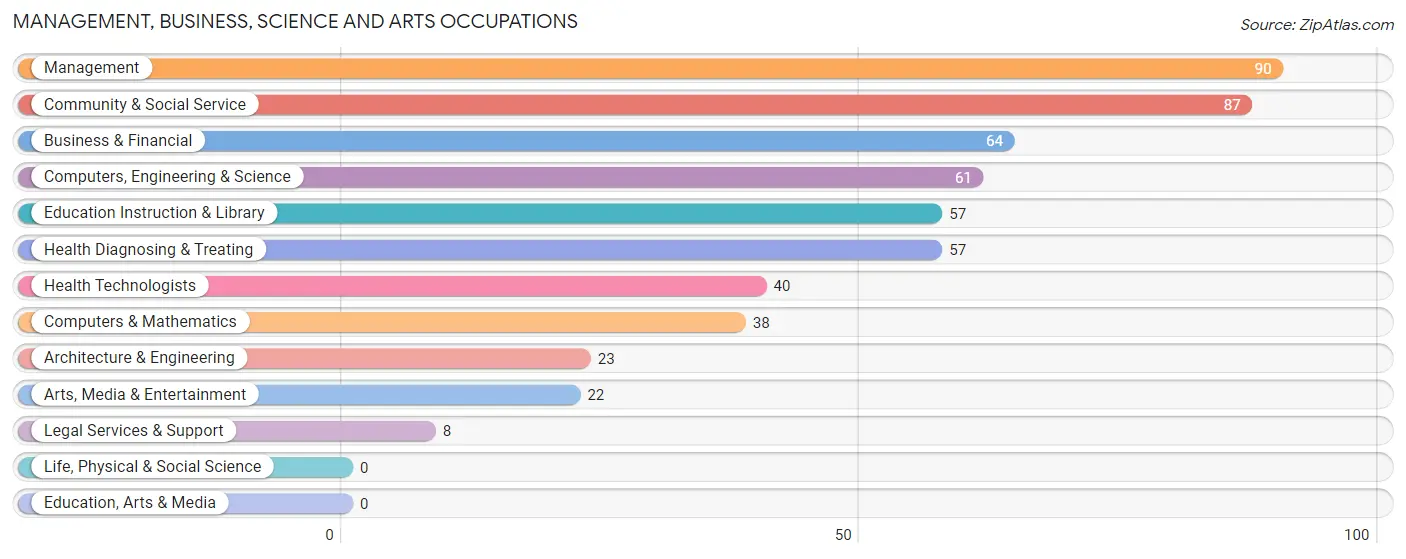
Management, Business, Science and Arts Occupations
The most common Management, Business, Science and Arts occupations in Big Lake are Management (90 | 10.7%), Community & Social Service (87 | 10.4%), Business & Financial (64 | 7.6%), Computers, Engineering & Science (61 | 7.3%), and Education Instruction & Library (57 | 6.8%).
Management, Business, Science and Arts Occupations by Sex
Within the Management, Business, Science and Arts occupations in Big Lake, the most male-oriented occupations are Computers, Engineering & Science (100.0%), Computers & Mathematics (100.0%), and Architecture & Engineering (100.0%), while the most female-oriented occupations are Arts, Media & Entertainment (100.0%), Health Diagnosing & Treating (100.0%), and Health Technologists (100.0%).
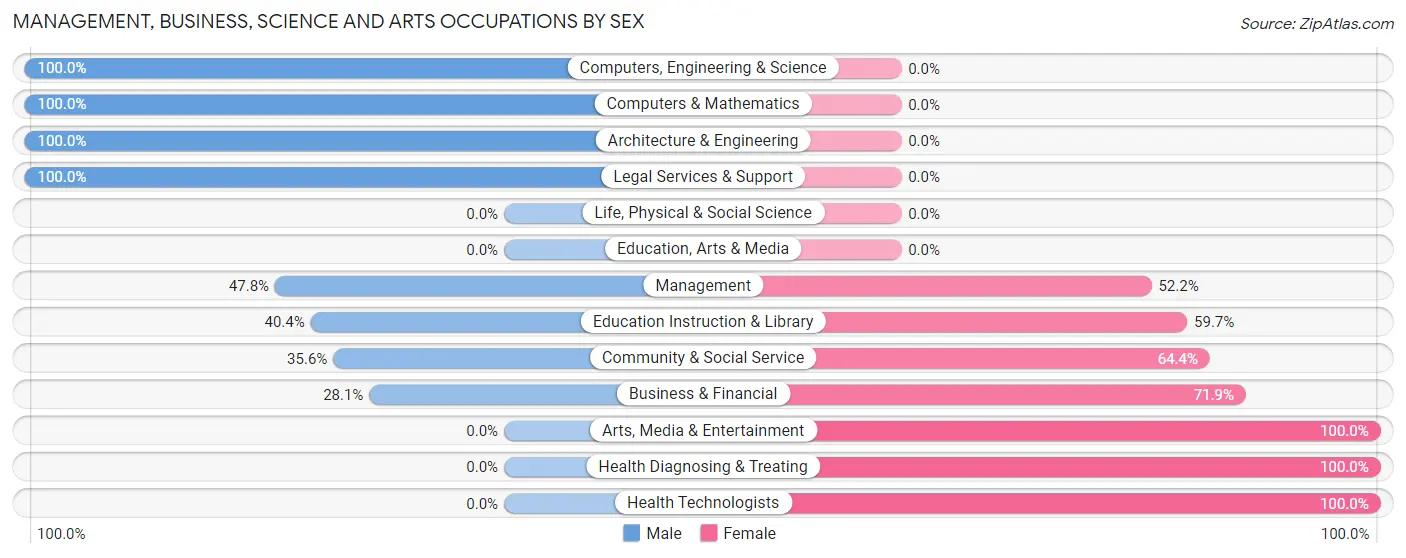
| Occupation | Male | Female |
| Management | 43 (47.8%) | 47 (52.2%) |
| Business & Financial | 18 (28.1%) | 46 (71.9%) |
| Computers, Engineering & Science | 61 (100.0%) | 0 (0.0%) |
| Computers & Mathematics | 38 (100.0%) | 0 (0.0%) |
| Architecture & Engineering | 23 (100.0%) | 0 (0.0%) |
| Life, Physical & Social Science | 0 (0.0%) | 0 (0.0%) |
| Community & Social Service | 31 (35.6%) | 56 (64.4%) |
| Education, Arts & Media | 0 (0.0%) | 0 (0.0%) |
| Legal Services & Support | 8 (100.0%) | 0 (0.0%) |
| Education Instruction & Library | 23 (40.4%) | 34 (59.7%) |
| Arts, Media & Entertainment | 0 (0.0%) | 22 (100.0%) |
| Health Diagnosing & Treating | 0 (0.0%) | 57 (100.0%) |
| Health Technologists | 0 (0.0%) | 40 (100.0%) |
| Total (Category) | 153 (42.6%) | 206 (57.4%) |
| Total (Overall) | 482 (57.5%) | 357 (42.5%) |
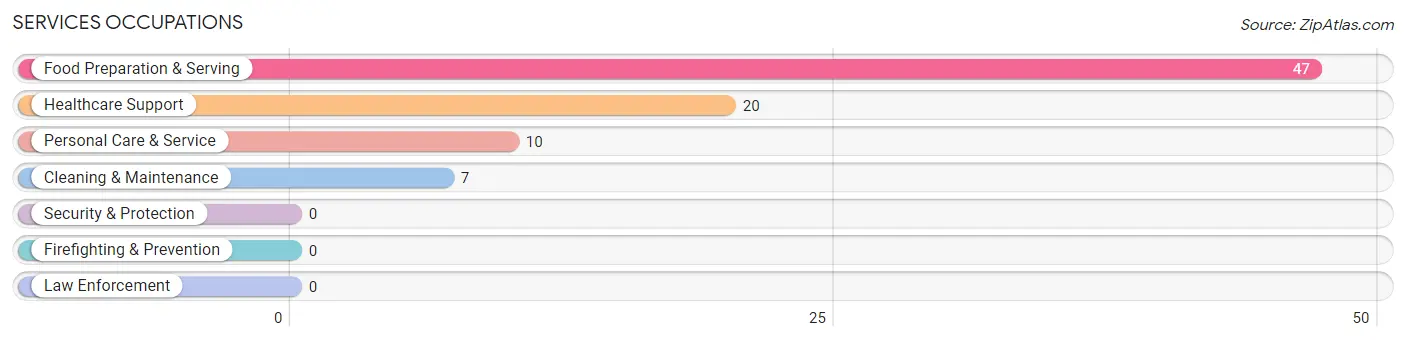
Services Occupations
The most common Services occupations in Big Lake are Food Preparation & Serving (47 | 5.6%), Healthcare Support (20 | 2.4%), Personal Care & Service (10 | 1.2%), and Cleaning & Maintenance (7 | 0.8%).
Services Occupations by Sex
Within the Services occupations in Big Lake, the most male-oriented occupations are Cleaning & Maintenance (100.0%), Food Preparation & Serving (83.0%), and Healthcare Support (50.0%), while the most female-oriented occupations are Personal Care & Service (100.0%), Healthcare Support (50.0%), and Food Preparation & Serving (17.0%).
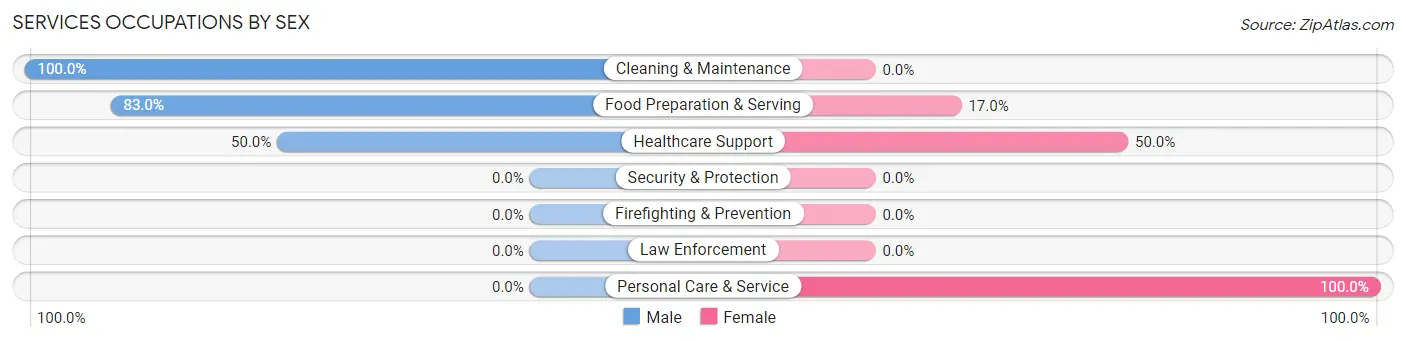
| Occupation | Male | Female |
| Healthcare Support | 10 (50.0%) | 10 (50.0%) |
| Security & Protection | 0 (0.0%) | 0 (0.0%) |
| Firefighting & Prevention | 0 (0.0%) | 0 (0.0%) |
| Law Enforcement | 0 (0.0%) | 0 (0.0%) |
| Food Preparation & Serving | 39 (83.0%) | 8 (17.0%) |
| Cleaning & Maintenance | 7 (100.0%) | 0 (0.0%) |
| Personal Care & Service | 0 (0.0%) | 10 (100.0%) |
| Total (Category) | 56 (66.7%) | 28 (33.3%) |
| Total (Overall) | 482 (57.5%) | 357 (42.5%) |
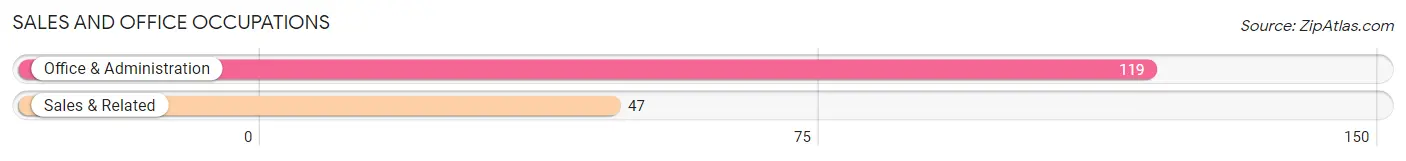
Sales and Office Occupations
The most common Sales and Office occupations in Big Lake are Office & Administration (119 | 14.2%), and Sales & Related (47 | 5.6%).
Sales and Office Occupations by Sex
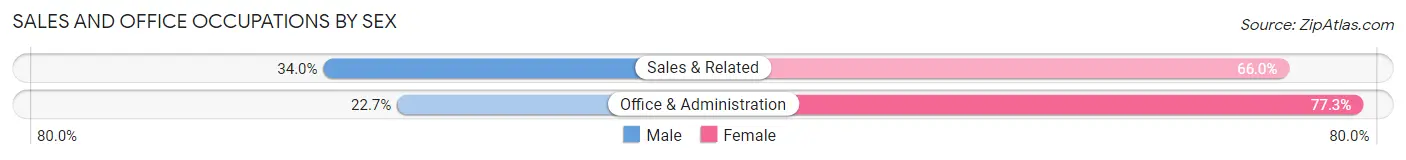
| Occupation | Male | Female |
| Sales & Related | 16 (34.0%) | 31 (66.0%) |
| Office & Administration | 27 (22.7%) | 92 (77.3%) |
| Total (Category) | 43 (25.9%) | 123 (74.1%) |
| Total (Overall) | 482 (57.5%) | 357 (42.5%) |
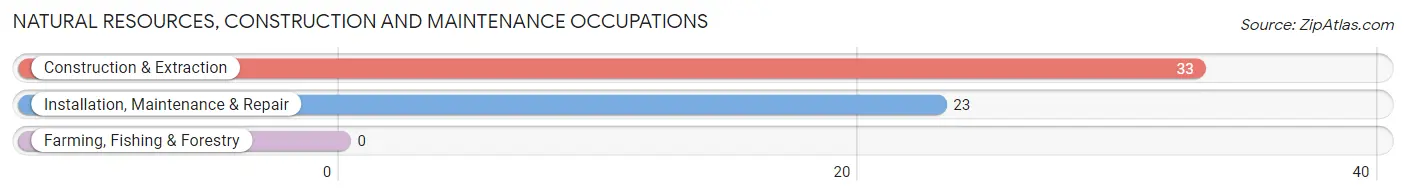
Natural Resources, Construction and Maintenance Occupations
The most common Natural Resources, Construction and Maintenance occupations in Big Lake are Construction & Extraction (33 | 3.9%), and Installation, Maintenance & Repair (23 | 2.7%).
Natural Resources, Construction and Maintenance Occupations by Sex
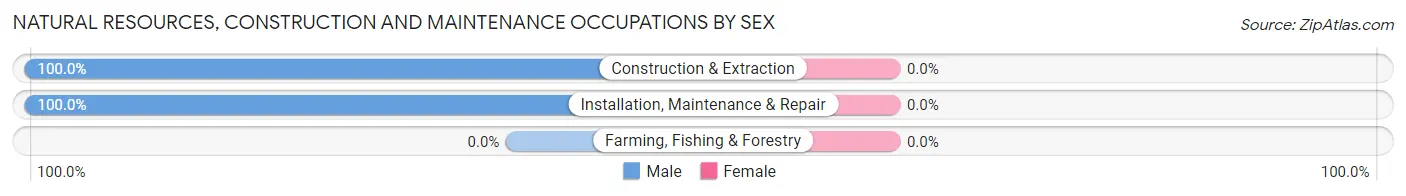
| Occupation | Male | Female |
| Farming, Fishing & Forestry | 0 (0.0%) | 0 (0.0%) |
| Construction & Extraction | 33 (100.0%) | 0 (0.0%) |
| Installation, Maintenance & Repair | 23 (100.0%) | 0 (0.0%) |
| Total (Category) | 56 (100.0%) | 0 (0.0%) |
| Total (Overall) | 482 (57.5%) | 357 (42.5%) |
Production, Transportation and Moving Occupations
The most common Production, Transportation and Moving occupations in Big Lake are Production (90 | 10.7%), Transportation (48 | 5.7%), and Material Moving (36 | 4.3%).
Production, Transportation and Moving Occupations by Sex
| Occupation | Male | Female |
| Production | 90 (100.0%) | 0 (0.0%) |
| Transportation | 48 (100.0%) | 0 (0.0%) |
| Material Moving | 36 (100.0%) | 0 (0.0%) |
| Total (Category) | 174 (100.0%) | 0 (0.0%) |
| Total (Overall) | 482 (57.5%) | 357 (42.5%) |
Employment Industries by Sex in Big Lake
Employment Industries in Big Lake
The major employment industries in Big Lake include Health Care & Social Assistance (208 | 24.8%), Manufacturing (140 | 16.7%), Professional & Scientific (72 | 8.6%), Accommodation & Food Services (68 | 8.1%), and Construction (63 | 7.5%).
Employment Industries by Sex in Big Lake
The Big Lake industries that see more men than women are Mining, Quarrying, & Extraction (100.0%), Information (100.0%), and Administrative & Support (100.0%), whereas the industries that tend to have a higher number of women are Real Estate, Rental & Leasing (100.0%), Health Care & Social Assistance (78.4%), and Educational Services (59.7%).
| Industry | Male | Female |
| Agriculture, Fishing & Hunting | 26 (76.5%) | 8 (23.5%) |
| Mining, Quarrying, & Extraction | 12 (100.0%) | 0 (0.0%) |
| Construction | 48 (76.2%) | 15 (23.8%) |
| Manufacturing | 128 (91.4%) | 12 (8.6%) |
| Wholesale Trade | 21 (70.0%) | 9 (30.0%) |
| Retail Trade | 16 (47.1%) | 18 (52.9%) |
| Transportation & Warehousing | 45 (84.9%) | 8 (15.1%) |
| Utilities | 0 (0.0%) | 0 (0.0%) |
| Information | 20 (100.0%) | 0 (0.0%) |
| Finance & Insurance | 0 (0.0%) | 0 (0.0%) |
| Real Estate, Rental & Leasing | 0 (0.0%) | 31 (100.0%) |
| Professional & Scientific | 31 (43.1%) | 41 (56.9%) |
| Enterprise Management | 0 (0.0%) | 0 (0.0%) |
| Administrative & Support | 7 (100.0%) | 0 (0.0%) |
| Educational Services | 23 (40.4%) | 34 (59.7%) |
| Health Care & Social Assistance | 45 (21.6%) | 163 (78.4%) |
| Arts, Entertainment & Recreation | 0 (0.0%) | 0 (0.0%) |
| Accommodation & Food Services | 60 (88.2%) | 8 (11.8%) |
| Public Administration | 0 (0.0%) | 0 (0.0%) |
| Total | 482 (57.5%) | 357 (42.5%) |
Education in Big Lake
School Enrollment in Big Lake
The most common levels of schooling among the 351 students in Big Lake are elementary school (134 | 38.2%), nursery / preschool (81 | 23.1%), and middle school (71 | 20.2%).
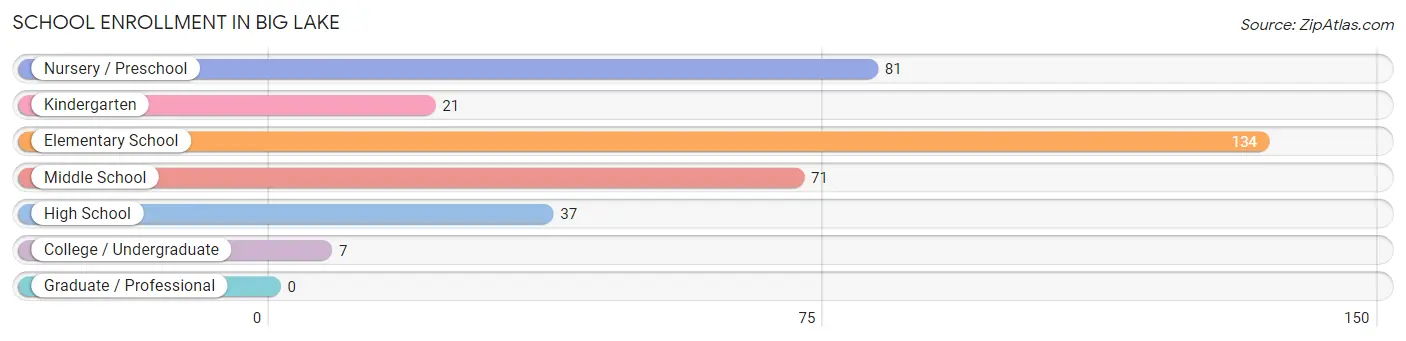
| School Level | # Students | % Students |
| Nursery / Preschool | 81 | 23.1% |
| Kindergarten | 21 | 6.0% |
| Elementary School | 134 | 38.2% |
| Middle School | 71 | 20.2% |
| High School | 37 | 10.5% |
| College / Undergraduate | 7 | 2.0% |
| Graduate / Professional | 0 | 0.0% |
| Total | 351 | 100.0% |
School Enrollment by Age by Funding Source in Big Lake
Out of a total of 351 students who are enrolled in schools in Big Lake, 88 (25.1%) attend a private institution, while the remaining 263 (74.9%) are enrolled in public schools. The age group of 15 to 17 year olds has the highest likelihood of being enrolled in private schools, with 20 (54.0% in the age bracket) enrolled. Conversely, the age group of 3 to 4 year olds has the lowest likelihood of being enrolled in a private school, with 51 (100.0% in the age bracket) attending a public institution.
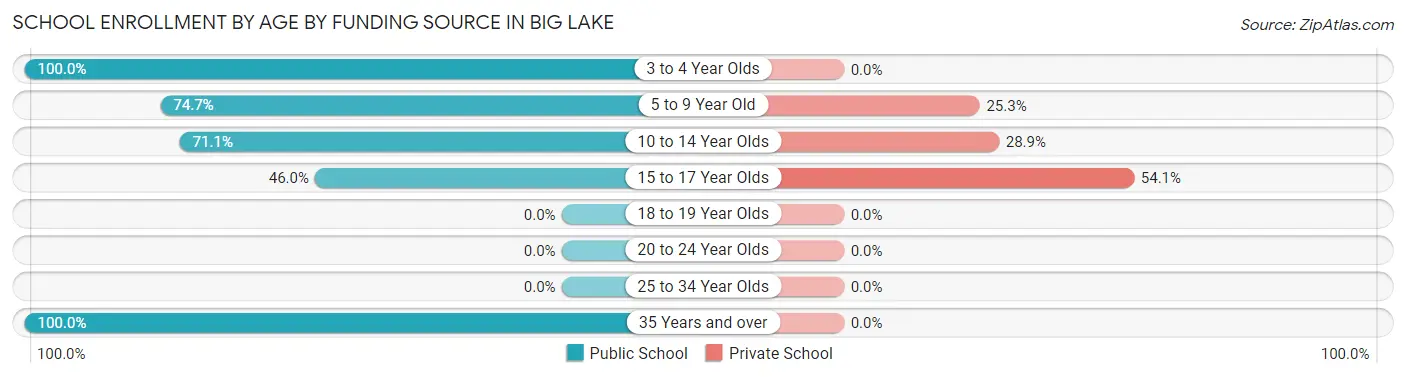
| Age Bracket | Public School | Private School |
| 3 to 4 Year Olds | 51 (100.0%) | 0 (0.0%) |
| 5 to 9 Year Old | 124 (74.7%) | 42 (25.3%) |
| 10 to 14 Year Olds | 64 (71.1%) | 26 (28.9%) |
| 15 to 17 Year Olds | 17 (46.0%) | 20 (54.0%) |
| 18 to 19 Year Olds | 0 (0.0%) | 0 (0.0%) |
| 20 to 24 Year Olds | 0 (0.0%) | 0 (0.0%) |
| 25 to 34 Year Olds | 0 (0.0%) | 0 (0.0%) |
| 35 Years and over | 7 (100.0%) | 0 (0.0%) |
| Total | 263 (74.9%) | 88 (25.1%) |
Educational Attainment by Field of Study in Big Lake
Education (136 | 19.6%), business (116 | 16.7%), social sciences (83 | 12.0%), computers & mathematics (62 | 8.9%), and science & technology (49 | 7.1%) are the most common fields of study among 694 individuals in Big Lake who have obtained a bachelor's degree or higher.
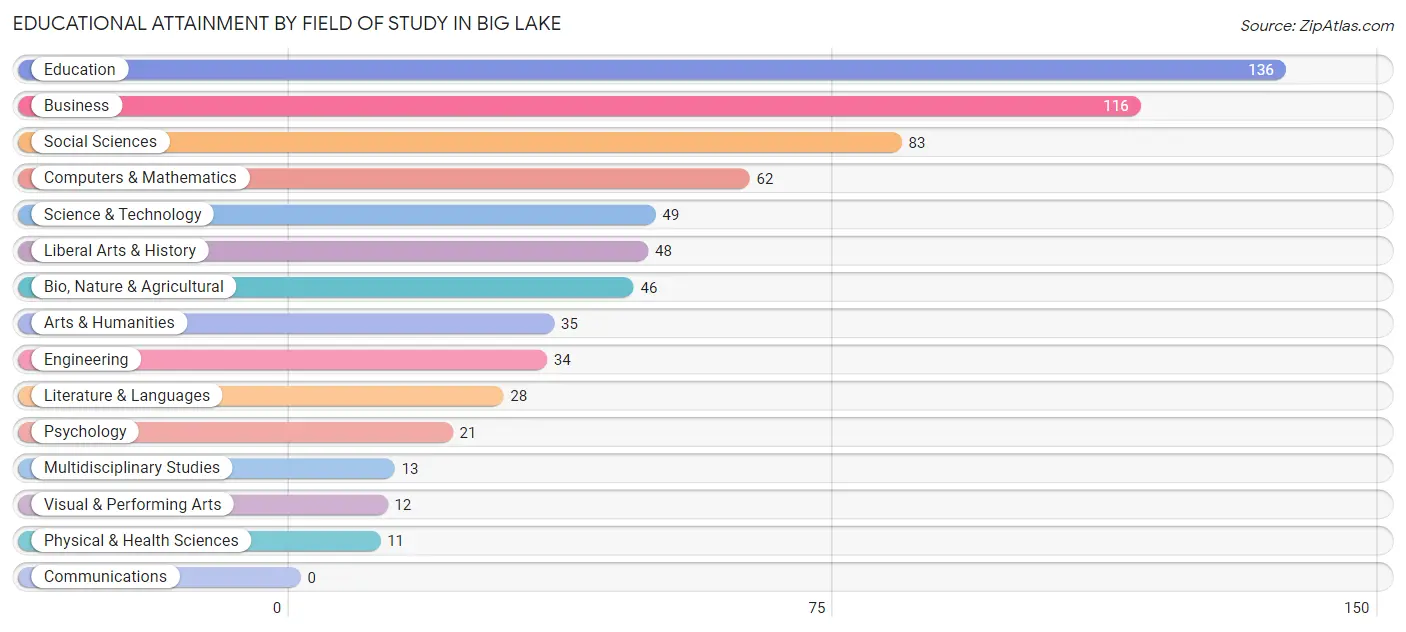
| Field of Study | # Graduates | % Graduates |
| Computers & Mathematics | 62 | 8.9% |
| Bio, Nature & Agricultural | 46 | 6.6% |
| Physical & Health Sciences | 11 | 1.6% |
| Psychology | 21 | 3.0% |
| Social Sciences | 83 | 12.0% |
| Engineering | 34 | 4.9% |
| Multidisciplinary Studies | 13 | 1.9% |
| Science & Technology | 49 | 7.1% |
| Business | 116 | 16.7% |
| Education | 136 | 19.6% |
| Literature & Languages | 28 | 4.0% |
| Liberal Arts & History | 48 | 6.9% |
| Visual & Performing Arts | 12 | 1.7% |
| Communications | 0 | 0.0% |
| Arts & Humanities | 35 | 5.0% |
| Total | 694 | 100.0% |
Transportation & Commute in Big Lake
Vehicle Availability by Sex in Big Lake
The most prevalent vehicle ownership categories in Big Lake are males with 2 vehicles (275, accounting for 55.6%) and females with 2 vehicles (207, making up 77.0%).
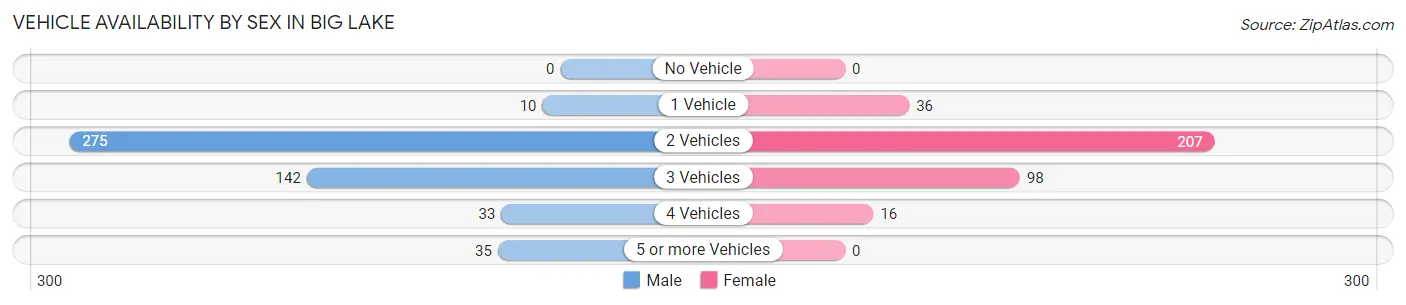
| Vehicles Available | Male | Female |
| No Vehicle | 0 (0.0%) | 0 (0.0%) |
| 1 Vehicle | 10 (2.0%) | 36 (10.1%) |
| 2 Vehicles | 275 (55.6%) | 207 (58.0%) |
| 3 Vehicles | 142 (28.7%) | 98 (27.5%) |
| 4 Vehicles | 33 (6.7%) | 16 (4.5%) |
| 5 or more Vehicles | 35 (7.1%) | 0 (0.0%) |
| Total | 495 (100.0%) | 357 (100.0%) |
Commute Time in Big Lake
The most frequently occuring commute durations in Big Lake are 15 to 19 minutes (219 commuters, 30.1%), 10 to 14 minutes (178 commuters, 24.4%), and 40 to 44 minutes (92 commuters, 12.6%).
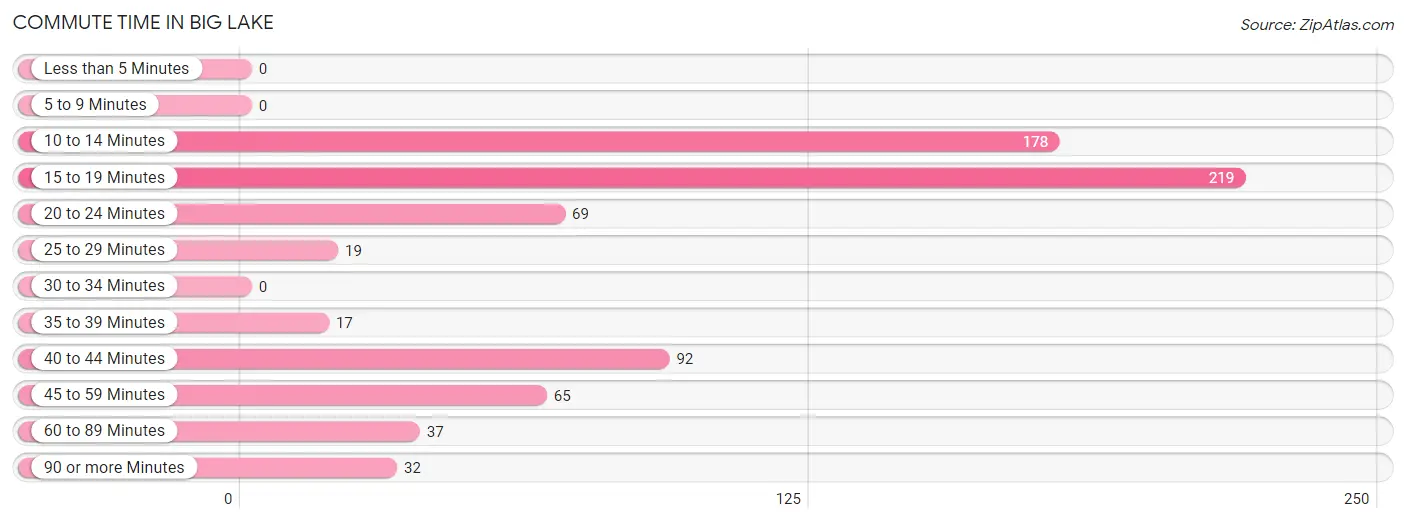
| Commute Time | # Commuters | % Commuters |
| Less than 5 Minutes | 0 | 0.0% |
| 5 to 9 Minutes | 0 | 0.0% |
| 10 to 14 Minutes | 178 | 24.4% |
| 15 to 19 Minutes | 219 | 30.1% |
| 20 to 24 Minutes | 69 | 9.5% |
| 25 to 29 Minutes | 19 | 2.6% |
| 30 to 34 Minutes | 0 | 0.0% |
| 35 to 39 Minutes | 17 | 2.3% |
| 40 to 44 Minutes | 92 | 12.6% |
| 45 to 59 Minutes | 65 | 8.9% |
| 60 to 89 Minutes | 37 | 5.1% |
| 90 or more Minutes | 32 | 4.4% |
Commute Time by Sex in Big Lake
The most common commute times in Big Lake are 10 to 14 minutes (93 commuters, 22.0%) for males and 15 to 19 minutes (138 commuters, 45.1%) for females.
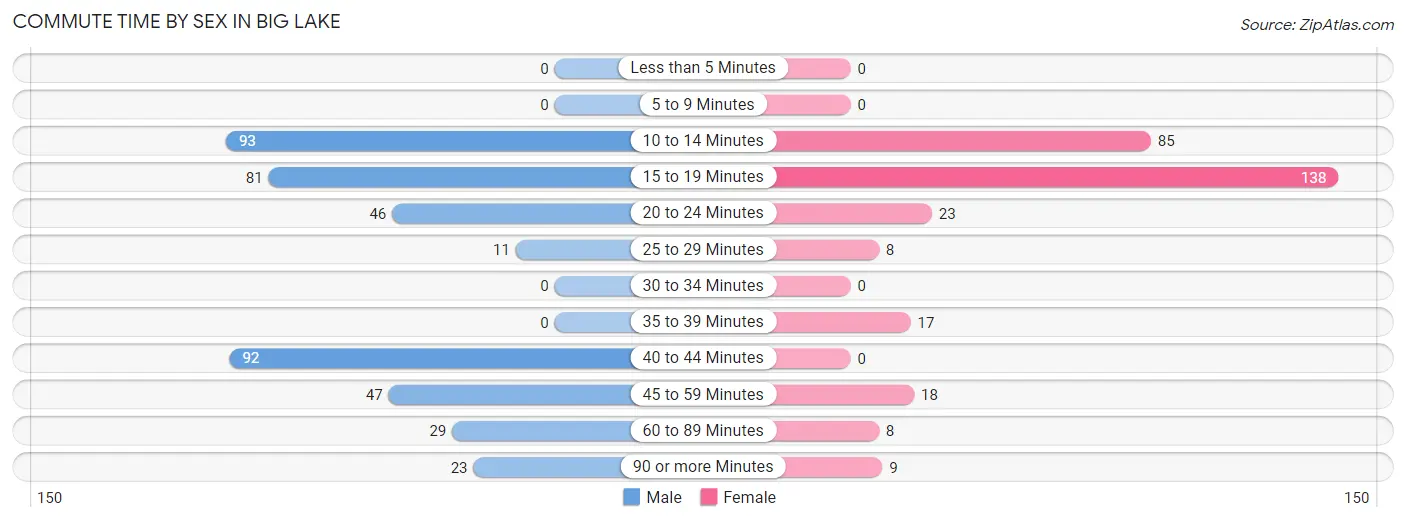
| Commute Time | Male | Female |
| Less than 5 Minutes | 0 (0.0%) | 0 (0.0%) |
| 5 to 9 Minutes | 0 (0.0%) | 0 (0.0%) |
| 10 to 14 Minutes | 93 (22.0%) | 85 (27.8%) |
| 15 to 19 Minutes | 81 (19.2%) | 138 (45.1%) |
| 20 to 24 Minutes | 46 (10.9%) | 23 (7.5%) |
| 25 to 29 Minutes | 11 (2.6%) | 8 (2.6%) |
| 30 to 34 Minutes | 0 (0.0%) | 0 (0.0%) |
| 35 to 39 Minutes | 0 (0.0%) | 17 (5.6%) |
| 40 to 44 Minutes | 92 (21.8%) | 0 (0.0%) |
| 45 to 59 Minutes | 47 (11.1%) | 18 (5.9%) |
| 60 to 89 Minutes | 29 (6.9%) | 8 (2.6%) |
| 90 or more Minutes | 23 (5.4%) | 9 (2.9%) |
Time of Departure to Work by Sex in Big Lake
The most frequent times of departure to work in Big Lake are 6:30 AM to 6:59 AM (62, 14.7%) for males and 9:00 AM to 9:59 AM (84, 27.5%) for females.
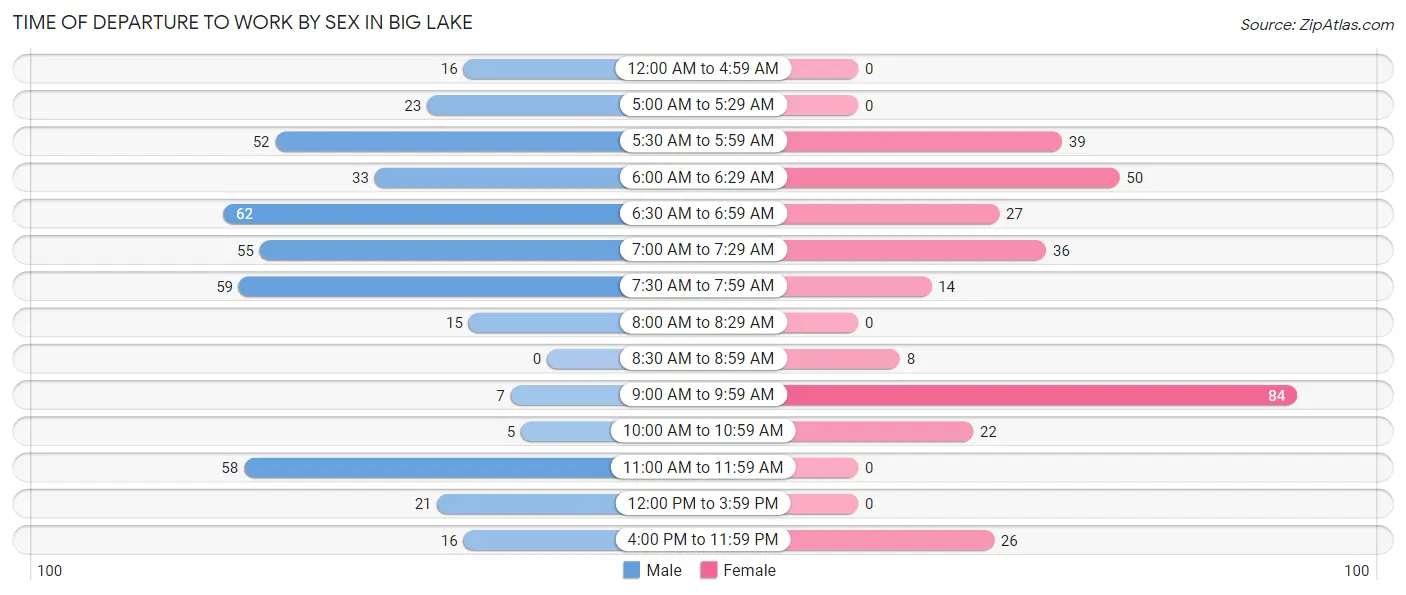
| Time of Departure | Male | Female |
| 12:00 AM to 4:59 AM | 16 (3.8%) | 0 (0.0%) |
| 5:00 AM to 5:29 AM | 23 (5.4%) | 0 (0.0%) |
| 5:30 AM to 5:59 AM | 52 (12.3%) | 39 (12.8%) |
| 6:00 AM to 6:29 AM | 33 (7.8%) | 50 (16.3%) |
| 6:30 AM to 6:59 AM | 62 (14.7%) | 27 (8.8%) |
| 7:00 AM to 7:29 AM | 55 (13.0%) | 36 (11.8%) |
| 7:30 AM to 7:59 AM | 59 (14.0%) | 14 (4.6%) |
| 8:00 AM to 8:29 AM | 15 (3.5%) | 0 (0.0%) |
| 8:30 AM to 8:59 AM | 0 (0.0%) | 8 (2.6%) |
| 9:00 AM to 9:59 AM | 7 (1.7%) | 84 (27.5%) |
| 10:00 AM to 10:59 AM | 5 (1.2%) | 22 (7.2%) |
| 11:00 AM to 11:59 AM | 58 (13.7%) | 0 (0.0%) |
| 12:00 PM to 3:59 PM | 21 (5.0%) | 0 (0.0%) |
| 4:00 PM to 11:59 PM | 16 (3.8%) | 26 (8.5%) |
| Total | 422 (100.0%) | 306 (100.0%) |
Housing Occupancy in Big Lake
Occupancy by Ownership in Big Lake
Of the total 950 dwellings in Big Lake, owner-occupied units account for 809 (85.2%), while renter-occupied units make up 141 (14.8%).
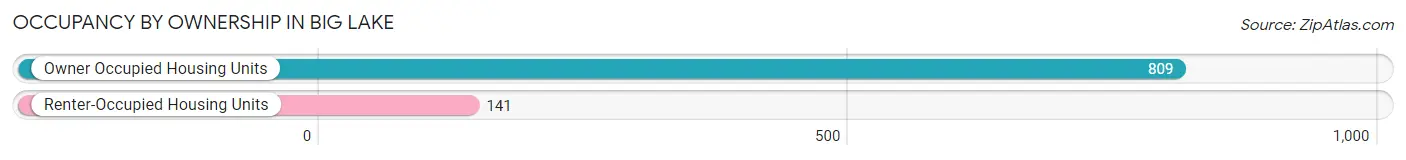
| Occupancy | # Housing Units | % Housing Units |
| Owner Occupied Housing Units | 809 | 85.2% |
| Renter-Occupied Housing Units | 141 | 14.8% |
| Total Occupied Housing Units | 950 | 100.0% |
Occupancy by Household Size in Big Lake
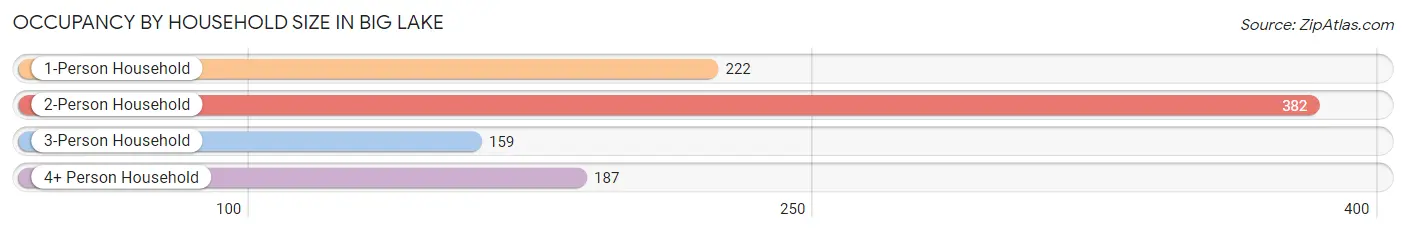
| Household Size | # Housing Units | % Housing Units |
| 1-Person Household | 222 | 23.4% |
| 2-Person Household | 382 | 40.2% |
| 3-Person Household | 159 | 16.7% |
| 4+ Person Household | 187 | 19.7% |
| Total Housing Units | 950 | 100.0% |
Occupancy by Ownership by Household Size in Big Lake
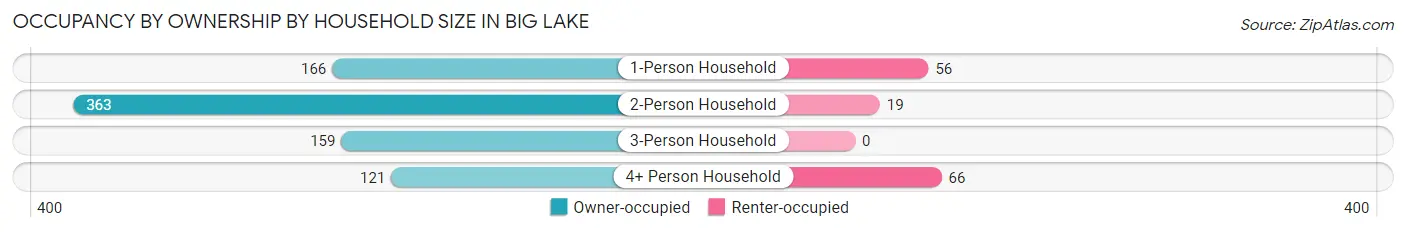
| Household Size | Owner-occupied | Renter-occupied |
| 1-Person Household | 166 (74.8%) | 56 (25.2%) |
| 2-Person Household | 363 (95.0%) | 19 (5.0%) |
| 3-Person Household | 159 (100.0%) | 0 (0.0%) |
| 4+ Person Household | 121 (64.7%) | 66 (35.3%) |
| Total Housing Units | 809 (85.2%) | 141 (14.8%) |
Occupancy by Educational Attainment in Big Lake
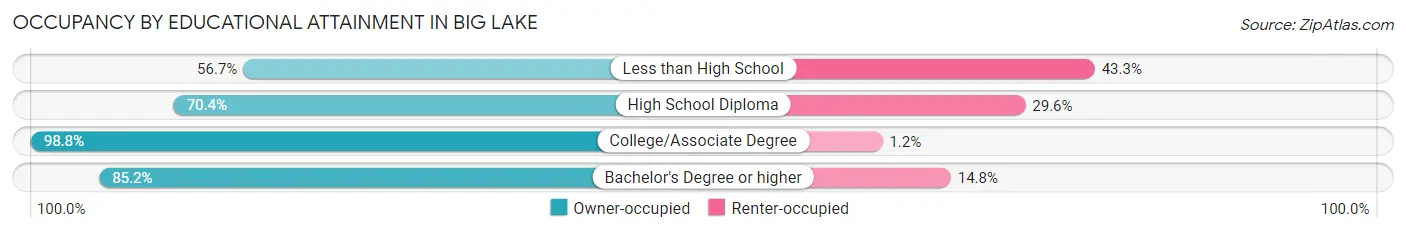
| Household Size | Owner-occupied | Renter-occupied |
| Less than High School | 17 (56.7%) | 13 (43.3%) |
| High School Diploma | 169 (70.4%) | 71 (29.6%) |
| College/Associate Degree | 318 (98.8%) | 4 (1.2%) |
| Bachelor's Degree or higher | 305 (85.2%) | 53 (14.8%) |
Occupancy by Age of Householder in Big Lake
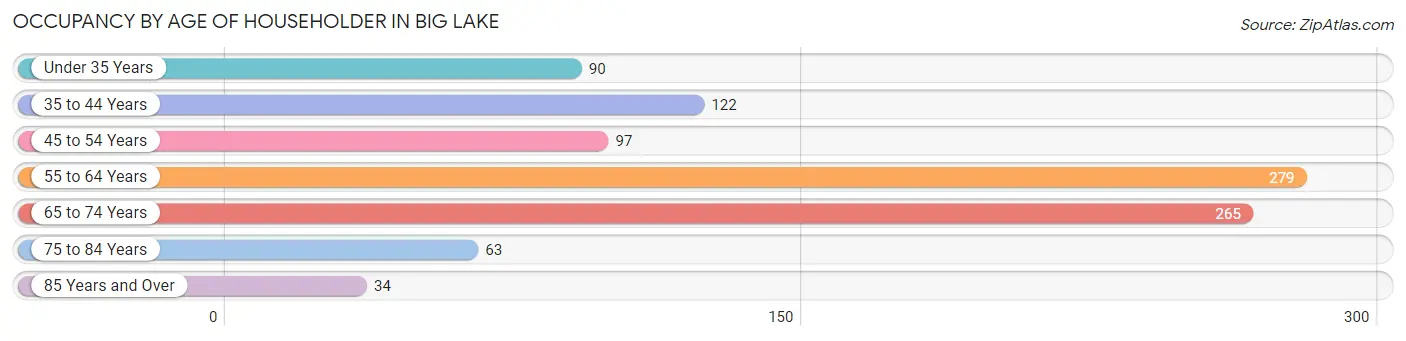
| Age Bracket | # Households | % Households |
| Under 35 Years | 90 | 9.5% |
| 35 to 44 Years | 122 | 12.8% |
| 45 to 54 Years | 97 | 10.2% |
| 55 to 64 Years | 279 | 29.4% |
| 65 to 74 Years | 265 | 27.9% |
| 75 to 84 Years | 63 | 6.6% |
| 85 Years and Over | 34 | 3.6% |
| Total | 950 | 100.0% |
Housing Finances in Big Lake
Median Income by Occupancy in Big Lake
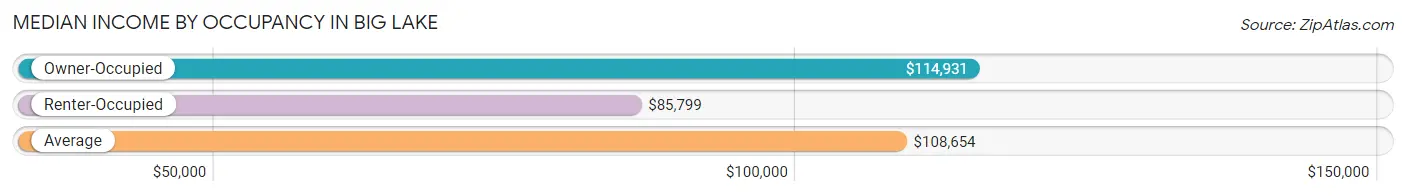
| Occupancy Type | # Households | Median Income |
| Owner-Occupied | 809 (85.2%) | $114,931 |
| Renter-Occupied | 141 (14.8%) | $85,799 |
| Average | 950 (100.0%) | $108,654 |
Occupancy by Householder Income Bracket in Big Lake
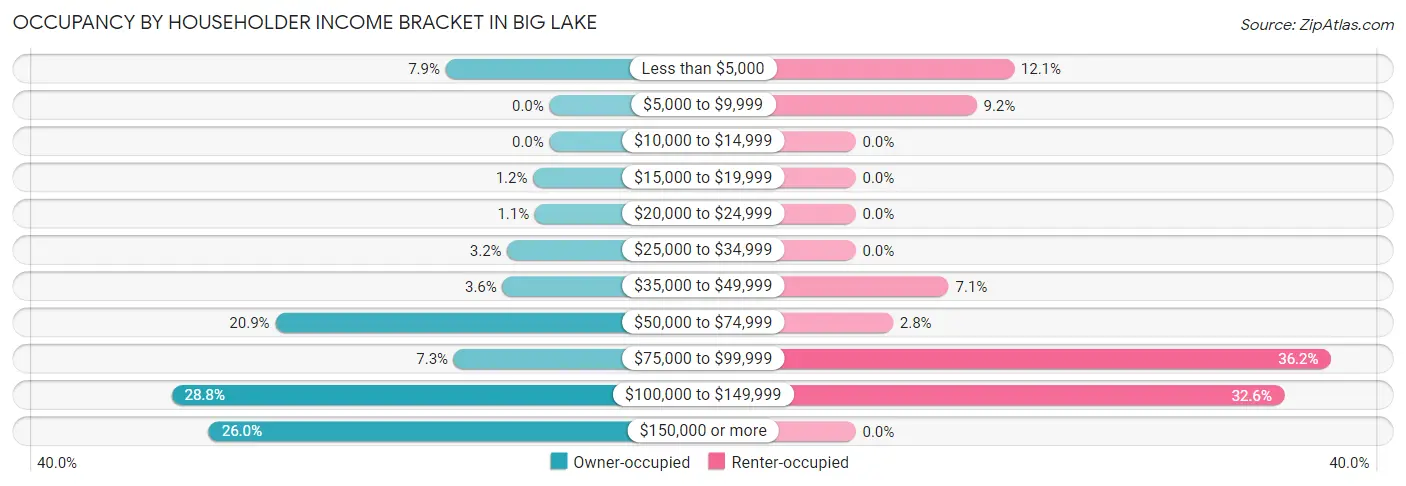
| Income Bracket | Owner-occupied | Renter-occupied |
| Less than $5,000 | 64 (7.9%) | 17 (12.1%) |
| $5,000 to $9,999 | 0 (0.0%) | 13 (9.2%) |
| $10,000 to $14,999 | 0 (0.0%) | 0 (0.0%) |
| $15,000 to $19,999 | 10 (1.2%) | 0 (0.0%) |
| $20,000 to $24,999 | 9 (1.1%) | 0 (0.0%) |
| $25,000 to $34,999 | 26 (3.2%) | 0 (0.0%) |
| $35,000 to $49,999 | 29 (3.6%) | 10 (7.1%) |
| $50,000 to $74,999 | 169 (20.9%) | 4 (2.8%) |
| $75,000 to $99,999 | 59 (7.3%) | 51 (36.2%) |
| $100,000 to $149,999 | 233 (28.8%) | 46 (32.6%) |
| $150,000 or more | 210 (26.0%) | 0 (0.0%) |
| Total | 809 (100.0%) | 141 (100.0%) |
Monthly Housing Cost Tiers in Big Lake
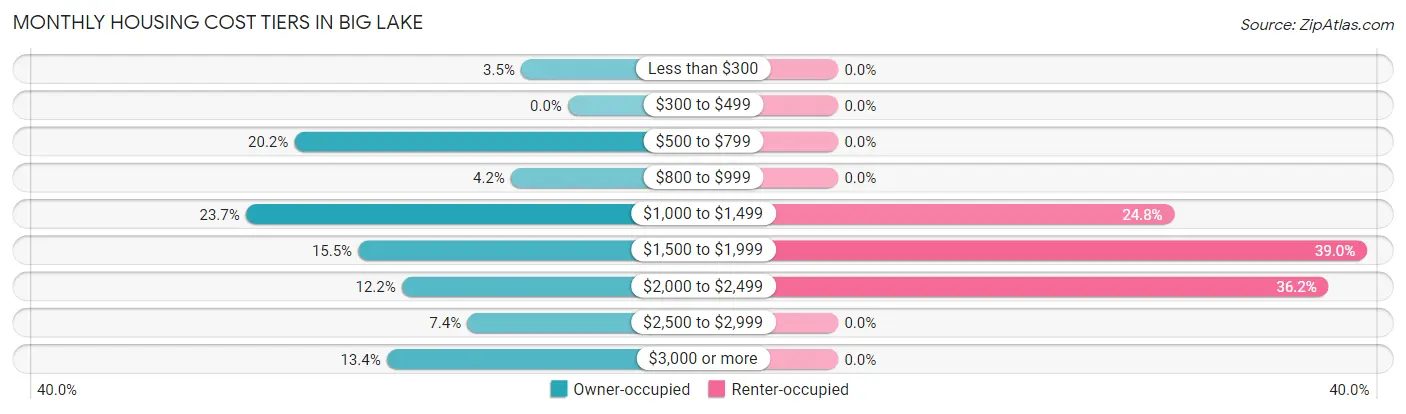
| Monthly Cost | Owner-occupied | Renter-occupied |
| Less than $300 | 28 (3.5%) | 0 (0.0%) |
| $300 to $499 | 0 (0.0%) | 0 (0.0%) |
| $500 to $799 | 163 (20.2%) | 0 (0.0%) |
| $800 to $999 | 34 (4.2%) | 0 (0.0%) |
| $1,000 to $1,499 | 192 (23.7%) | 35 (24.8%) |
| $1,500 to $1,999 | 125 (15.4%) | 55 (39.0%) |
| $2,000 to $2,499 | 99 (12.2%) | 51 (36.2%) |
| $2,500 to $2,999 | 60 (7.4%) | 0 (0.0%) |
| $3,000 or more | 108 (13.4%) | 0 (0.0%) |
| Total | 809 (100.0%) | 141 (100.0%) |
Physical Housing Characteristics in Big Lake
Housing Structures in Big Lake
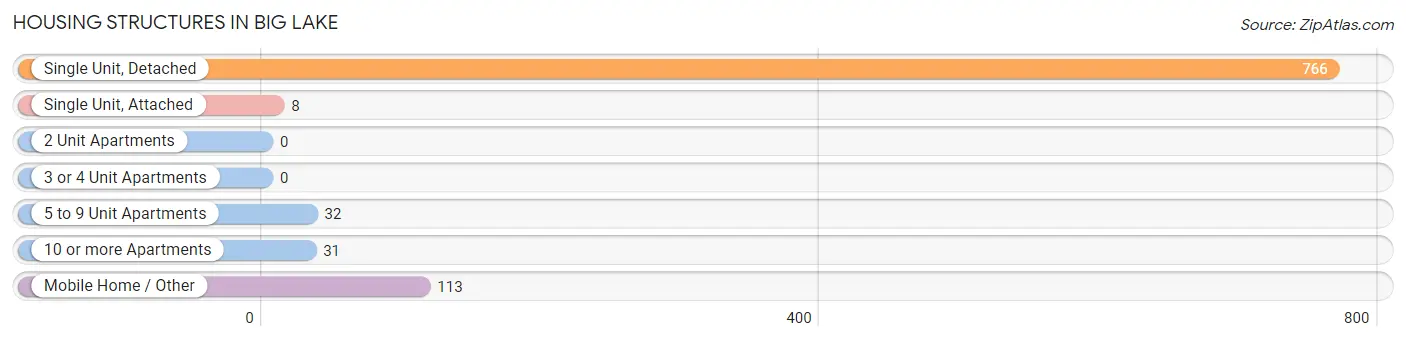
| Structure Type | # Housing Units | % Housing Units |
| Single Unit, Detached | 766 | 80.6% |
| Single Unit, Attached | 8 | 0.8% |
| 2 Unit Apartments | 0 | 0.0% |
| 3 or 4 Unit Apartments | 0 | 0.0% |
| 5 to 9 Unit Apartments | 32 | 3.4% |
| 10 or more Apartments | 31 | 3.3% |
| Mobile Home / Other | 113 | 11.9% |
| Total | 950 | 100.0% |
Housing Structures by Occupancy in Big Lake
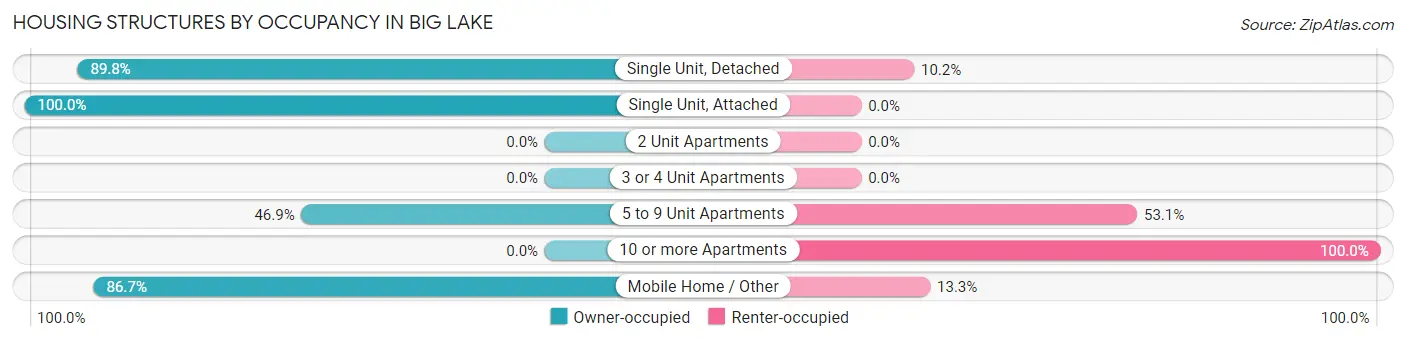
| Structure Type | Owner-occupied | Renter-occupied |
| Single Unit, Detached | 688 (89.8%) | 78 (10.2%) |
| Single Unit, Attached | 8 (100.0%) | 0 (0.0%) |
| 2 Unit Apartments | 0 (0.0%) | 0 (0.0%) |
| 3 or 4 Unit Apartments | 0 (0.0%) | 0 (0.0%) |
| 5 to 9 Unit Apartments | 15 (46.9%) | 17 (53.1%) |
| 10 or more Apartments | 0 (0.0%) | 31 (100.0%) |
| Mobile Home / Other | 98 (86.7%) | 15 (13.3%) |
| Total | 809 (85.2%) | 141 (14.8%) |
Housing Structures by Number of Rooms in Big Lake
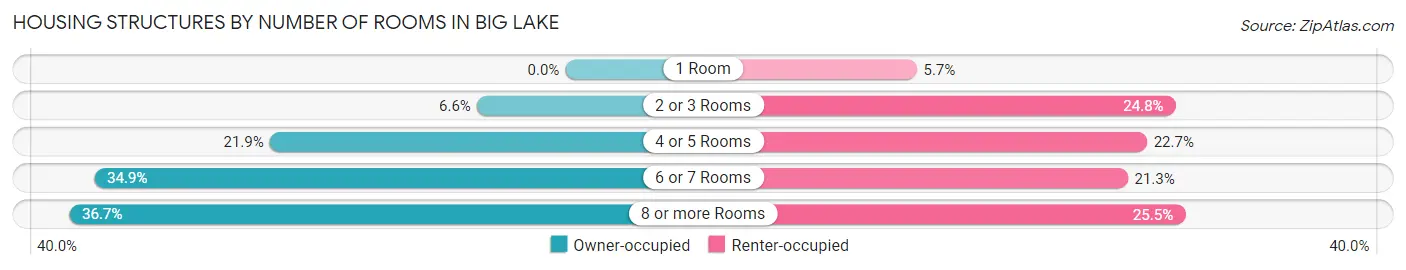
| Number of Rooms | Owner-occupied | Renter-occupied |
| 1 Room | 0 (0.0%) | 8 (5.7%) |
| 2 or 3 Rooms | 53 (6.6%) | 35 (24.8%) |
| 4 or 5 Rooms | 177 (21.9%) | 32 (22.7%) |
| 6 or 7 Rooms | 282 (34.9%) | 30 (21.3%) |
| 8 or more Rooms | 297 (36.7%) | 36 (25.5%) |
| Total | 809 (100.0%) | 141 (100.0%) |
Housing Structure by Heating Type in Big Lake

| Heating Type | Owner-occupied | Renter-occupied |
| Utility Gas | 411 (50.8%) | 30 (21.3%) |
| Bottled, Tank, or LP Gas | 42 (5.2%) | 51 (36.2%) |
| Electricity | 314 (38.8%) | 60 (42.5%) |
| Fuel Oil or Kerosene | 0 (0.0%) | 0 (0.0%) |
| Coal or Coke | 0 (0.0%) | 0 (0.0%) |
| All other Fuels | 42 (5.2%) | 0 (0.0%) |
| No Fuel Used | 0 (0.0%) | 0 (0.0%) |
| Total | 809 (100.0%) | 141 (100.0%) |
Household Vehicle Usage in Big Lake
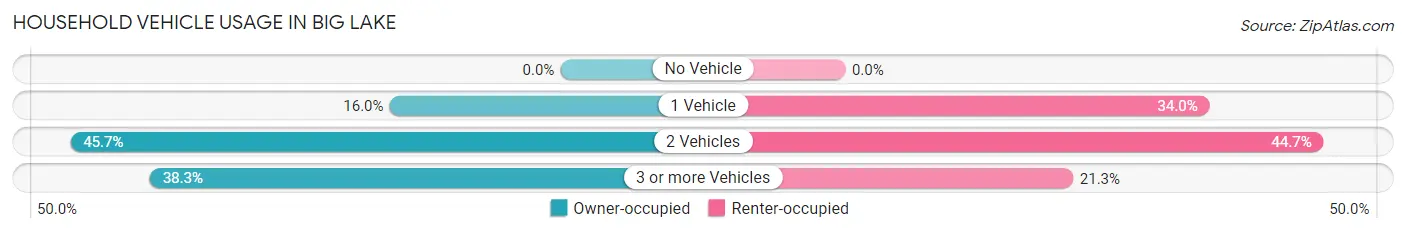
| Vehicles per Household | Owner-occupied | Renter-occupied |
| No Vehicle | 0 (0.0%) | 0 (0.0%) |
| 1 Vehicle | 129 (16.0%) | 48 (34.0%) |
| 2 Vehicles | 370 (45.7%) | 63 (44.7%) |
| 3 or more Vehicles | 310 (38.3%) | 30 (21.3%) |
| Total | 809 (100.0%) | 141 (100.0%) |
Real Estate & Mortgages in Big Lake
Real Estate and Mortgage Overview in Big Lake
| Characteristic | Without Mortgage | With Mortgage |
| Housing Units | 316 | 493 |
| Median Property Value | $533,700 | $591,900 |
| Median Household Income | $73,750 | $163 |
| Monthly Housing Costs | $696 | $108 |
| Real Estate Taxes | $4,667 | $0 |
Property Value by Mortgage Status in Big Lake

| Property Value | Without Mortgage | With Mortgage |
| Less than $50,000 | 28 (8.9%) | 0 (0.0%) |
| $50,000 to $99,999 | 9 (2.9%) | 0 (0.0%) |
| $100,000 to $299,999 | 68 (21.5%) | 54 (11.0%) |
| $300,000 to $499,999 | 36 (11.4%) | 101 (20.5%) |
| $500,000 to $749,999 | 126 (39.9%) | 249 (50.5%) |
| $750,000 to $999,999 | 49 (15.5%) | 63 (12.8%) |
| $1,000,000 or more | 0 (0.0%) | 26 (5.3%) |
| Total | 316 (100.0%) | 493 (100.0%) |
Household Income by Mortgage Status in Big Lake
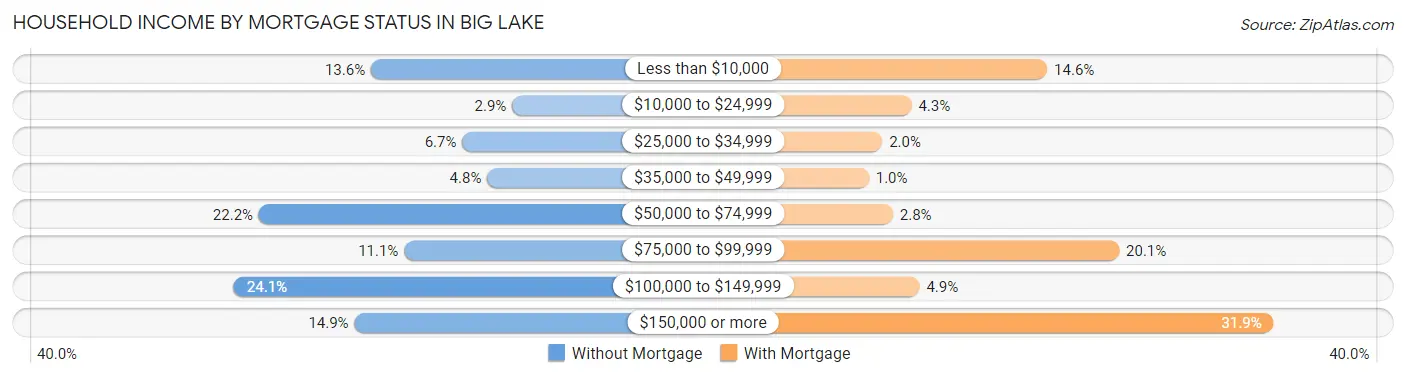
| Household Income | Without Mortgage | With Mortgage |
| Less than $10,000 | 43 (13.6%) | 72 (14.6%) |
| $10,000 to $24,999 | 9 (2.9%) | 21 (4.3%) |
| $25,000 to $34,999 | 21 (6.7%) | 10 (2.0%) |
| $35,000 to $49,999 | 15 (4.8%) | 5 (1.0%) |
| $50,000 to $74,999 | 70 (22.2%) | 14 (2.8%) |
| $75,000 to $99,999 | 35 (11.1%) | 99 (20.1%) |
| $100,000 to $149,999 | 76 (24.0%) | 24 (4.9%) |
| $150,000 or more | 47 (14.9%) | 157 (31.9%) |
| Total | 316 (100.0%) | 493 (100.0%) |
Property Value to Household Income Ratio in Big Lake
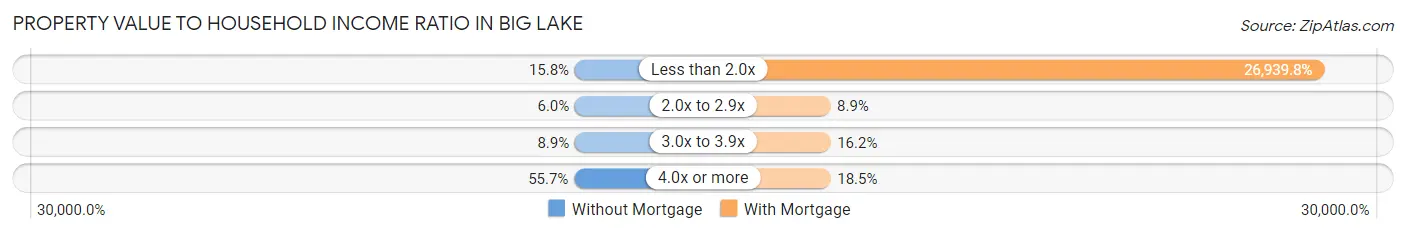
| Value-to-Income Ratio | Without Mortgage | With Mortgage |
| Less than 2.0x | 50 (15.8%) | 132,813 (26,939.8%) |
| 2.0x to 2.9x | 19 (6.0%) | 44 (8.9%) |
| 3.0x to 3.9x | 28 (8.9%) | 80 (16.2%) |
| 4.0x or more | 176 (55.7%) | 91 (18.5%) |
| Total | 316 (100.0%) | 493 (100.0%) |
Real Estate Taxes by Mortgage Status in Big Lake
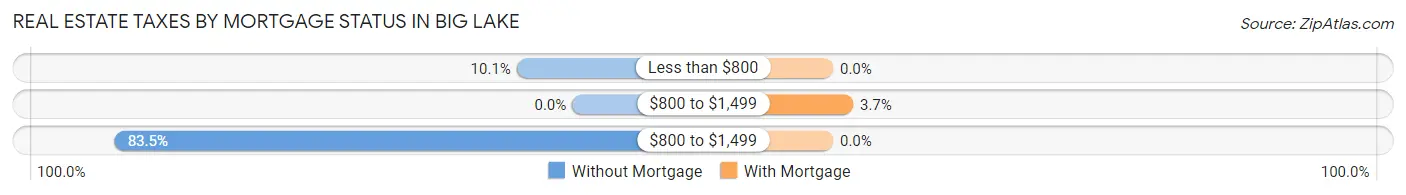
| Property Taxes | Without Mortgage | With Mortgage |
| Less than $800 | 32 (10.1%) | 0 (0.0%) |
| $800 to $1,499 | 0 (0.0%) | 18 (3.6%) |
| $800 to $1,499 | 264 (83.5%) | 0 (0.0%) |
| Total | 316 (100.0%) | 493 (100.0%) |
Health & Disability in Big Lake
Health Insurance Coverage by Age in Big Lake
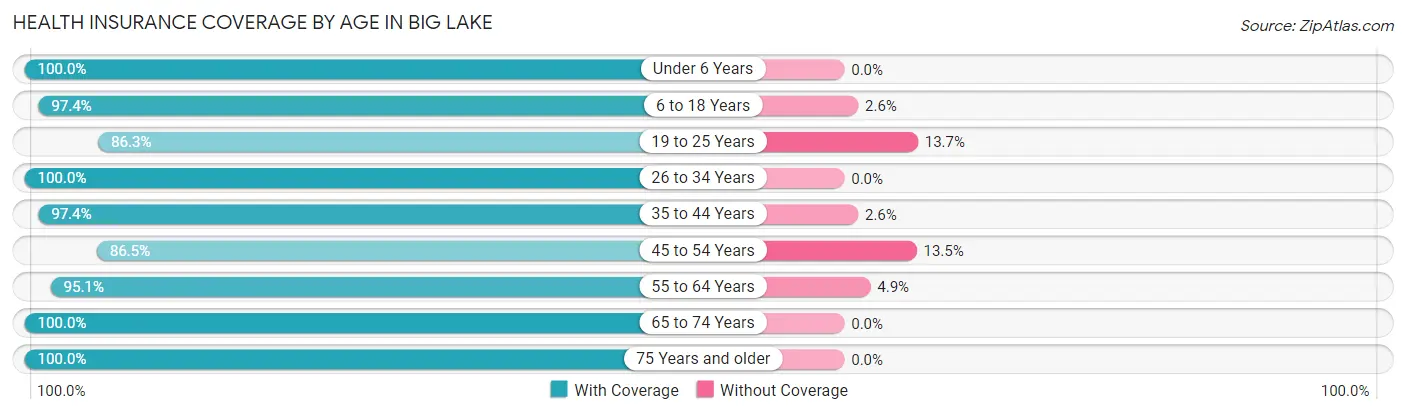
| Age Bracket | With Coverage | Without Coverage |
| Under 6 Years | 131 (100.0%) | 0 (0.0%) |
| 6 to 18 Years | 264 (97.4%) | 7 (2.6%) |
| 19 to 25 Years | 63 (86.3%) | 10 (13.7%) |
| 26 to 34 Years | 201 (100.0%) | 0 (0.0%) |
| 35 to 44 Years | 228 (97.4%) | 6 (2.6%) |
| 45 to 54 Years | 167 (86.5%) | 26 (13.5%) |
| 55 to 64 Years | 431 (95.1%) | 22 (4.9%) |
| 65 to 74 Years | 463 (100.0%) | 0 (0.0%) |
| 75 Years and older | 210 (100.0%) | 0 (0.0%) |
| Total | 2,158 (96.8%) | 71 (3.2%) |
Health Insurance Coverage by Citizenship Status in Big Lake
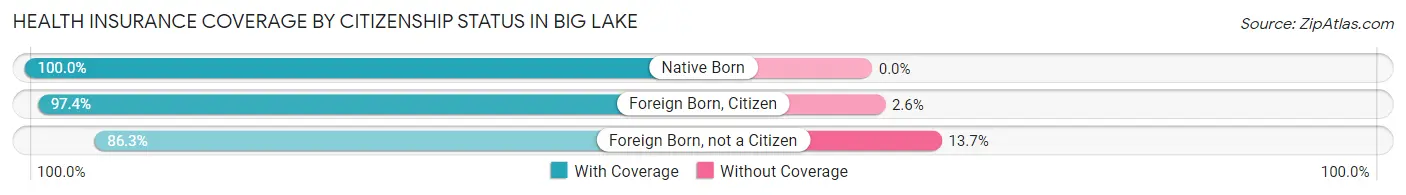
| Citizenship Status | With Coverage | Without Coverage |
| Native Born | 131 (100.0%) | 0 (0.0%) |
| Foreign Born, Citizen | 264 (97.4%) | 7 (2.6%) |
| Foreign Born, not a Citizen | 63 (86.3%) | 10 (13.7%) |
Health Insurance Coverage by Household Income in Big Lake
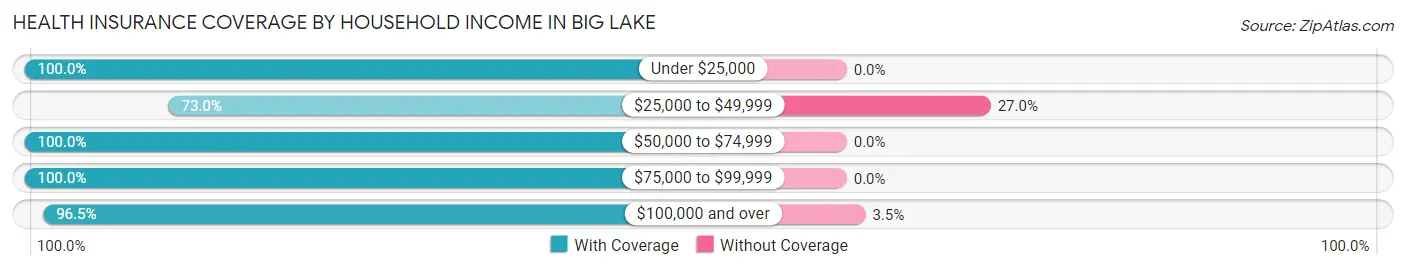
| Household Income | With Coverage | Without Coverage |
| Under $25,000 | 121 (100.0%) | 0 (0.0%) |
| $25,000 to $49,999 | 65 (73.0%) | 24 (27.0%) |
| $50,000 to $74,999 | 349 (100.0%) | 0 (0.0%) |
| $75,000 to $99,999 | 326 (100.0%) | 0 (0.0%) |
| $100,000 and over | 1,297 (96.5%) | 47 (3.5%) |
Public vs Private Health Insurance Coverage by Age in Big Lake
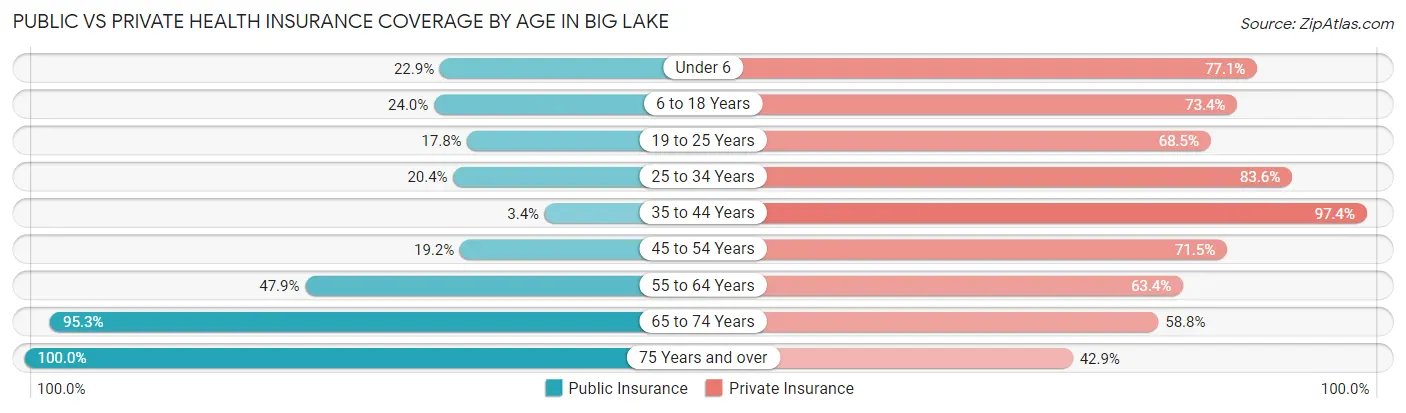
| Age Bracket | Public Insurance | Private Insurance |
| Under 6 | 30 (22.9%) | 101 (77.1%) |
| 6 to 18 Years | 65 (24.0%) | 199 (73.4%) |
| 19 to 25 Years | 13 (17.8%) | 50 (68.5%) |
| 25 to 34 Years | 41 (20.4%) | 168 (83.6%) |
| 35 to 44 Years | 8 (3.4%) | 228 (97.4%) |
| 45 to 54 Years | 37 (19.2%) | 138 (71.5%) |
| 55 to 64 Years | 217 (47.9%) | 287 (63.4%) |
| 65 to 74 Years | 441 (95.3%) | 272 (58.8%) |
| 75 Years and over | 210 (100.0%) | 90 (42.9%) |
| Total | 1,062 (47.6%) | 1,533 (68.8%) |
Disability Status by Sex by Age in Big Lake
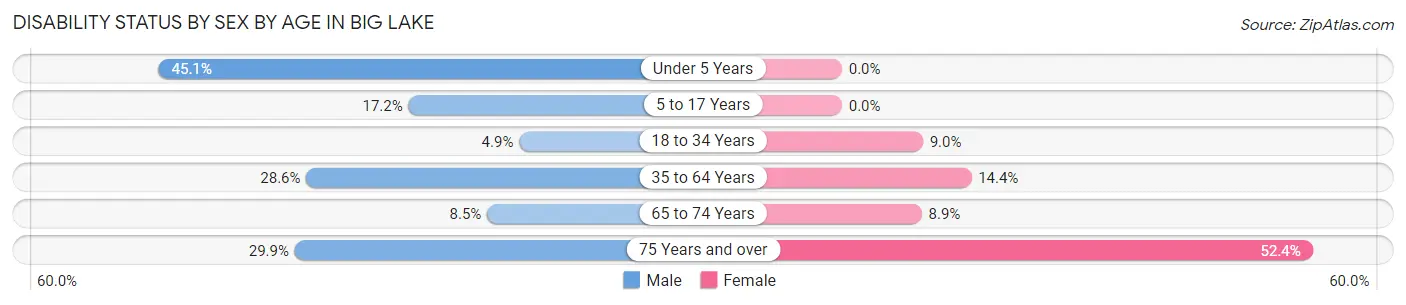
| Age Bracket | Male | Female |
| Under 5 Years | 32 (45.1%) | 0 (0.0%) |
| 5 to 17 Years | 30 (17.2%) | 0 (0.0%) |
| 18 to 34 Years | 8 (4.9%) | 10 (9.0%) |
| 35 to 64 Years | 91 (28.6%) | 81 (14.4%) |
| 65 to 74 Years | 24 (8.5%) | 16 (8.9%) |
| 75 Years and over | 32 (29.9%) | 54 (52.4%) |
Disability Class by Sex by Age in Big Lake
Disability Class: Hearing Difficulty
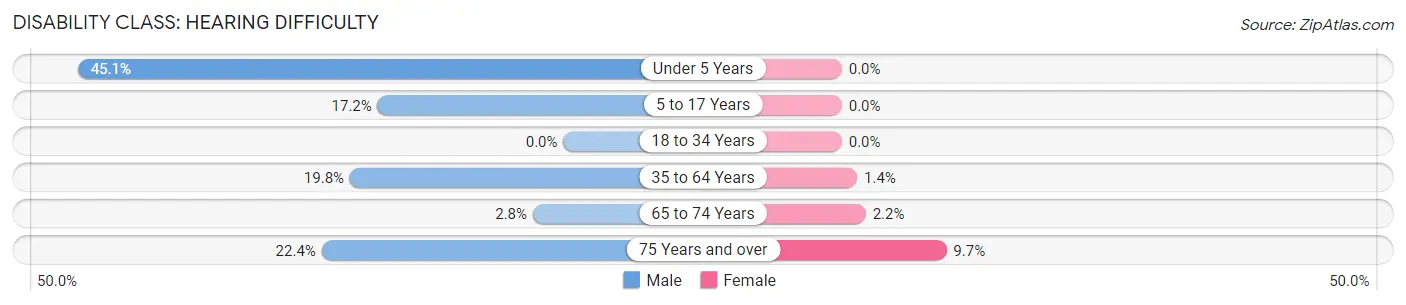
| Age Bracket | Male | Female |
| Under 5 Years | 32 (45.1%) | 0 (0.0%) |
| 5 to 17 Years | 30 (17.2%) | 0 (0.0%) |
| 18 to 34 Years | 0 (0.0%) | 0 (0.0%) |
| 35 to 64 Years | 63 (19.8%) | 8 (1.4%) |
| 65 to 74 Years | 8 (2.8%) | 4 (2.2%) |
| 75 Years and over | 24 (22.4%) | 10 (9.7%) |
Disability Class: Vision Difficulty
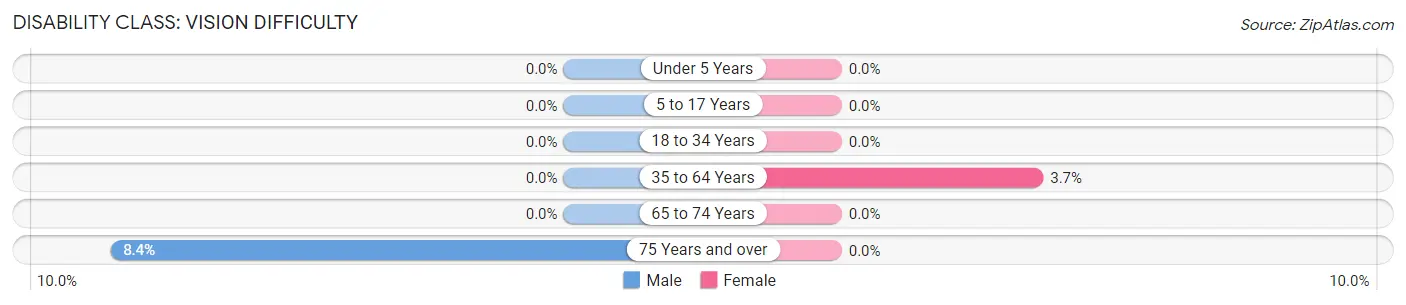
| Age Bracket | Male | Female |
| Under 5 Years | 0 (0.0%) | 0 (0.0%) |
| 5 to 17 Years | 0 (0.0%) | 0 (0.0%) |
| 18 to 34 Years | 0 (0.0%) | 0 (0.0%) |
| 35 to 64 Years | 0 (0.0%) | 21 (3.7%) |
| 65 to 74 Years | 0 (0.0%) | 0 (0.0%) |
| 75 Years and over | 9 (8.4%) | 0 (0.0%) |
Disability Class: Cognitive Difficulty
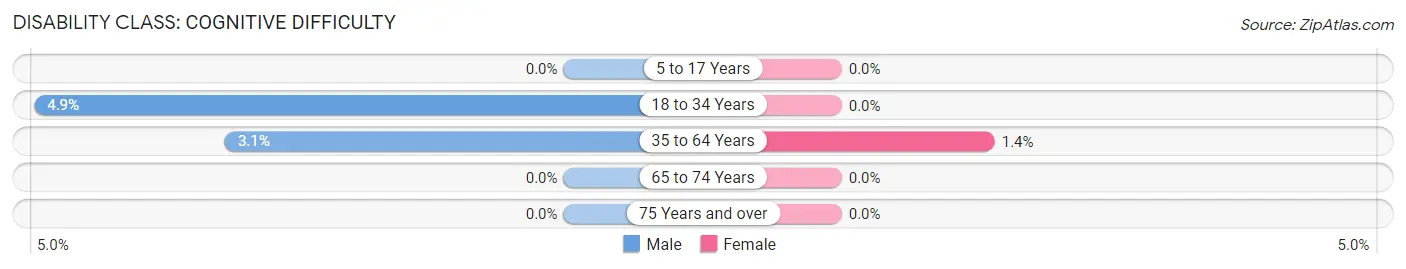
| Age Bracket | Male | Female |
| 5 to 17 Years | 0 (0.0%) | 0 (0.0%) |
| 18 to 34 Years | 8 (4.9%) | 0 (0.0%) |
| 35 to 64 Years | 10 (3.1%) | 8 (1.4%) |
| 65 to 74 Years | 0 (0.0%) | 0 (0.0%) |
| 75 Years and over | 0 (0.0%) | 0 (0.0%) |
Disability Class: Ambulatory Difficulty
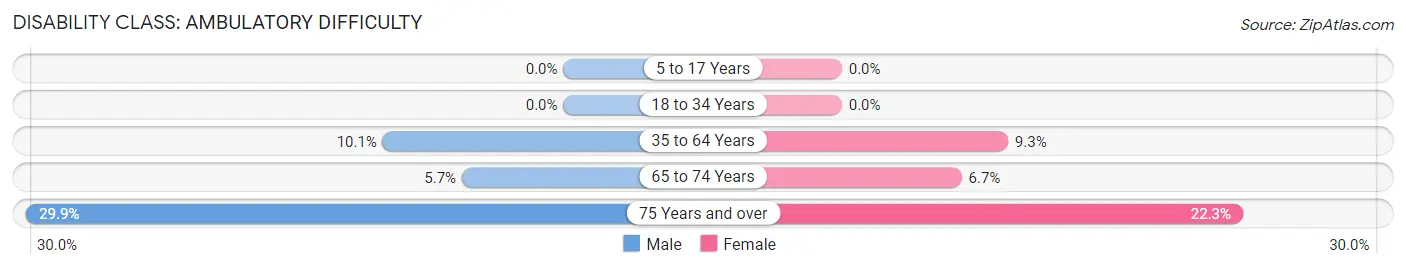
| Age Bracket | Male | Female |
| 5 to 17 Years | 0 (0.0%) | 0 (0.0%) |
| 18 to 34 Years | 0 (0.0%) | 0 (0.0%) |
| 35 to 64 Years | 32 (10.1%) | 52 (9.2%) |
| 65 to 74 Years | 16 (5.7%) | 12 (6.7%) |
| 75 Years and over | 32 (29.9%) | 23 (22.3%) |
Disability Class: Self-Care Difficulty
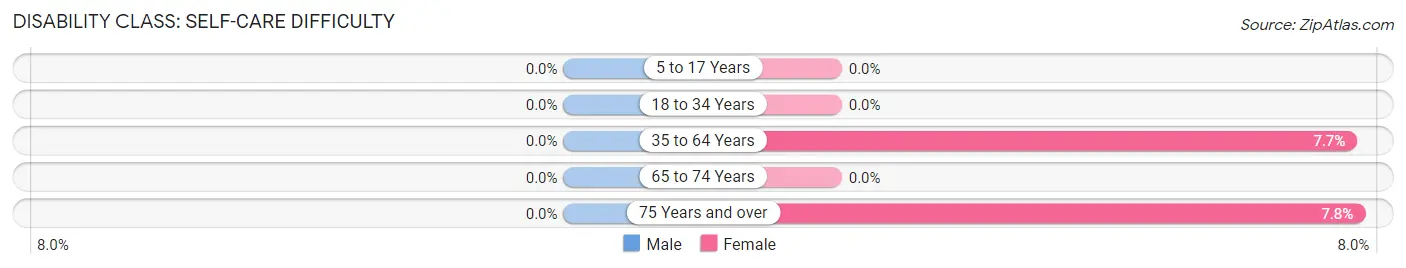
| Age Bracket | Male | Female |
| 5 to 17 Years | 0 (0.0%) | 0 (0.0%) |
| 18 to 34 Years | 0 (0.0%) | 0 (0.0%) |
| 35 to 64 Years | 0 (0.0%) | 43 (7.6%) |
| 65 to 74 Years | 0 (0.0%) | 0 (0.0%) |
| 75 Years and over | 0 (0.0%) | 8 (7.8%) |
Technology Access in Big Lake
Computing Device Access in Big Lake
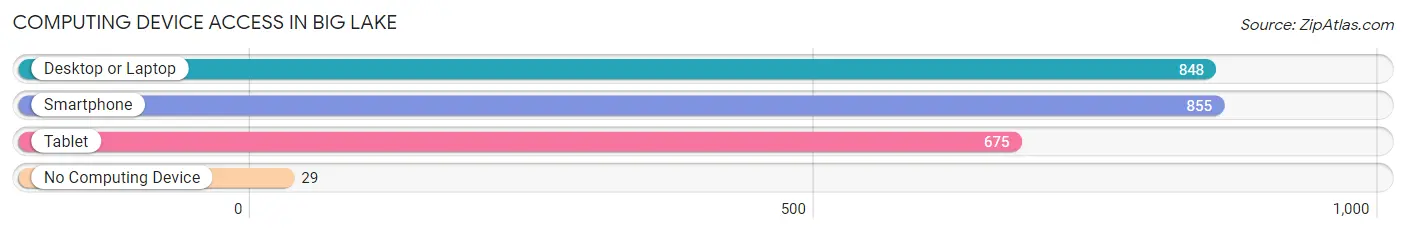
| Device Type | # Households | % Households |
| Desktop or Laptop | 848 | 89.3% |
| Smartphone | 855 | 90.0% |
| Tablet | 675 | 71.1% |
| No Computing Device | 29 | 3.0% |
| Total | 950 | 100.0% |
Internet Access in Big Lake
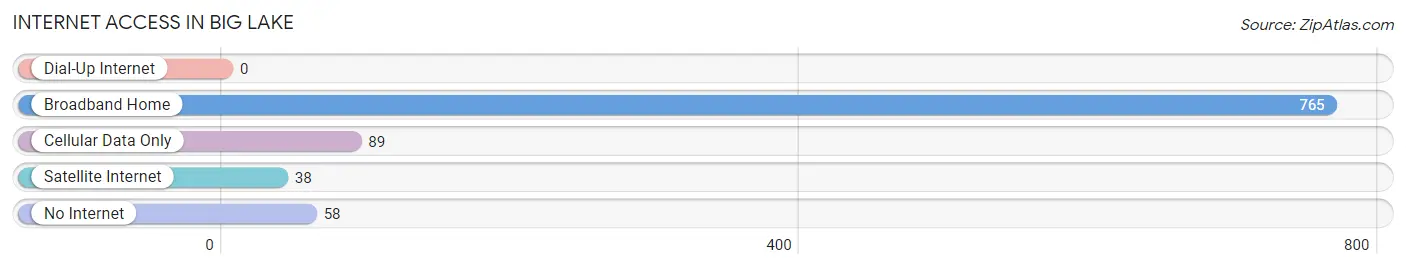
| Internet Type | # Households | % Households |
| Dial-Up Internet | 0 | 0.0% |
| Broadband Home | 765 | 80.5% |
| Cellular Data Only | 89 | 9.4% |
| Satellite Internet | 38 | 4.0% |
| No Internet | 58 | 6.1% |
| Total | 950 | 100.0% |
Big Lake Summary
Big Lake is a small unincorporated community located in Snohomish County, Washington, United States. It is situated on the northern shore of Big Lake, a large natural lake in the Cascade Mountains. The community is located approximately 25 miles northeast of Seattle and is part of the Seattle metropolitan area.
History
Big Lake was first settled in the late 1800s by homesteaders who were attracted to the area by its abundant natural resources. The first settlers were mostly loggers and farmers, and the area quickly became known for its timber and agricultural production. In the early 1900s, the area began to attract tourists, and the first resort was built on the lake in 1910.
The area continued to grow and develop throughout the 20th century, and in the 1950s, the Big Lake area was incorporated as a town. The town was later annexed by Snohomish County in the 1970s.
Geography
Big Lake is located in the Cascade Mountains of Washington State, approximately 25 miles northeast of Seattle. The community is situated on the northern shore of Big Lake, a large natural lake that is approximately 4 miles long and 2 miles wide. The lake is fed by several small streams and is surrounded by dense forests.
The area is characterized by its mountainous terrain, with elevations ranging from 500 to 1,500 feet. The climate is generally mild, with temperatures ranging from the mid-30s in the winter to the mid-70s in the summer.
Economy
The economy of Big Lake is largely based on tourism and recreation. The area is home to several resorts and campgrounds, as well as a variety of outdoor activities such as fishing, boating, and hiking. The area is also home to several small businesses, including restaurants, shops, and services.
Demographics
As of the 2010 census, the population of Big Lake was 1,845. The racial makeup of the town was 94.3% White, 0.7% African American, 0.7% Native American, 0.7% Asian, 0.2% Pacific Islander, and 2.6% from other races. The median household income was $50,938, and the median family income was $60,938. The per capita income was $25,938.
Conclusion
Big Lake is a small unincorporated community located in Snohomish County, Washington, United States. It is situated on the northern shore of Big Lake, a large natural lake in the Cascade Mountains. The community is known for its abundant natural resources and its tourism and recreation-based economy. The population of Big Lake was 1,845 as of the 2010 census, and the median household income was $50,938.
Common Questions
What is Per Capita Income in Big Lake?
Per Capita income in Big Lake is $49,990.
What is the Median Family Income in Big Lake?
Median Family Income in Big Lake is $127,965.
What is the Median Household income in Big Lake?
Median Household Income in Big Lake is $108,654.
What is Income or Wage Gap in Big Lake?
Income or Wage Gap in Big Lake is 19.9%.
Women in Big Lake earn 80.1 cents for every dollar earned by a man.
What is Inequality or Gini Index in Big Lake?
Inequality or Gini Index in Big Lake is 0.40.
What is the Total Population of Big Lake?
Total Population of Big Lake is 2,267.
What is the Total Male Population of Big Lake?
Total Male Population of Big Lake is 1,154.
What is the Total Female Population of Big Lake?
Total Female Population of Big Lake is 1,113.
What is the Ratio of Males per 100 Females in Big Lake?
There are 103.68 Males per 100 Females in Big Lake.
What is the Ratio of Females per 100 Males in Big Lake?
There are 96.45 Females per 100 Males in Big Lake.
What is the Median Population Age in Big Lake?
Median Population Age in Big Lake is 53.9 Years.
What is the Average Family Size in Big Lake
Average Family Size in Big Lake is 2.9 People.
What is the Average Household Size in Big Lake
Average Household Size in Big Lake is 2.4 People.
How Large is the Labor Force in Big Lake?
There are 896 People in the Labor Forcein in Big Lake.
What is the Percentage of People in the Labor Force in Big Lake?
47.6% of People are in the Labor Force in Big Lake.
What is the Unemployment Rate in Big Lake?
Unemployment Rate in Big Lake is 2.1%.